

The DOI matches its Crossref record; 47 of the 47 references it cites were found in a registry or an index.
Comparison of clustering tools in R for medium-sized 10x Genomics single-cell RNA-sequencing data
Open accessPublished version of a preprint
Abstract
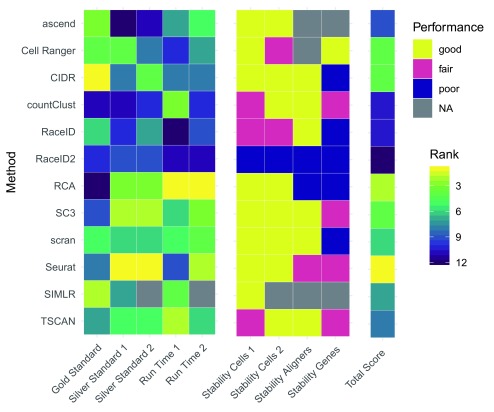
Background: The commercially available 10x Genomics protocol to generate droplet-based single-cell RNA-seq (scRNA-seq) data is enjoying growing popularity among researchers. Fundamental to the analysis of such scRNA-seq data is the ability to cluster similar or same cells into non-overlapping groups. Many competing methods have been proposed for this task, but there is currently little guidance with regards to which method to use. Methods: Here we use one gold standard 10x Genomics dataset, generated from the mixture of three cell lines, as well as three silver standard 10x Genomics datasets generated from peripheral blood mononuclear cells to examine not only the accuracy but also robustness of a dozen methods. Results: We found that some methods, including Seurat and Cell Ranger, outperform other methods, although performance seems to be dependent on the complexity of the studied system. Furthermore, we found that solutions produced by different methods have little in common with each other. Conclusions: In light of this, we conclude that the choice of clustering tool crucially determines interpretation of scRNA-seq data generated by 10x Genomics. Hence practitioners and consumers should remain vigilant about the outcome of 10x Genomics scRNA-seq analysis.
Overview
The claims and statistics of this paper haven’t been checked yet.
Run the check — free, no account needed. It reads the open-access text and checks the sources it cites.
Integrity signals
Registry
Cites
Statistics
Figures
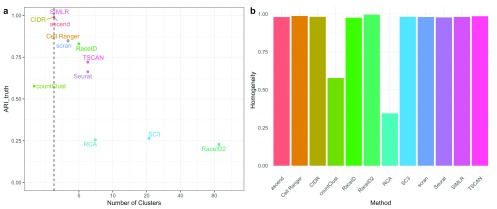
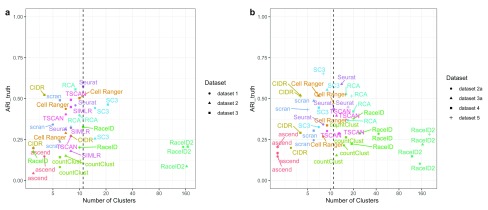
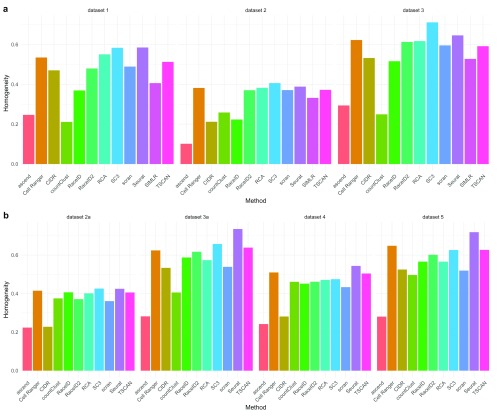
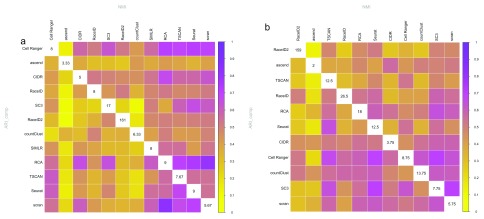
Verification
Claims the paper makes
The claims and statistics of this paper haven’t been checked yet.
Run the check — free, no account needed. It reads the open-access text and checks the sources it cites.
Claims other papers make about this one
Each is checked against this paper’s own text: does it say what the citing paper says it does?
The source backs part of the claim, not all of it — or backs it for a different population, condition or comparison.
In the citing paper
“Cluster co-membership alone, however, is insufficient to conclude that two cell populations from different organs represent the same or similar cell types; at any given resolution, unbiased clustering that groups related cells may also group unrelated cells21.”
From Single-cell transcriptomics of 20 mouse organs creates a Tabula Muris (2018) · cites this paper as [21]
Experimental — accuracy not yet measuredIn the citing paper
“Independent benchmarks5,50,51 showed that community detection based on graph modularity optimization via the Louvain algorithm works best for cluster identification.”
From Best practices for single-cell analysis across modalities (2023) · cites this paper as [51]
In the citing paper
“It has been shown to outperform other clustering methods for single‐cell RNA‐seq data (Duò et al, 2018; Freytag et al, 2018), and flow and mass cytometry data (Weber & Robinson, 2016).”
From Current best practices in single-cell RNA-seq analysis: a tutorial (2019) · cites this paper as Freytag et al, 2018
Self-check
Percentages, sums and reported differences re-computed from the paper’s own numbers.
The self-check needs the paper’s full text.
Citations
Cites
STAR: ultrafast universal RNA-seq aligner
Dobin, A., Davis, C. A., Schlesinger, F., Drenkow, J., Zaleski, C., Jha, S., Batut, P., Chaisson, M., & Gingeras, T. R. (2013) · Bioinformatics · doi:10.1093/bioinformatics/bts635 · Cited by 51,709
Integrating single-cell transcriptomic data across different conditions, technologies, and species
Butler, A., Hoffman, P., Smibert, P., Papalexi, E., & Satija, R. (2018) · Nature Biotechnology · doi:10.1038/nbt.4096 · Cited by 13,174
Hubert, L., & Arabie, P. (1985) · Journal of Classification · doi:10.1007/bf01908075 · Cited by 8,219
Massively parallel digital transcriptional profiling of single cells
Zheng, G. X. Y., Terry, J. M., Belgrader, P., Ryvkin, P., Bent, Z. W., Wilson, R., Ziraldo, S. B., Wheeler, T. D., McDermott, G. P., Zhu, J., et al. (2017) · Nature Communications · doi:10.1038/ncomms14049 · Cited by 7,353
Trapnell, C., Cacchiarelli, D., Grimsby, J., Pokharel, P., Li, S., Morse, M., Lennon, N. J., Livak, K. J., Mikkelsen, T. S., & Rinn, J. L. (2014) · Nature Biotechnology · doi:10.1038/nbt.2859 · Cited by 7,314
Highly parallel genome-wide expression profiling of individual cells using nanoliter droplets.
Macosko, E. Z., Basu, A., Satija, R., Nemesh, J., Shekhar, K., Goldman, M., Tirosh, I., Bialas, A. R., Kamitaki, N., Martersteck, E. M., et al. (2015) · Cell · doi:10.1016/j.cell.2015.05.002 · Cited by 7,110
The Subread aligner: fast, accurate and scalable read mapping by seed-and-vote
Liao, Y., Smyth, G. K., & Shi, W. (2013) · Nucleic Acids Research · doi:10.1093/nar/gkt214 · Cited by 3,064
An overlap invariant entropy measure of 3D medical image alignment
Studholme, C., Hill, D., & Hawkes, D. J. (1999) · Pattern Recognition · doi:10.1016/s0031-3203(98)00091-0 · Cited by 2,167
McCarthy, D. J., Campbell, K. R., Lun, A. T. L., & Wills, Q. F. (2017) · Bioinformatics · doi:10.1093/bioinformatics/btw777 · Cited by 1,852
A step-by-step workflow for low-level analysis of single-cell RNA-seq data
Lun, A. T. L., McCarthy, D. J., & Marioni, J. C. (2016) · F1000Research · doi:10.12688/f1000research.9501.1 · Cited by 1,551
SC3: consensus clustering of single-cell RNA-seq data
Kiselev, V. Y., Kirschner, K., Schaub, M. T., Andrews, T., Yiu, A., Chandra, T., Natarajan, K. N., Reik, W., Barahona, M., Green, A. R., et al. (2017) · Nature Methods · doi:10.1038/nmeth.4236 · Cited by 1,500
Comparative Analysis of Single-Cell RNA Sequencing Methods
Ziegenhain, C., Vieth, B., Parekh, S., Reinius, B., Guillaumet-Adkins, A., Smets, M., Leonhardt, H., Heyn, H., Hellmann, I., & Enard, W. (2017) · Molecular Cell · doi:10.1016/j.molcel.2017.01.023 · Cited by 1,494
V-Measure: A Conditional Entropy-Based External Cluster Evaluation Measure
Rosenberg, A., & Hirschberg, J. (2007) · Cited by 1,322
Single-cell messenger RNA sequencing reveals rare intestinal cell types
Grün, D., Lyubimova, A., Kester, L., Wiebrands, K., Basak, O., Sasaki, N., Clevers, H., & van Oudenaarden, A. (2015) · Nature · doi:10.1038/nature14966 · Cited by 1,234
Pooling across cells to normalize single-cell RNA sequencing data with many zero counts
L. Lun, A. T., Bach, K., & Marioni, J. C. (2016) · Genome Biology · doi:10.1186/s13059-016-0947-7 · Cited by 1,108
Multiplexed droplet single-cell RNA-sequencing using natural genetic variation
Kang, H. M., Subramaniam, M., Targ, S., Nguyen, M., Maliskova, L., McCarthy, E., Wan, E., Wong, S., Byrnes, L., Lanata, C. M., et al. (2018) · Nature Biotechnology · doi:10.1038/nbt.4042 · Cited by 1,101
Li, H., Courtois, E. T., Sengupta, D., Tan, Y., Chen, K. H., Goh, J. J. L., Kong, S. L., Chua, C., Hon, L. K., Tan, W. S., et al. (2017) · Nature Genetics · doi:10.1038/ng.3818 · Cited by 1,080
A practical guide to single-cell RNA-sequencing for biomedical research and clinical applications
Haque, A., Engel, J., Teichmann, S. A., & Lönnberg, T. (2017) · Genome Medicine · doi:10.1186/s13073-017-0467-4 · Cited by 1,071
SEQC/MAQC-III Consortium (2014) · Nature Biotechnology · doi:10.1038/nbt.2957 · Cited by 983
MAQC Consortium (2010) · Nature Biotechnology · doi:10.1038/nbt.1665 · Cited by 889
Scaling single-cell genomics from phenomenology to mechanism
Tanay, A., & Regev, A. (2017) · Nature · doi:10.1038/nature21350 · Cited by 792
Visualization and analysis of single-cell RNA-seq data by kernel-based similarity learning
Wang, B., Zhu, J., Pierson, E., Ramazzotti, D., & Batzoglou, S. (2017) · Nature Methods · doi:10.1038/nmeth.4207 · Cited by 699
TSCAN: Pseudo-time reconstruction and evaluation in single-cell RNA-seq analysis
Ji, Z., & Ji, H. (2016) · Nucleic Acids Research · doi:10.1093/nar/gkw430 · Cited by 643
De Novo Prediction of Stem Cell Identity using Single-Cell Transcriptome Data
Grün, D., Muraro, M. J., Boisset, J.-C., Wiebrands, K., Lyubimova, A., Dharmadhikari, G., van den Born, M., van Es, J., Jansen, E., Clevers, H., et al. (2016) · Cell Stem Cell · doi:10.1016/j.stem.2016.05.010 · Cited by 586
CIDR: Ultrafast and accurate clustering through imputation for single-cell RNA-seq data
Lin, P., Troup, M., & Ho, J. W. K. (2017) · Genome biology · doi:10.1186/s13059-017-1188-0 · Cited by 541
Single-cell mapping of lineage and identity in direct reprogramming
Biddy, B. A., Kong, W., Kamimoto, K., Guo, C., Waye, S. E., Sun, T., & Morris, S. A. (2018) · Nature · doi:10.1038/s41586-018-0744-4 · Cited by 390
Proportion of peripheral blood and decidual CD4+ CD25bright regulatory T cells in pre-eclampsia
Sasaki, Y., Darmochwał-Kolarz, D., Suzuki, D., Sakai, M., Ito, M., Shima, T., Shiozaki, A., Roliński, J., & Saito, S. (2007) · Clinical & Experimental Immunology · doi:10.1111/j.1365-2249.2007.03397.x · Cited by 353
Cell-type specific gene expression profiles of leukocytes in human peripheral blood
Palmer, C., Diehn, M., Alizadeh, A. A., & Brown, P. O. (2006) · BMC Genomics · doi:10.1186/1471-2164-7-115 · Cited by 331
Exploring the single-cell RNA-seq analysis landscape with the scRNA-tools database
Zappia, L., Phipson, B., & Oshlack, A. (2018) · PLoS Computational Biology · doi:10.1371/journal.pcbi.1006245 · Cited by 319
Patterns of ribosomal protein expression specify normal and malignant human cells
Guimaraes, J. C., & Zavolan, M. (2016) · Genome biology · doi:10.1186/s13059-016-1104-z · Cited by 251
Visualizing the structure of RNA-seq expression data using grade of membership models
Dey, K. K., Hsiao, C. J., & Stephens, M. (2017) · PLoS Genetics · doi:10.1371/journal.pgen.1006599 · Cited by 161
Impact of similarity metrics on single-cell RNA-seq data clustering
Kim, T., Chen, I. R., Lin, Y., Wang, A. Y.-Y., Yang, J. Y. H., & Yang, P. (2019) · Briefings in Bioinformatics · doi:10.1093/bib/bby076 · Cited by 138
SIMLR: A Tool for Large‐Scale Genomic Analyses by Multi‐Kernel Learning
Wang, B., Ramazzotti, D., Sano, L. D., Zhu, J., Pierson, E., & Batzoglou, S. (2017) · PROTEOMICS · doi:10.1002/pmic.201700232 · Cited by 132
Linnorm: improved statistical analysis for single cell RNA-seq expression data
Yip, S. H., Wang, P., Kocher, J.-P. A., Sham, P. C., & Wang, J. (2017) · Nucleic Acids Research · doi:10.1093/nar/gkx828 · Cited by 121
scPipe: A flexible R/Bioconductor preprocessing pipeline for single-cell RNA-sequencing data
Tian, L., Su, S., Dong, X., Amann‐Zalcenstein, D., Biben, C., Seidi, A., Hilton, D. J., Naik, S. H., & Ritchie, M. E. (2018) · PLoS Computational Biology · doi:10.1371/journal.pcbi.1006361 · Cited by 121
Self-citationJing, Y., Gravenstein, S., Chaganty, N. R., Chen, N., Lyerly, H. K., Joyce, S., & Deng, Y. (2007) · Experimental Gerontology · doi:10.1016/j.exger.2007.01.009 · Cited by 111
Fast and accurate single-cell RNA-seq analysis by clustering of transcript-compatibility counts
Ntranos, V., Kamath, G. M., Zhang, J. M., Pachter, L. S., & Tse, D. N. C. (2016) · Genome biology · doi:10.1186/s13059-016-0970-8 · Cited by 110
Evaluation of external RNA controls for the assessment of microarray performance
Tong, W., Lucas, A. B., Shippy, R., Fan, X., Fang, H., Hong, H., Orr, M. S., Chu, T., Guo, X., Collins, P. J., et al. (2006) · Nature Biotechnology · doi:10.1038/nbt1237 · Cited by 109
A systematic performance evaluation of clustering methods for single-cell RNA-seq data
Duò, A., Robinson, M. D., & Soneson, C. (2018) · F1000Research · doi:10.12688/f1000research.15666.1 · Cited by 97
Haemopedia: An Expression Atlas of Murine Hematopoietic Cells
de Graaf, C. A., Choi, J., Baldwin, T. M., Bolden, J. E., Fairfax, K. A., Robinson, A. J., Biben, C., Morgan, C., Ramsay, K. A., Ng, A. P., et al. (2016) · Stem Cell Reports · doi:10.1016/j.stemcr.2016.07.007 · Cited by 94
The Human Cell AtlasPreprint
Regev, A., Teichmann, S. A., Lander, E. S., Amit, I., Benoist, C. O., Birney, E., Bodenmiller, B., Campbell, P. J., Carninci, P., Clatworthy, M. R., et al. (2017) · bioRxiv (Cold Spring Harbor Laboratory) · doi:10.1101/121202 · Cited by 86
RNA-seq mixology: designing realistic control experiments to compare protocols and analysis methods
Holik, A. Z., Law, C. W., Liu, R., Wang, Z., Wang, W., Ahn, J., Asselin-Labat, M.-L., Smyth, G. K., & Ritchie, M. E. (2016) · Nucleic Acids Research · doi:10.1093/nar/gkw1063 · Cited by 47
ascend : R package for analysis of single-cell RNA-seq data
Senabouth, A., Lukowski, S. W., Alquicira-Hernández, J., Andersen, S. B., Mei, X., Nguyen, Q. H., & Powell, J. E. (2019) · GigaScience · doi:10.1093/gigascience/giz087 · Cited by 46
SAVER: Gene expression recovery for UMI-based single cell RNA sequencingPreprint
Huang, M. C., Wang, J., Torre, E. A., Dueck, H., Shaffer, S., Bonasio, R., Murray, J. I., Raj, A., Li, M., & Zhang, N. R. (2017) · bioRxiv (Cold Spring Harbor Laboratory) · doi:10.1101/138677 · Cited by 38
ascend : R package for analysis of single cell RNA-seq dataPreprint
Senabouth, A., Lukowski, S. W., Alquicira-Hernández, J., et al. (2017) · bioRxiv (Cold Spring Harbor Laboratory) · doi:10.1101/207704 · Cited by 15
scPipe: a flexible R/Bioconductor preprocessing pipeline for single-cell RNA-sequencing dataPreprint
Tian, L., Su, S., Dong, X., Amann-Zalcenstein, D., Biben, C., Seidi, A., Hilton, D. J., Naik, S. H., & Ritchie, M. E. (2017) · bioRxiv (Cold Spring Harbor Laboratory) · doi:10.1101/175927 · Cited by 14
Self-citationscRNA-seq mixology: towards better benchmarking of single cell RNA-seq analysis methodsPreprint
Tian, L., Dong, X., Freytag, S., Cao, K. L., Su, S., JalalAbadi, A., Amann‐Zalcenstein, D., Weber, T. S., Seidi, A., Jabbari, J. S., et al. (2018) · bioRxiv (Cold Spring Harbor Laboratory) · doi:10.1101/433102 · Cited by 11
Self-citation
Cited by
Sorted by citations
Single-cell transcriptomics of 20 mouse organs creates a Tabula Muris
The Tabula Muris Consortium, coordination, O., coordination, L., processing, O. C. A., sequencing, L. P. A., analysis, C. D., annotation, C. T., Writing group, Supplemental text writing group, & Principal investigators (2018) · Nature · doi:10.1038/s41586-018-0590-4 · Cited by 2,842
Current best practices in single-cell RNA-seq analysis: a tutorial
Luecken, M. D., & Theis, F. J. (2019) · Molecular Systems Biology · doi:10.15252/msb.20188746 · Cited by 2,231
A single-cell atlas of the peripheral immune response in patients with severe COVID-19
Wilk, A. J., Rustagi, A., Zhao, N. Q., Roque, J., Martínez-Colón, G. J., McKechnie, J. L., Ivison, G. T., Ranganath, T., Vergara, R., Hollis, T., et al. (2020) · Nature Medicine · doi:10.1038/s41591-020-0944-y · Cited by 1,493
Eleven grand challenges in single-cell data science
Lähnemann, D., Köster, J., Szczurek, E., McCarthy, D. J., Hicks, S. C., Robinson, M. D., Vallejos, C. A., Campbell, K. R., Beerenwinkel, N., Mahfouz, A., et al. (2020) · Genome Biology · doi:10.1186/s13059-020-1926-6 · Cited by 1,327
Benchmarking atlas-level data integration in single-cell genomics
Luecken, M. D., Büttner, M., Chaichoompu, K., Danese, A., Interlandi, M., Mueller, M. F., Strobl, D. C., Zappia, L., Dugas, M., Colomé-Tatché, M., et al. (2022) · Nature Methods · doi:10.1038/s41592-021-01336-8 · Cited by 1,438
Metadata
- Authors
- Freytag, S., Tian, L., Lönnstedt, I., Ng, M., & Bahlo, M.
- Affiliations
- The University of Melbourne (AU)
- Corresponding author
- Freytag, Saskia
- Venue
- F1000Research
- Publisher
- F1000 Research Ltd
- Published
- 2018-08-15
- Volume
- 7
- Pages
- 1297
- ISSN
- 2046-1402 (ISSN-L)
- PMC
- PMC6124389
- OpenAlex
- W4251287806
- Cited by
- 220
- References
- 46
- Citations by year
- 2026: 11 · 2025: 19 · 2024: 20 · 2023: 29 · 2022: 25 · 2021: 45 · 2020: 30 · 2019: 32 · 2018: 8
- FWCI
- 10.23
- Type
- journal article
- Language
- en
- Update notices
- new_version (2018-12-19)
- Open access
- gold
- doi.org
- Locations
- F1000Research (publishedVersion, cc-by)
- bioRxiv (Cold Spring Harbor Laboratory) (acceptedVersion, cc-by-nd)
- Europe PMC (PubMed Central) (publishedVersion, cc-by)
- PubMed Central (publishedVersion, cc-by)
- PubMed (publishedVersion)
- Minerva Access (University of Melbourne) (submittedVersion, cc-by)
- DOAJ (DOAJ: Directory of Open Access Journals) (submittedVersion, cc-by-sa)
- Funders
- National Health and Medical Research Council (IRIIS, ProgramGrant1054618, SeniorResearchFellowship110297)
- Topics
- Life Sciences › Biochemistry, Genetics and Molecular Biology › Molecular Biology › Single-cell and spatial transcriptomics
- Life Sciences › Biochemistry, Genetics and Molecular Biology › Molecular Biology › Gene expression and cancer classification
- Life Sciences › Biochemistry, Genetics and Molecular Biology › Molecular Biology › Genomics and Phylogenetic Studies
- Keywords
- single-cell RNA sequencing, cell clustering, 10x Genomics, clustering algorithm comparison, Seurat, Cell Ranger, peripheral blood mononuclear cells, method robustness, R package
- MeSH terms
- Leukocytes, Mononuclear, RNA, Software, Gene Expression Profiling, Genomics, Single-Cell Analysis
About these checks
Registry, retraction, Cites and statistics results are computed, not judged, with one exception: a printed reference that no index lists is read once by a model before it counts as a citation error. Claims are extracted by a model and kept only when their quote appears verbatim in the text; each cited source is then checked, with a model’s help, for whether it says what the claim relies on. Those verdicts can be wrong — read the claim’s quote and the cited source before relying on one.
Statistics and arithmetic are recomputed, not judged.
Confidence bands are shown only for fields calibrated on our annotated test set. None is calibrated yet, so no band is shown.
What counts as a claim ›How we measure confidence ›How we check this ›
Are you an author, or do you see a problem with this page? Request a review
