Student or educator? Sign up with your school email and get 6 months of Pro free.
CoChat

The DOI matches its Crossref record; 64 of the 64 references it cites were found in a registry or an index.

Primary Visual Cortex Activity along the Apparent-Motion Trace Reflects Illusory Perception

Open access

Abstract

The illusion of apparent motion can be induced when visual stimuli are successively presented at different locations. It has been shown in previous studies that motion-sensitive regions in extrastriate cortex are relevant for the processing of apparent motion, but it is unclear whether primary visual cortex (V1) is also involved in the representation of the illusory motion path. We investigated, in human subjects, apparent-motion-related activity in patches of V1 representing locations along the path of illusory stimulus motion using functional magnetic resonance imaging. Here we show that apparent motion caused a blood-oxygenation-level-dependent response along the V1 representations of the apparent-motion path, including regions that were not directly activated by the apparent-motion-inducing stimuli. This response was unaltered when participants had to perform an attention-demanding task that diverted their attention away from the stimulus. With a bistable motion quartet, we confirmed that the activity was related to the conscious perception of movement. Our data suggest that V1 is part of the network that represents the illusory path of apparent motion. The activation in V1 can be explained either by lateral interactions within V1 or by feedback mechanisms from higher visual areas, especially the motion-sensitive human MT/V5 complex.

Overview

The claims and statistics of this paper haven’t been checked yet.

Free: it reads the open-access text and checks the first 5 claims that cite a source we can check. Create a free account to check every claim.

A few free checks a day · papers already verified open instantly · results are public

Integrity signals

Registry

Crossref · 10.1371/journal.pbio.0030265

Cites

64 of 64 references verified0 citation errors · 0 not checkable

Statistics

Figures

Figure 1 Stimuli Used in Experiments 1 to 3 (A) The apparent-motion stimulus consisted of two white squares (size, 1.8°) blinking in alternation (2.3 Hz). The squares were presented at an eccentricity of 9.5° visual angle (distance between squares, 16.5°). (B) The real-motion stimulus consisted of a white square moving in harmonious oscillation (average speed, 66.5°s−1) on the perceived path of apparent motion. The end points of the movement were adjacent to the position of the apparent-motion squares (maximum eccentricity, 8.0°). (C) The flicker control stimulus from experiment 2 was composed of two white squares (1.8°) that were blinking simultaneously at 4.6 Hz. (D–F) For the mapping conditions, high-contrast inverting checkerboards were presented in the upper (D), middle (E), and lower (F) right visual field. Sizes were adjusted according to the cortical magnification factor in V1 to produce activated regions of a similar spatial extent (3.6° for the upper and lower stimuli presented at 9.5° eccentricity, and 1.8° for the middle stimulus presented at 4.7° eccentricity). (G) For the five conditions of experiment 1 (A, B, D–F), subjects saw a white cross at the middle of the screen, which they had to fixate (G, upper part). In experiment 2, a randomly generated stream of letters and digits was presented at 2 Hz in the middle of the screen (G, lower part). Subjects had to fixate the character stream and either passively view the stream or perform a digit-detection task. (H) The motion quartet (experiment 3) was composed of four white squares presented at eccentricities similar to the apparent-motion stimulus. Two squares from diagonally opposite corners were presented at the same time. The motion quartet can be seen in vertical (left part) or horizontal (right part) motion without any changes in the physical characteristics of the stimulus. Subjects had to fixate a white cross in the middle of the screen and had to report the perceived direction of movement (vertical or horizontal).
Figure 1 Stimuli Used in Experiments 1 to 3 (A) The apparent-motion stimulus consisted of two white squares (size, 1.8°) blinking in alternation (2.3 Hz). The squares were presented at an eccentricity of 9.5° visual angle (distance between squares, 16.5°). (B) The real-motion stimulus consisted of a white square moving in harmonious oscillation (average speed, 66.5°s−1) on the perceived path of apparent motion. The end points of the movement were adjacent to the position of the apparent-motion squares (maximum eccentricity, 8.0°). (C) The flicker control stimulus from experiment 2 was composed of two white squares (1.8°) that were blinking simultaneously at 4.6 Hz. (D–F) For the mapping conditions, high-contrast inverting checkerboards were presented in the upper (D), middle (E), and lower (F) right visual field. Sizes were adjusted according to the cortical magnification factor in V1 to produce activated regions of a similar spatial extent (3.6° for the upper and lower stimuli presented at 9.5° eccentricity, and 1.8° for the middle stimulus presented at 4.7° eccentricity). (G) For the five conditions of experiment 1 (A, B, D–F), subjects saw a white cross at the middle of the screen, which they had to fixate (G, upper part). In experiment 2, a randomly generated stream of letters and digits was presented at 2 Hz in the middle of the screen (G, lower part). Subjects had to fixate the character stream and either passively view the stream or perform a digit-detection task. (H) The motion quartet (experiment 3) was composed of four white squares presented at eccentricities similar to the apparent-motion stimulus. Two squares from diagonally opposite corners were presented at the same time. The motion quartet can be seen in vertical (left part) or horizontal (right part) motion without any changes in the physical characteristics of the stimulus. Subjects had to fixate a white cross in the middle of the screen and had to report the perceived direction of movement (vertical or horizontal).CC BY · PubMed Central
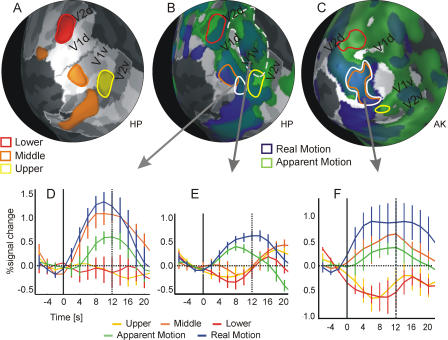
Figure 2 Activation Pattern in V1 for Experiment 1 Medio-posterior view on the inflated left occipital cortex of subject HP (A and B) and subject AK (C). All five subjects are shown in Figure S1. Gray-scale coloring of cortex indicates the extent of retinotopic visual areas (light gray: V1 and V3/VP; dark gray: V2, V4, and V3A) and the gyral pattern (concave surfaces are indicated in darker gray in the respective areas). (A) The cortical representations of the mapping stimuli are marked in color. The maps were obtained by calculating a balanced contrast between the respective mapping condition of interest and the two other mapping conditions (e.g., middle versus upper and lower). The thresholds of t-maps were individually adjusted to obtain patches of comparable size in V1: upper (yellow), t(600) > 9.3; middle (orange), t(600) > 11.9; and lower (red), t(600) > 15.1 (all p << 0.001). (B) Cortical activation maps for the apparent-motion (green) and real-motion (blue) condition compared to baseline (apparent motion in V1: t[600] > 3.6, p < 0.0004; real motion in V1: t[600] > 18.6, p << 0.001). Cortical representations of the mapping stimuli are indicated by colored outlines taken from (A). The solid white line indicates a patch of significant activation (t[600] > 3, p < 0.003) for the following conjunction of contrasts, which represents the ideal activation pattern: (middle > upper) and (middle > lower) and (apparent motion > upper) and (apparent motion > lower). The dashed white line marks a peripheral region in V1 with significant activation in response to apparent motion and real motion. (C) Same as (B) for subject AK. The white region with the optimal response pattern overlaps largely with the representation of the middle stimulus (in orange; see Figure S1 for details). (D) Event-related BOLD signal change for subject HP plotted over time from the patch outlined by the solid white line in (B) (solid black line indicates stimulus onset, dotted line stimulus offset). (E) Event-related BOLD signal change of the apparent-motion-activated (green) region from the eccentric parts of V1 outlined by the dashed white line in (B) (solid black line indicates stimulus onset, dotted line stimulus offset). This eccentric region responds to real motion and apparent motion but not to the middle stimulus. (F) Same as (D) for subject AK. Error bars correspond to standard errors of the mean.
Figure 2 Activation Pattern in V1 for Experiment 1 Medio-posterior view on the inflated left occipital cortex of subject HP (A and B) and subject AK (C). All five subjects are shown in Figure S1. Gray-scale coloring of cortex indicates the extent of retinotopic visual areas (light gray: V1 and V3/VP; dark gray: V2, V4, and V3A) and the gyral pattern (concave surfaces are indicated in darker gray in the respective areas). (A) The cortical representations of the mapping stimuli are marked in color. The maps were obtained by calculating a balanced contrast between the respective mapping condition of interest and the two other mapping conditions (e.g., middle versus upper and lower). The thresholds of t-maps were individually adjusted to obtain patches of comparable size in V1: upper (yellow), t(600) > 9.3; middle (orange), t(600) > 11.9; and lower (red), t(600) > 15.1 (all p << 0.001). (B) Cortical activation maps for the apparent-motion (green) and real-motion (blue) condition compared to baseline (apparent motion in V1: t[600] > 3.6, p < 0.0004; real motion in V1: t[600] > 18.6, p << 0.001). Cortical representations of the mapping stimuli are indicated by colored outlines taken from (A). The solid white line indicates a patch of significant activation (t[600] > 3, p < 0.003) for the following conjunction of contrasts, which represents the ideal activation pattern: (middle > upper) and (middle > lower) and (apparent motion > upper) and (apparent motion > lower). The dashed white line marks a peripheral region in V1 with significant activation in response to apparent motion and real motion. (C) Same as (B) for subject AK. The white region with the optimal response pattern overlaps largely with the representation of the middle stimulus (in orange; see Figure S1 for details). (D) Event-related BOLD signal change for subject HP plotted over time from the patch outlined by the solid white line in (B) (solid black line indicates stimulus onset, dotted line stimulus offset). (E) Event-related BOLD signal change of the apparent-motion-activated (green) region from the eccentric parts of V1 outlined by the dashed white line in (B) (solid black line indicates stimulus onset, dotted line stimulus offset). This eccentric region responds to real motion and apparent motion but not to the middle stimulus. (F) Same as (D) for subject AK. Error bars correspond to standard errors of the mean.CC BY · PubMed Central
Figure 3 Cortical Activation in V1 for Experiment 2 (A) Left occipital cortex of subject HP (all five subjects are shown in Figure S2) with superimposed contrast maps indicating the cortical representation of the stimulus positions: upper (yellow), t(1445) > 15; middle (orange), t(1445) > 12; and lower (red), t(1445) > 9.3 (all p << 0.001). For comparison, the patches from experiment 1 (see Figure 1) are marked with dotted lines. (B) Cortical activation maps for apparent motion (green) and real motion (blue). In this case, apparent motion is contrasted with the flicker control condition (apparent motion > flicker in V1: t[1445] > 3.6, p < 0.0004); real motion is compared to fixation baseline (real motion > baseline in V1: t[1445] > 18.6, p << 0.001). The white line indicates an example of a significant (t > 2.2, p < 0.05) contrast conjunction: (middle > upper) and (middle > lower) and (apparent motion > flicker). (C) BOLD activity profile of the region indicated by the white line in (B). Bars indicate average activity during the respective conditions expressed in beta weights from a GLM analysis.
Figure 3 Cortical Activation in V1 for Experiment 2 (A) Left occipital cortex of subject HP (all five subjects are shown in Figure S2) with superimposed contrast maps indicating the cortical representation of the stimulus positions: upper (yellow), t(1445) > 15; middle (orange), t(1445) > 12; and lower (red), t(1445) > 9.3 (all p << 0.001). For comparison, the patches from experiment 1 (see Figure 1) are marked with dotted lines. (B) Cortical activation maps for apparent motion (green) and real motion (blue). In this case, apparent motion is contrasted with the flicker control condition (apparent motion > flicker in V1: t[1445] > 3.6, p < 0.0004); real motion is compared to fixation baseline (real motion > baseline in V1: t[1445] > 18.6, p << 0.001). The white line indicates an example of a significant (t > 2.2, p < 0.05) contrast conjunction: (middle > upper) and (middle > lower) and (apparent motion > flicker). (C) BOLD activity profile of the region indicated by the white line in (B). Bars indicate average activity during the respective conditions expressed in beta weights from a GLM analysis.CC BY · PubMed Central
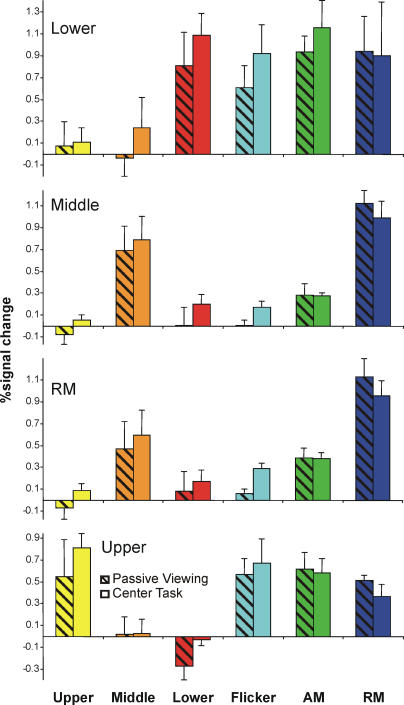
Figure 4 Response Profile for Different ROIs in V1 for Experiment 2 The four panels correspond to four ROIs that were defined in V1 by the respective conditions. To determine the ROIs for the three mapping conditions—upper, middle, and lower—the relevant condition was contrasted with the remaining two mapping conditions in a conjunction analysis (e.g., upper > lower and upper > middle). For the real-motion ROI, the real-motion condition was contrasted with the upper and lower mapping conditions (conjunction analysis). The bars designate percentage signal change of the peak response relative to baseline for the different conditions (see Materials and Methods). The hatched bars are activations from runs with passive viewing only, and the solid bars are from runs with center task. For both the real-motion and middle ROI, the response to the apparent-motion stimulus is significantly larger than the response to the flicker squares. This is not the case for the upper and lower ROIs. Error bars correspond to standard errors of the mean.
Figure 4 Response Profile for Different ROIs in V1 for Experiment 2 The four panels correspond to four ROIs that were defined in V1 by the respective conditions. To determine the ROIs for the three mapping conditions—upper, middle, and lower—the relevant condition was contrasted with the remaining two mapping conditions in a conjunction analysis (e.g., upper > lower and upper > middle). For the real-motion ROI, the real-motion condition was contrasted with the upper and lower mapping conditions (conjunction analysis). The bars designate percentage signal change of the peak response relative to baseline for the different conditions (see Materials and Methods). The hatched bars are activations from runs with passive viewing only, and the solid bars are from runs with center task. For both the real-motion and middle ROI, the response to the apparent-motion stimulus is significantly larger than the response to the flicker squares. This is not the case for the upper and lower ROIs. Error bars correspond to standard errors of the mean.CC BY · PubMed Central
Figure 5 Attentional Modulation of Activity in hMT/V5+ in Experiment 2 Responses to the different conditions in experiment 2 for the region hMT/V5+ are shown. The bars designate percentage signal change of the peak response relative to baseline (see Materials and Methods). The hatched bars are activations from runs with passive viewing only, and the solid bars are from runs with center task. The static conditions—upper, middle, lower, and flicker—induced only low activation in hMT/V5+. In contrast, the response to apparent motion and real motion was higher, corresponding with the motion sensitivity of hMT/V5+. The attentional modulation of the responses was very strong. Under all conditions, the activity was smaller during runs with center task than during runs with passive viewing. Error bars correspond to standard errors of the mean.
Figure 5 Attentional Modulation of Activity in hMT/V5+ in Experiment 2 Responses to the different conditions in experiment 2 for the region hMT/V5+ are shown. The bars designate percentage signal change of the peak response relative to baseline (see Materials and Methods). The hatched bars are activations from runs with passive viewing only, and the solid bars are from runs with center task. The static conditions—upper, middle, lower, and flicker—induced only low activation in hMT/V5+. In contrast, the response to apparent motion and real motion was higher, corresponding with the motion sensitivity of hMT/V5+. The attentional modulation of the responses was very strong. Under all conditions, the activity was smaller during runs with center task than during runs with passive viewing. Error bars correspond to standard errors of the mean.CC BY · PubMed Central
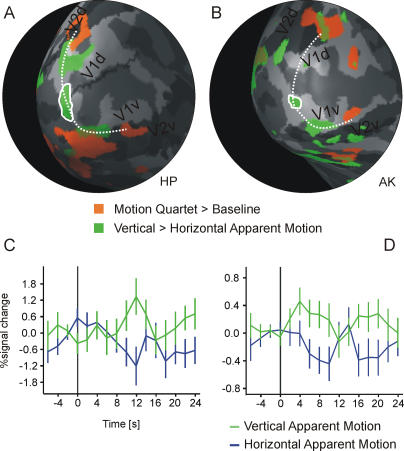
Figure 6 Results from the Bistable Motion Quartet (Experiment 3) (A and B) Medio-posterior view on the inflated left occipital cortex of subject HP (A) and AK (B) (all six subjects are shown in Figure S3). Gray shading indicates the extension of V1 (light gray for V1) and the cortex curvature (dark gray, concave; light gray, convex). Activation maps show the cortical representation of the stimulated locations in red (motion quartet > baseline). Contrast maps in green indicate regions that are more active for vertical apparent motion than for horizontal apparent motion (ROI-based GLM at indicated locations; HP: t[301] > 2.5, p < 0.02; AK: t[708] > 2, p < 0.05). The dotted line is a spline-interpolated curve connecting the stimulated locations and the region that is more active during the perception of vertical apparent motion. (This line does not necessarily indicate the path of apparent motion from experiments 1 and 2 since stimulus parameters had to be adjusted.) (C and D) The solid white lines mark regions from which event-related averages were calculated. Event-related averages are shown for subject HP (C) and for subject AK (D). The time courses are aligned to the time point at which the subject indicates a switch in perception (t = 0, black line) and are shown for the time period from 4 s before to 24 s after the perceptual switch. The first perceptual period following each stimulation onset is omitted from the analysis (see Materials and Methods). Error bars correspond to standard errors of the mean. For HP, the vertical percept lasted on average for 11.9 s (standard deviation, 10.3 s), the horizontal for 13.4 s (standard deviation, 9.2 s). For AK, the vertical lasted for 14.6 s (standard deviation, 7.1 s), and the horizontal for 16.6 s (standard deviation, 6.7 s).
Figure 6 Results from the Bistable Motion Quartet (Experiment 3) (A and B) Medio-posterior view on the inflated left occipital cortex of subject HP (A) and AK (B) (all six subjects are shown in Figure S3). Gray shading indicates the extension of V1 (light gray for V1) and the cortex curvature (dark gray, concave; light gray, convex). Activation maps show the cortical representation of the stimulated locations in red (motion quartet > baseline). Contrast maps in green indicate regions that are more active for vertical apparent motion than for horizontal apparent motion (ROI-based GLM at indicated locations; HP: t[301] > 2.5, p < 0.02; AK: t[708] > 2, p < 0.05). The dotted line is a spline-interpolated curve connecting the stimulated locations and the region that is more active during the perception of vertical apparent motion. (This line does not necessarily indicate the path of apparent motion from experiments 1 and 2 since stimulus parameters had to be adjusted.) (C and D) The solid white lines mark regions from which event-related averages were calculated. Event-related averages are shown for subject HP (C) and for subject AK (D). The time courses are aligned to the time point at which the subject indicates a switch in perception (t = 0, black line) and are shown for the time period from 4 s before to 24 s after the perceptual switch. The first perceptual period following each stimulation onset is omitted from the analysis (see Materials and Methods). Error bars correspond to standard errors of the mean. For HP, the vertical percept lasted on average for 11.9 s (standard deviation, 10.3 s), the horizontal for 13.4 s (standard deviation, 9.2 s). For AK, the vertical lasted for 14.6 s (standard deviation, 7.1 s), and the horizontal for 16.6 s (standard deviation, 6.7 s).CC BY · PubMed Central

Verification

Claims the paper makes

The claims and statistics of this paper haven’t been checked yet.

Free: it reads the open-access text and checks the first 5 claims that cite a source we can check. Create a free account to check every claim.

A few free checks a day · papers already verified open instantly · results are public

Claims other papers make about this one

Each is checked against this paper’s own text: does it say what the citing paper says it does?

Self-check

Percentages, sums and reported differences re-computed from the paper’s own numbers.

The self-check needs the paper’s full text.

Citations

Cites

Show all 64 references

Research works printed but not linked: 4

  1. Wertheimer, 1912, Z Psychol, 61, 161
  2. Albright, 1993, Rev Oculomot Res, 5, 177
  3. Neuhaus, 1930, Arch Gesamte Psychol, 75, 315
  4. Lee, 2002, J Vis, 2, 618

Cited by

See all 225

Metadata

Authors
Muckli, L., Kohler, A., Kriegeskorte, N., & Singer, W.
Affiliations
Max Planck Institute for Brain Research (DE)
Corresponding author
Muckli, Lars
Venue
PLoS Biology
Published
2005-07-19
Volume
3
Issue
8
Pages
e265
ISSN
  • 1544-9173 (ISSN-L)
  • 1545-7885
OpenAlex
W2033471768
Cited by
225
References
64
Citations by year
2026: 4 · 2025: 5 · 2024: 4 · 2023: 9 · 2022: 6 · 2021: 8 · 2020: 13 · 2019: 10 · 2018: 11 · 2017: 13 · 2016: 12 · 2015: 17 · 2014: 19 · 2013: 15 · 2012: 12
FWCI
4.45
Type
journal article
Language
en
Open access
Locations
  • PLoS Biology (publishedVersion, cc-by)
  • Europe PMC (PubMed Central) (publishedVersion, cc-by)
  • PubMed Central (publishedVersion, cc-by)
  • PubMed (publishedVersion)
  • ENLIGHTEN (Jurnal Bimbingan dan Konseling Islam) (acceptedVersion)
  • DOAJ (DOAJ: Directory of Open Access Journals) (submittedVersion)
  • DOAJ (DOAJ: Directory of Open Access Journals) (submittedVersion, cc-by-sa)
  • Max Planck Institute for Plasma Physics (submittedVersion)
  • Figshare (submittedVersion, cc-by)
  • Publication Server of Goethe University Frankfurt am Main (Goethe University Frankfurt) (submittedVersion, cc-by)
Funders
  • Deutsche Forschungsgemeinschaft
  • Bundesministerium für Bildung und Forschung
  • Max-Planck-Gesellschaft
Topics
  • Life Sciences › Neuroscience › Cognitive Neuroscience › Visual perception and processing mechanisms
  • Social Sciences › Psychology › Experimental and Cognitive Psychology › Multisensory perception and integration
  • Life Sciences › Neuroscience › Cognitive Neuroscience › Motor Control and Adaptation
Keywords
apparent motion, primary visual cortex, illusory motion, motion perception, visual attention
MeSH terms
Adult, Brain Mapping, Female, Humans, Magnetic Resonance Imaging, Male, Motion Perception, Optical Illusions, Photic Stimulation, Visual Cortex, Vision Screening

About these checks

Registry, retraction, Cites and statistics results are computed, not judged, with one exception: a printed reference that no index lists is read once by a model before it counts as a citation error. Claims are extracted by a model and kept only when their quote appears verbatim in the text; each cited source is then checked, with a model’s help, for whether it says what the claim relies on. Those verdicts can be wrong — read the claim’s quote and the cited source before relying on one.

Statistics and arithmetic are recomputed, not judged.

Confidence bands are shown only for fields calibrated on our annotated test set. None is calibrated yet, so no band is shown.

What counts as a claim ›How we measure confidence ›How we check this ›

Are you an author, or do you see a problem with this page? Request a review

How to cite

Cite CoChat for the checks on this page, and the paper for its own findings.

This page
CoChat. (2026). Citation check: Primary Visual Cortex Activity along the Apparent-Motion Trace Reflects Illusory Perception. https://app.cochat.ai/papers/10.1371/journal.pbio.0030265
The paper
Muckli, L., Kohler, A., Kriegeskorte, N., & Singer, W. (2005). Primary Visual Cortex Activity along the Apparent-Motion Trace Reflects Illusory Perception. PLoS Biology. https://doi.org/10.1371/journal.pbio.0030265

Data sources

Bibliographic data: Semantic Scholar, OpenAlex, Crossref.

Contains information from the Semantic Scholar Academic Graph Datasets, made available under the ODC Attribution License (ODC-BY 1.0).

Semantic Scholar’s data is described in: Kinney, R., et al. (2023). The Semantic Scholar Open Data Platform. arXiv:2301.10140.