

Reasoning, Learning, and Creativity: Frontal Lobe Function and Human Decision-Making
Open accessThe DOI matches its Crossref record; 71 of the 71 references it cites were found in a registry or an index.
Abstract
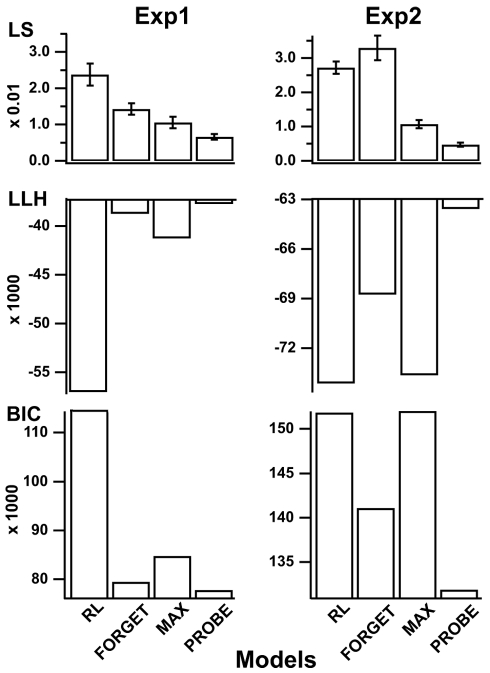
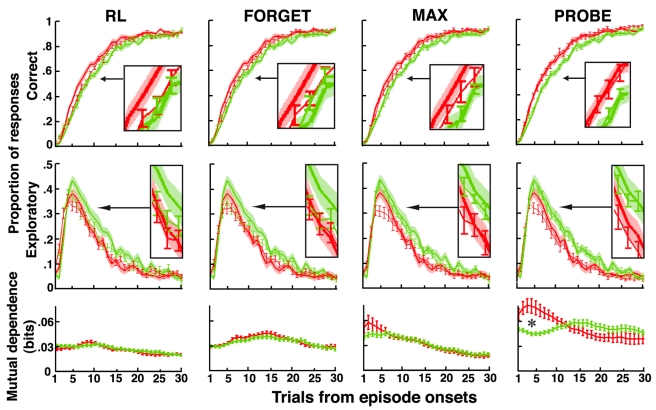
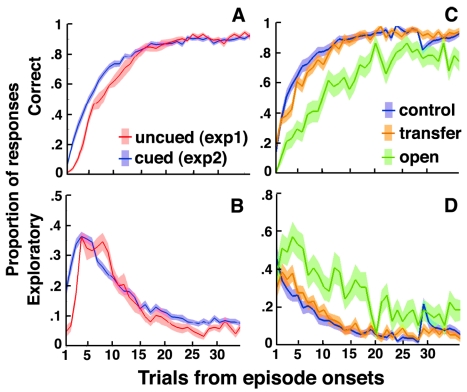
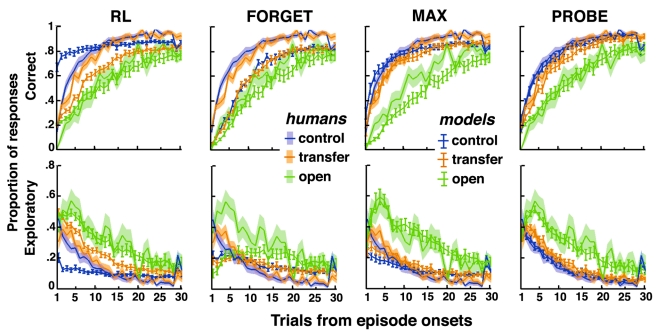
The frontal lobes subserve decision-making and executive control--that is, the selection and coordination of goal-directed behaviors. Current models of frontal executive function, however, do not explain human decision-making in everyday environments featuring uncertain, changing, and especially open-ended situations. Here, we propose a computational model of human executive function that clarifies this issue. Using behavioral experiments, we show that unlike others, the proposed model predicts human decisions and their variations across individuals in naturalistic situations. The model reveals that for driving action, the human frontal function monitors up to three/four concurrent behavioral strategies and infers online their ability to predict action outcomes: whenever one appears more reliable than unreliable, this strategy is chosen to guide the selection and learning of actions that maximize rewards. Otherwise, a new behavioral strategy is tentatively formed, partly from those stored in long-term memory, then probed, and if competitive confirmed to subsequently drive action. Thus, the human executive function has a monitoring capacity limited to three or four behavioral strategies. This limitation is compensated by the binary structure of executive control that in ambiguous and unknown situations promotes the exploration and creation of new behavioral strategies. The results support a model of human frontal function that integrates reasoning, learning, and creative abilities in the service of decision-making and adaptive behavior.
Overview
The claims and statistics of this paper haven’t been checked yet.
Free: it reads the open-access text and checks the first 5 claims that cite a source we can check. Create a free account to check every claim.
Integrity signals
Registry
Cites
Statistics
Figures



Verification
Claims the paper makes
The claims and statistics of this paper haven’t been checked yet.
Free: it reads the open-access text and checks the first 5 claims that cite a source we can check. Create a free account to check every claim.
Claims other papers make about this one
Each is checked against this paper’s own text: does it say what the citing paper says it does?
The source backs part of the claim, not all of it — or backs it for a different population, condition or comparison.
In the citing paper
“Other functions, higher-order EF, such as planning, reasoning, and problem solving, develop from these core processes [16].”
From Comparing Executive Functions in Children and Adolescents with Autism and ADHD—A Systematic Review and Meta-Analysis (2024) · cites this paper as [16]
Experimental — accuracy not yet measuredIn the citing paper
“The frontal lobe performs executive functions, such as planning and organizing, and undergoes massive changes from puberty until mid-twenties [74].”
In the citing paper
“accurately inferring one’s confidence in a task is an important indicator of whether a previous decision should be revised 17, 57, whether a subsequent step in a chain of decisions should be initiated (58), or more generally when it is advantageous to deliberate (59) or engage cognitive control (18).”
From Psychiatric Symptom Dimensions Are Associated With Dissociable Shifts in Metacognition but Not Task Performance (2018) · cites this paper as [17]
Self-check
Percentages, sums and reported differences re-computed from the paper’s own numbers.
The self-check needs the paper’s full text.
Citations
Cites
Hitch, G. (1984) · Science · doi:10.1017/s0033291700003548 · Cited by 16,233
Information theory and statistical mechanics
Jaynes, E. T. (1957) · Physical Review · doi:10.1103/physrev.106.620 · Cited by 12,931 · cited 2×
“Prior reliability lprior of the probe actor is chosen as minimizing prior information over task set reliability because no information is available to estimate it [32].”
BackgroundAn Integrative Theory of Prefrontal Cortex Function
Miller, E. K., & Cohen, J. D. (2001) · Annual Review of Neuroscience · doi:10.1146/annurev.neuro.24.1.167 · Cited by 12,803 · cited 1×
“Neuroimaging studies suggest that these internal mappings are implemented in distinct frontal regions: (1) selective mappings in lateral premotor regions, because these regions are involved in learning and processing stimulus-response associations [10,46]; (2) predictive mappings in ventromedial prefrontal regions, be…”
BackgroundRescorla, R. A. (1972) · Medical Entomology and Zoology · Cited by 9,462
Kahneman, D., & Tversky, A. (1984) · American Psychologist · doi:10.1037/0003-066x.39.4.341 · Cited by 6,544 · cited 1×
“associating stimuli, actions, and expected outcomes [1–4]).”
Models of Bounded Rationality: Empirically Grounded Economic Reason
Simon, H. A. (1997) · The MIT Press eBooks · doi:10.7551/mitpress/4711.001.0001 · Cited by 4,205 · cited 1×
“Indeed, actor selection is based on a ‘‘satisficing’’ criterion based on task set reliability [1]: either a task set appears to be reliable, in which case it becomes the actor, because no other task sets meet this criterion, or no task set appears reliable, in which case a new task set is created and serves as an acto…”
BackgroundCosts of a predictible switch between simple cognitive tasks.
Rogers, R. D., & Monsell, S. (1995) · Journal of Experimental Psychology: General · doi:10.1037/0096-3445.124.2.207 · Cited by 3,170 · cited 1×
“. Thus, we assumed that in agreement with previous studies (e.g.,”
Result(2000) · doi:10.1017/cbo9780511803475 · Cited by 2,987
Barto, A. G. (1998) · IFAC Proceedings Volumes · doi:10.1016/s1474-6670(17)38315-5 · Cited by 2,976 · cited 6×
“After observing action outcome ot, the actor selective mapping is updated based on outcome values r[o] according to standard reinforcement learning mechanisms [11] (e.”
BackgroundMethodInfluentialBoden, M. A. (2004) · doi:10.4324/9780203508527 · Cited by 2,775
Cited by
Items 201–300 of 487
Learning to select actions shapes recurrent dynamics in the corticostriatal system
Márton, C. D., Schultz, S. R., & Averbeck, B. B. (2020) · Neural Networks · doi:10.1016/j.neunet.2020.09.008 · Cited by 20
Searching far away from the lamp-post: An agent-based model
Vuculescu, O. (2016) · Strategic Organization · doi:10.1177/1476127016669869 · Cited by 19
“The memory an agent has is a fixed ratio of the size of the current problem representation reflecting human capacity limitations within attention and working memory10 (Collins and Koechlin, 2012).”
Jacquet, P. O., Roy, A. C., Chambon, V., Borghi, A. M., Salemme, R., Farnè, A., & Reilly, K. T. (2016) · Scientific Reports · doi:10.1038/srep26995 · Cited by 18
Motor Demands Constrain Cognitive Rule Structures
Collins, A. G. E., & Frank, M. J. (2016) · PLoS Computational Biology · doi:10.1371/journal.pcbi.1004785 · Cited by 19
“When such a structure matches the statistical regularities of the world, subjects can discover it and leverage that structure to simplify the problem, speeding learning and facilitating transfer [15,19,32].”
BackgroundSelf-citationHelpful-stressful cycle? Psychological links between type of mobile phone user and stress
Lee, Y.-K., Chang, C.-T., Cheng, Z.-H., & Lin, Y. (2016) · Behaviour & Information Technology · doi:10.1080/0144929x.2015.1055800 · Cited by 17
“The multitasking behaviour induces stress as people lose the ability to rest their minds and relax (Collins and Koechlin 2012; Richtel 2010).”
BackgroundHybrid neural–cognitive models reveal how memory shapes human reward learning
Eckstein, M. K., Summerfield, C., Daw, N. D., & Miller, K. J. (2026) · Nature Human Behaviour · doi:10.1038/s41562-025-02324-0 · Cited by 29
“These models have achieved an impressive record of success, providing computational explanations for basic as well as complex learning phenomena 3–9 and for neural correlates of reward-guided learning in a variety of tasks and species 10–12 .”
Zaheer, A., & Akhtar, A. (2025) · Child Neuropsychology · doi:10.1080/09297049.2025.2468411 · Cited by 19
Bayesian reinforcement learning: A basic overview
Kang, P., Tobler, P. N., & Dayan, P. (2024) · Neurobiology of Learning and Memory · doi:10.1016/j.nlm.2024.107924 · Cited by 33
“…stimuli and outcomes but also the context (or the structure) in which learning takes place affects the outcomes (Braun et al., 2010a; Braun et al., 2010b; Collins & Frank, 2013; Collins & Koechlin, 2012; Courville et al., 2004, 2006; Gershman & Niv, 2010; Lloyd & Leslie, 2013; Redish et al., 2007).”
BackgroundDevelopment and validation of the Executive Functioning Scale
Uljarević, M., Cai, R. Y., Hardan, A. Y., & Frazier, T. W. (2023) · Frontiers in Psychiatry · doi:10.3389/fpsyt.2022.1078211 · Cited by 20
“, (2, 36, 79, 80)] and others arguing for a broader conceptualization that also includes affective (“hot”) constructs (37, 39, 41).”
BackgroundFastame, M. C. (2022) · Cognitive Processing · doi:10.1007/s10339-022-01089-y · Cited by 16
“2008) of the Coloured Progressive Matrices by Raven (1958) is a measure of fluid intelligence, it was used to evaluate a kind of executive function, namely the nonverbal abstract reasoning implicated in visuo-spatial problem-solving that involves novel information when familiar solutions are not available (Collins and…”
MethodThe relationship of resting-state EEG oscillations to executive functions in middle childhood
Cai, D., Deng, M., Jiancheng, Y., Nan, W., & Leung, A. W. S. (2021) · International Journal of Psychophysiology · doi:10.1016/j.ijpsycho.2021.02.021 · Cited by 21
I Can Succeed for Preschools: A Randomized Control Trial of a New Social-emotional Learning Program
Gold, I. K., Kopelman-Rubin, D., Mufson, L. H., & Klomek, A. B. (2020) · Early Education and Development · doi:10.1080/10409289.2020.1755777 · Cited by 31
Long, X., Liu, F., Huang, N., Liu, N., Zhang, J., Chen, J., Qi, A., Guan, X., & Lu, Z. (2018) · BMC Psychiatry · doi:10.1186/s12888-018-1954-x · Cited by 14
“The frontal lobe was an important brain region anatomically and functionally, which sub serve human decisionmaking and executive control [34].”
BackgroundThalamocortical architectures for flexible cognition and efficient learning
Scott, D. N., Mukherjee, A., Nassar, M. R., & Halassa, M. M. (2024) · Trends in Cognitive Sciences · doi:10.1016/j.tics.2024.05.006 · Cited by 62
Xu, C., Huizinga, M., Ekubagewargies, D. T., Soetaert, J., Noortgate, W. V. D., & Baeyens, D. (2024) · Educational Psychologist · doi:10.1080/00461520.2024.2315527 · Cited by 23
“The dimensions of EF, including cool EF (working memory, inhibitory control, cognitive flexibility, core EFs, higher order EFs), and hot EF, were defined based on the works of Garon et al. (2008), Miyake et al. (2000), and Zelazo and Carlson (2012).”
InfluentialPettine, W. W., Raman, D. V., Redish, A. D., & Murray, J. D. (2023) · Nature Human Behaviour · doi:10.1038/s41562-023-01543-7 · Cited by 25
Milaré, C. A. R., Kozasa, E. H., Lacerda, S. S., Barrichello, C., Tobo, P. R., & Horta, A. L. D. M. (2021) · Frontiers in Psychology · doi:10.3389/fpsyg.2021.576311 · Cited by 26
Ssewanyana, D., Newton, C. R. J. C., van Baar, A. L., Hassan, A. S., Stein, A. L., Taylor, H. G., van de Vijver, F. J. R., Scerif, G., & Abubakar, A. A. (2020) · International Journal of Behavioral Medicine · doi:10.1007/s12529-020-09877-6 · Cited by 23
Hierarchical Control of Behaviour in Human Prefrontal Cortex
Duverne, S., & Koechlin, É. (2017) · Wiley eBooks · doi:10.1002/9781118920497.ch12 · Cited by 18
Self-citationA cortical network that marks the moment when conscious representations are updated
Stöttinger, E., Filipowicz, A., Valadao, D. F., Culham, J. C., Goodale, M. A., Anderson, B., & Danckert, J. A. (2015) · Neuropsychologia · doi:10.1016/j.neuropsychologia.2015.10.037 · Cited by 24
Neural model for learning-to-learn of novel task sets in the motor domain
Pitti, A., Braud, R., Mahé, S., Quoy, M., & Gaussier, P. (2013) · Frontiers in Psychology · doi:10.3389/fpsyg.2013.00771 · Cited by 12
CHANGE DETECTION, MULTIPLE CONTROLLERS, AND DYNAMIC ENVIRONMENTS: INSIGHTS FROM THE BRAIN
Pearson, J. M., & Platt, M. L. (2012) · Journal of the Experimental Analysis of Behavior · doi:10.1002/jeab.5 · Cited by 15
Executive functioning profiles and mathematical and reading achievement in Grades 2, 6, and 10
Carriedo, N., Rodríguez‐Villagra, O. A., Pérez, L., & Iglesias-Sarmiento, V. (2024) · Journal of School Psychology · doi:10.1016/j.jsp.2024.101353 · Cited by 23
Different Music Training Modulates Theta Brain Oscillations Associated with Executive Function
Wang, J., Xu, R., Guo, X., Guo, S., Zhou, J., Lü, J., & Yao, D. (2022) · Brain Sciences · doi:10.3390/brainsci12101304 · Cited by 18
“Executive function is a top-down mental process of complex cognitive functions such as working memory, inhibitory control, attention, and cognitive flexibility [9,10].”
BackgroundBilingualism, Culture, and Executive Functions: Is There a Relationship?
Xie, W., Altarriba, J., & Ng, B. C. (2022) · Languages · doi:10.3390/languages7040247 · Cited by 22
“EF are believed to be the foundation upon which essential skills such as planning (Collins and Koechlin 2012) and critical reasoning (Lunt et al. 2012) are built.”
BackgroundEgesa, I. J., Newton, C. R. J. C., & Kariuki, S. M. (2021) · Epilepsia Open · doi:10.1002/epi4.12562 · Cited by 19
Association among Executive Function, Physical Activity, and Weight Status in Youth
Borkertienė, V., Stasiulis, A., Zacharienë, B., Kyguolienė, L., & Bacevičienė, R. (2019) · Medicina · doi:10.3390/medicina55100677 · Cited by 13
“From these, higher-order EFs are built, such as reasoning, problem-solving, and planning [4,5].”
BackgroundEscala de Funcionamiento Ejecutivo para Escolares: Análisis de las Propiedades Psicométricas
Korzeniowski, C., & Ison, M. S. (2019) · Psicologí a Educativa · doi:10.5093/psed2019a4 · Cited by 20
Li, H., Tamura, R., Hayashi, D., Asai, H., Koga, J., Ando, S., Yokota, S., Kaneko, J., Sakurai, K., Sumiyoshi, A., et al. (2024) · Science Advances · doi:10.1126/sciadv.adk4741 · Cited by 16
The neuropsychological profile of work addiction
Berta, K., Pesthy, Z. V., Vékony, T., Farkas, B. C., Németh, D., & Kun, B. (2023) · Scientific Reports · doi:10.1038/s41598-023-47515-9 · Cited by 16
“Since inhibitory control and working memory play important roles in higher order executive functions 12,89 , the alteration of these functions is potentially associated with modified decision-making, working strategies, and even social functioning.”
BackgroundFast rule switching and slow rule updating in a perceptual categorization task
Bouchacourt, F., Tafazoli, S., Mattar, M. G., Buschman, T. J., & Daw, N. D. (2022) · eLife · doi:10.7554/elife.82531 · Cited by 14
Emrani, S., Lamar, M., Price, C. C., Baliga, S., Wasserman, V., Matusz, E. F., Saunders, J., Gietka, V., Strate, J., Swenson, R., et al. (2021) · Journal of Alzheimer s Disease · doi:10.3233/jad-201125 · Cited by 13
Meijer, A., Pouwels, P. J. W., Smith, J., Visscher, C., Bosker, R., Hartman, E., Oosterlaan, J., & Königs, M. (2021) · Journal of Neuroscience Research · doi:10.1002/jnr.24851 · Cited by 16
“Executive functions, such as working memory and inhibition, facilitate goal directed behavior (Collins & Koechlin, 2012; Salthouse, 2005) and are important predictors of behavioral functioning, academic achievement, and even social well- being, health, wealth, and quality of life (Diamond & Lee,…”
BackgroundComparison of gifted and non-gifted students’ executive functions and high capabilities
Rocha, A., Almeida, L. S., & Perales, R. G. (2020) · Journal for the Education of Gifted Young Scientists · doi:10.17478/jegys.808796 · Cited by 28
“For several authors, the development of these three functions leads to more complex or higher-order cognitive skills, such as planning, reasoning, and problem solving (Collins & Koechlin, 2012; Diamond, 2013; Lunt et al. 2011).”
The Neuroscience of Mathematical Cognition and Learning
Looi, C. Y., Thompson, J., Krause, B., & Kadosh, R. C. (2016) · OECD education working papers · doi:10.1787/5jlwmn3ntbr7-en · Cited by 21
Wei, Z., Alcauter, S., Jin, K., Peng, Z., & Gao, W. (2013) · Brain Connectivity · doi:10.1089/brain.2012.0125 · Cited by 11
“Moreover, the frontal lobe hubs during the awake state observed in this study are mainly responsible for executive con-trol and self-referential processes (Collins and Koechlin, 2012; Seniow, 2012; Stuss, 2011), which are likely inhibited during sedation (Alkire et al., 2008).”
Cho, R., Zaman, M., Cho, K. T., & Hwang, J. (2024) · International Journal of Information Technology · doi:10.1007/s41870-024-01856-4 · Cited by 11
“This finding aligns with previous research by Collins et al. [29], connecting to our findings that the left frontal lobe and right frontal lobe represent mathematical processing, planning, cognitive flexibility, and working memory.”
The Impact of Household Chaos and Dietary Intake on Executive Function in Young Children
Iwinski, S. J., Donovan, S. M., Fiese, B. H., & Bost, K. K. (2021) · Nutrients · doi:10.3390/nu13124442 · Cited by 14
Chaiyanan, C., Iramina, K., & Kaewkamnerdpong, B. (2021) · Entropy · doi:10.3390/e23050617 · Cited by 11
“These strings of zero and one will be Food Source for the ABC [34].”
BackgroundEEG/PPG effective connectivity fusion for analyzing deception in interview
Daneshikohan, M., Nasrabadi, A. M., Shamsollahi, M., & Sharifi, A. (2020) · Signal, Image and Video Processing · doi:10.1007/s11760-019-01622-1 · Cited by 11
Khan, N. A., Cannavale, C. N., Iwinski, S. J., Liu, R., McLoughlin, G. M., Steinberg, L. G., & Walk, A. M. (2020) · Frontiers in Pediatrics · doi:10.3389/fped.2019.00548 · Cited by 15
“, working memory, cognitive flexibility, and inhibitory control) build the foundation for reasoning, problem solving, and planning (13, 14).”
BackgroundHow the inference of hierarchical rules unfolds over time
Eckstein, M. K., Starr, A., & Bunge, S. A. (2019) · Cognition · doi:10.1016/j.cognition.2019.01.009 · Cited by 12
An experience based linear general type-2 fuzzy logic approach for Computing With Words
Bilgin, A., Hagras, H., Malibari, A., Alhaddad, M., & Al-Ghazzawi, D. M. (2013) · IEEE International Conference on Fuzzy Systems · doi:10.1109/fuzz-ieee.2013.6622373 · Cited by 11
“Among the hallmarks of human intelligence are reasoning, learning, and creativity [4].”
BackgroundLanguage experiences and cognitive control: A dynamic perspective
Li, P., & Dong, Y. (2020) · The Psychology of learning and motivation/The psychology of learning and motivation · doi:10.1016/bs.plm.2020.02.002 · Cited by 20
Bridging the Gap between Emotion and Cognition
Laborde, S. (2016) · Elsevier eBooks · doi:10.1016/b978-0-12-803377-7.00017-x · Cited by 22
Hebbian learning revisited and its inference underlying cognitive function
Lim, S. (2021) · Current Opinion in Behavioral Sciences · doi:10.1016/j.cobeha.2021.02.006 · Cited by 17
Nucleus accumbens dopamine release reflects Bayesian inference during instrumental learning
Qü, A. J., Tai, L.-H., Hall, C. D., Tu, E. M., Eckstein, M. K., Mishchanchuk, K., Lin, W. C., Chase, J. B., MacAskill, A. F., Collins, A. G. E., et al. (2025) · PLoS Computational Biology · doi:10.1371/journal.pcbi.1013226 · Cited by 13
“In addition to comparing “pure” Bayesian and SRL models, it is also valuable to include a hybrid model, as past studies suggest that Bayesian and RL processes may be combined in the brain [8, 18, 19].”
Self-citationExecutive functions in patients with bilateral and unilateral peripheral vestibular dysfunction
Schöne, C. G., Vibert, D., & Mast, F. W. (2024) · Journal of Neurology · doi:10.1007/s00415-024-12267-7 · Cited by 15
“Complex executive functions are for example problem solving, planning, or monitoring [3, 21, 29, 69].”
Chaudhari, A., Wang, X., Wu, A., & Liu, H. (2023) · Bioengineering · doi:10.3390/bioengineering10091043 · Cited by 9
Sex difference in driving speed management: The mediation effect of impulse control
Pan, C., Ma, J.-F., Li, Y., Lu, Y., Shan, L., & Chang, R. (2023) · PLoS ONE · doi:10.1371/journal.pone.0288653 · Cited by 10
A Novel Tool to Assess Basic Activities of Daily Living in Spanish Preschoolers
My works are correct, B. M. I. A. A. I. S. R. L. M. T. I. D. A.-M., Delgado, M. G., Gómez, A. G., Carlos‐Vivas, J., & Ayuso, D. M. R. (2021) · Children · doi:10.3390/children8060496 · Cited by 12
“From core EFs, higher-order EFs are built, including planning (choosing steps to reach a goal), reasoning, and problem-solving [22,24].”
BackgroundBrain Melody Informatics: Analysing Effects of Music on Brainwave Patterns
Rahman, J. S., Gedeon, T., Caldwell, S., & Jones, R. (2020) · International Joint Conference on Neural Networks (IJCNN) · doi:10.1109/ijcnn48605.2020.9207392 · Cited by 25
“Frontal lobes are also involved in decision making [33].”
BackgroundQuintana, R. (2020) · Sociological Methods & Research · doi:10.1177/0049124120926208 · Cited by 16
“These top-down processes are considered to be necessary for higher order cognitive abilities such as reasoning, problem-solving, and planning (Collins and Koechlin 2012).”
BackgroundTrimarco, B., Manti, F., Nardecchia, F., Melogno, S., Testa, M., Meledandri, G., Carducci, C., Penge, R., & Leuzzi, V. (2020) · Molecular Genetics and Metabolism Reports · doi:10.1016/j.ymgmr.2020.100577 · Cited by 11
Concussion and executive functions in combat sports: A systematic review
Barcelos, G., de Oliveira, J. G. M., Melo, R., Nórte, C. E., & Filgueiras, A. (2024) · Journal of Sports Sciences · doi:10.1080/02640414.2024.2433902 · Cited by 12
“Although studies relate executive functions to the prefrontal cortex (Collins et al., 2012; Nowrangi et al., 2014), evidence indicates that this region does not act alone in the performance of executive functions, but rather in conjunction with more subcortical and posterior, such as the thalamus…”
Maith, O., Baladron, J., Einhäuser, W., & Hamker, F. H. (2023) · iScience · doi:10.1016/j.isci.2023.106599 · Cited by 9
Alternative Object Use in Adults and Children: Embodied Cognitive Bases of Creativity
Gubenko, A., & Houssemand, C. (2022) · Frontiers in Psychology · doi:10.3389/fpsyg.2022.893420 · Cited by 17
Zhai, Y., Lv, Z., Zhao, J., Wang, W., & Leung, H. (2022) · Expert Systems with Applications · doi:10.1016/j.eswa.2022.117585 · Cited by 11
Context is key for learning motor skills
Collins, A. G. E., & McDougle, S. D. (2021) · Nature · doi:10.1038/d41586-021-03028-x · Cited by 9
Self-citationMultitask learning over shared subspaces
Menghi, N., Kacar, K., & Penny, W. D. (2021) · PLoS Computational Biology · doi:10.1371/journal.pcbi.1009092 · Cited by 14
“This serial model fitting process is biologically implausible but could potentially be implemented using parallel architecture and may fit in with evidence that up to three or four decision making strategies can be simultaneously updated and monitored [29].”
BackgroundMethodInfluentialRobot Programming to Empower Higher Cognitive Functions in Early Childhood
Lieto, M. C. D., Pecini, C., Castro, E., Inguaggiato, E., Cecchi, F., Dario, P., Sgandurra, G., & Cioni, G. (2019) · Springer eBooks · doi:10.1007/978-3-030-19913-5_9 · Cited by 16
Lv, Q., Wang, X., Wang, X., Ge, S., & Lin, P. (2024) · Brain and Cognition · doi:10.1016/j.bandc.2024.106221 · Cited by 13
Veerapandian, K. D., Tan, G. X. D., Majeed, N. M., & Hartanto, A. (2023) · Brain Sciences · doi:10.3390/brainsci13020206 · Cited by 11
Horata, E. T., & Kundakcı, Y. E. (2022) · Gait & Posture · doi:10.1016/j.gaitpost.2022.08.020 · Cited by 8
Contreras-Osorio, F., Ramírez‐Campillo, R., Cerda-Vega, E., Campos-Jara, R., Martínez‐Salazar, C., Arellano-Roco, C., & Campos‐Jara, C. (2022) · Brain Sciences · doi:10.3390/brainsci12091142 · Cited by 7
“On this basis, other higher-order executive functions are organized, such as reasoning, problem solving, and planning [4].”
BackgroundExecutive functions and psychosocial impairment in children following arterial ischemic stroke
Rivella, C., Zanetti, A., Bertamino, M., Severino, M., Primavera, L., Signa, S., Moretti, P., & Viterbori, P. (2022) · Child Neuropsychology · doi:10.1080/09297049.2022.2083093 · Cited by 12
“From these core components, higher order EFs, such as problem solving and planning are built (Collins & Koechlin, 2012; Lunt et al., 2012).”
BackgroundHolmefur, M., Roshanai, A. H., White, S., Janeslätt, G. K., Vimefall, E., & Lidström-Holmqvist, K. (2021) · Trials · doi:10.1186/s13063-021-05578-x · Cited by 8
“From these skills, higherlevel cognitive functions such as reasoning, problem solving, and planning are built [8, 9].”
BackgroundFontana, M., Usai, M. C., Pellizzoni, S., & Passolunghi, M. C. (2021) · Brain Sciences · doi:10.3390/brainsci11050636 · Cited by 13
“The literature agrees on the fact that EFs can be distinguished into three core components: updating, inhibition, and shifting [14], which support higherorder cognitive processes such as problem-solving or planning [14,15].”
BackgroundPrefrontal Cortex in Control: Broadening the Scope to Identify Mechanisms
Alexander, W. H., Brown, J. W., Collins, A. G. E., Hayden, B. Y., & Vassena, E. (2017) · Journal of Cognitive Neuroscience · doi:10.1162/jocn_a_01154 · Cited by 7
“…reward prediction errors to update representations at multiple abstraction levels (Alexander & Brown, 2015a; Donoso, Collins, & Koechlin, 2014; Collins & Koechlin, 2012), affording simultaneous learning of simple stimulus–action contingencies and more complex context–rule associations…”
Self-citationApproche développementale des fonctions exécutives : du bébé à l’adolescence
Fourneret, P., & Portes, V. D. (2016) · Archives de Pédiatrie · doi:10.1016/j.arcped.2016.10.003 · Cited by 37
Neural correlates of uncertainty processing: meta-analysis of fMRI studies
Timashkov, A., Anderson, S., & Zinchenko, O. O. (2025) · Frontiers in Neuroscience · doi:10.3389/fnins.2025.1662272 · Cited by 9
“…systems aligns with hierarchical models of prefrontal cortex organization–the cascade model of cognitive control (Koechlin et al., 2003; Collins and Koechlin, 2012; Donoso et al., 2014) which posits two coordinated tracks within the prefrontal cortex: a medial track, including the…”
Executive function in children with signs of specific learning disorders
Ceruti, C., Pecini, C., & Marzocchi, G. M. (2025) · Research in Developmental Disabilities · doi:10.1016/j.ridd.2025.105069 · Cited by 9
Brain functional connectivity network during deception: a visibility graph approach
Saryazdi, A. R., Bayani, A., Ghassemi, F., & Rajagopal, K. (2025) · The European Physical Journal Special Topics · doi:10.1140/epjs/s11734-025-01607-x · Cited by 7
“The frontal lobe, often associated with decision-making, reasoning, and cognitive control [39], appeared to exhibit heightened connectivity during lying, which aligns with its critical role in managing cognitive load and inhibiting truthful responses.”
Ruffini, C., Pizzigallo, E., Pecini, C., Bertolo, L., & Carretti, B. (2025) · Reading Research Quarterly · doi:10.1002/rrq.70006 · Cited by 11
Chambers, D. W., & Thakkar, D. (2022) · American Journal of Orthodontics and Dentofacial Orthopedics · doi:10.1016/j.ajodo.2021.05.009 · Cited by 12
Barack, D. L., Bakkour, A., Shohamy, D., & Salzman, C. D. (2023) · Scientific Reports · doi:10.1038/s41598-023-27662-9 · Cited by 9
“…et al. 2018; Schulz, Franklin et al. 2020), lack a decisionmaking component (Schapiro, Rogers et al. 2013), utilize single choices during trials (Collins and Koechlin 2012; Collins and Frank 2013; Collins, Cavanagh et al. 2014; Donoso, Collins et al. 2014; Collins 2017), or lack the choice…”
MethodRoshannia, S., Maleki-Karamolah, S., Akhlaghi, Z., & Kordestani-Moghadam, P. (2021) · International Clinical Neuroscience Journal · doi:10.34172/icnj.2021.14 · Cited by 8
Jung, M., Kim, H. S., Loprinzi, P. D., & Kang, M. (2021) · AIMS neuroscience · doi:10.3934/neuroscience.2021008 · Cited by 12
“Furthermore, one study that evaluated a computational model of the frontal executive function provided evidence that human frontal lobe function supports integration between reasoning, learning, and creative abilities in open-ended and uncertain situations [23].”
Food Addiction and Cognitive Functioning: What Happens in Adolescents?
Rodrigue, C., Iceta, S., & Bégin, C. (2020) · Nutrients · doi:10.3390/nu12123633 · Cited by 10
“, reasoning, problem solving, and planning) [11,12].”
The link between executive functions and literacy: introduction
Filipe, M. G., Castro, S. L., & Limpo, T. (2020) · Reading and Writing · doi:10.1007/s11145-020-10037-1 · Cited by 12
FAST: A Novel, Executive Function-Based Approach to Cognitive Enhancement
Almquist, J. N.-F., Mathan, S. A., Brem, A., Plessow, F., McKanna, J. A., Santarnecchi, E., Pascual‐Leone, Á., Kadosh, R. C., Pavel, M., & Yeung, N. (2019) · Frontiers in Human Neuroscience · doi:10.3389/fnhum.2019.00235 · Cited by 8
Landry-Roy, C., Bernier, A., Gravel, J., & Beauchamp, M. H. (2018) · Journal of the International Neuropsychological Society · doi:10.1017/s1355617718000863
Éducation thérapeutique du patient : une analyse du concept de motivation
Naudin, D., Gagnayre, R., Marchand, C., & Reach, G. (2018) · Médecine des Maladies Métaboliques · doi:10.1016/s1957-2557(18)30013-0 · Cited by 14
The effect of musical training on executive functions
Chen, J., Liu, L., 王, 蓉., & Haizhou, S. H. E. N. (2017) · Advances in Psychological Science · doi:10.3724/sp.j.1042.2017.01854 · Cited by 6
“…在基线条件下音乐家与非音乐家的反应 时无差异, 但是在 1-Back 任务和 2-Back 任务中 音乐家的反应时明显要短于非音乐家的反应。同 时, 在 2-back 任务中音乐家的正确率要显著高于 非音乐家, 这表明在对工作记忆要求更高的任务 中音乐家比非音乐家表现得更好。fMRI 结果表明 音乐家比非音乐家在右侧外侧前额叶皮层(lateral prefrontal cortex, lPFC)、双侧背外侧前额叶皮层 (dorsolateral prefrontal cortex, dlPFC)后部、前扣带…”
Bhandari, A., Badre, D., & Frank, M. J. (2017) · Wiley eBooks · doi:10.1002/9781118920497.ch21 · Cited by 8
Pesce, M., Rizzuto, A., Fratta, I. L., Tatangelo, R., Campagna, G., Iannasso, M., Ferrone, A., Franceschelli, S., Speranza, L., Patruno, A., et al. (2015) · Neuroscience Research · doi:10.1016/j.neures.2015.11.007 · Cited by 6
“…Executive Function (EF) construction refers to a range of neuropsychological abilities that include inhibitory functions, working memory, and cognitive flexibility, on the basis of which reasoning and problem solving are developed (Lehto et al., 2003; Collins and Koechlin, 2012; Lunt et al., 2012).”
BackgroundLearning to learn about uncertain feedback
Faraut, M. C. M., Procyk, E., & Wilson, C. R. E. (2016) · Learning & Memory · doi:10.1101/lm.039768.115 · Cited by 13
“Monkeys and humans successfully make choices and switch strategies in tasks with both features (Pleskac 2008; Rudebeck et al. 2008; Walton et al. 2010; Collins and Koechlin 2012; Donoso et al. 2014; McGuire et al. 2014).”
BackgroundMethodGradient-based inference of abstract task representations for generalization in neural networksPreprint
Hummos, A., del Rio, F., Wang, M. B., Hurtado, J., Calderon, C., & Yang, G. R. (2024) · arXiv (Cornell University) · doi:10.48550/arxiv.2407.17356 · Cited by 1
“…respond to the same sensory input in novel ways by composing an appropriate task abstraction that guides processing of the input (Rikhye et al., 2018; Tafazoli et al., 2024), supporting flexible decision making and generalization to novel situations (Collins & Koechlin, 2012; Vaidya et al., 2021).”
BackgroundConesa, P. J. (2023) · Revista de Psicología Clínica con Niños y Adolescentes · doi:10.21134/rpcna.2023.10.3.6 · Cited by 6
“These EF have been shown to be a key element in the development of skills, as problem solving, reasoning or planning (Collins & Koechlin, 2012; Duncan et al., 2012), or skills related to reading (e.g., see Follmer, 2018; Gather-cole et al., 2004).”
BackgroundAfshadi, M. M. S., Amiri, S., & Talebi, H. (2023) · Current Psychology · doi:10.1007/s12144-023-04289-7 · Cited by 12
“Later studies pointed to reasoning, problem solving, and planning as the EFs resulting from these areas (Collins & Koechlin, 2012).”
Perturbation Variability Does Not Influence Implicit Sensorimotor Adaptation
Wang, T., Avraham, G., Tsay, J. S., Abram, S. J., & Ivry, R. B. (2024) · PLoS Computational Biology · doi:10.1371/journal.pcbi.1011951 · Cited by 10
Use of EEG Technique in a Cognitive Process Study- A Review
Sahar, N. S., Safri, N. M., & Zakaria, N. A. (2022) · ELEKTRIKA- Journal of Electrical Engineering · doi:10.11113/elektrika.v21n2.366 · Cited by 5
“Most of them claimed that the frontal lobe functions in planning [1] [2], attention [3], decision making [4], problem solving [1], and inhibition of behaviour [5].”
BackgroundRahman, J. S., Gedeon, T., Caldwell, S., & Jones, R. L. (2021) · CHI Conference Extended Abstracts on Human Factors in Computing Systems (CHI EA) · doi:10.1145/3411763.3451813 · Cited by 4
“Both of these channels are located in the frontal lobe and they have been connected to emotion processing [29, 31] and decision making [8].”
Do grid codes afford generalization and flexible decision-making?Preprint
Yu, L. Q., Park, S. A., Sweigart, S. C., Boorman, E. D., & Nassar, M. R. (2021) · arXiv (Cornell University) · doi:10.48550/arxiv.2106.16219 · Cited by 7
REJUVENATING THE MARKETING MIX THROUGH NEUROMARKETING TO CULTIVATE THE GREEN CONSUMER
Isa, S. M., & Mansor, A. A. (2020) · International Journal of Industrial Management · doi:10.15282/ijim.5.0.2020.5623 · Cited by 9
“Decision making takes place at the frontal lobes (Collins & Koechlin, 2012).”
BackgroundPensamento Computacional como intervenção para desenvolvimento cognitivo em idosos
Lucena, D., & Nunes, I. D. (2019) · Anais ... Workshops do Congresso Brasileiro de Informática na Educação · doi:10.5753/cbie.wcbie.2019.1447 · Cited by 3
Action in auctions: neural and computational mechanisms of bidding behaviour
Martinez‐Saito, M., Коновалов, Р. Н., Пирадов, М. А., Шестакова, А. Н., Gutkin, B. S., & Klucharev, V. A. (2019) · European Journal of Neuroscience · doi:10.1111/ejn.14492 · Cited by 8
“It is also plausible that parallel computations could be adaptively deployed or left in standby by an arbitration process which decided which of them controls behaviour (Collins & Koechlin, 2012; Daw et al., 2011).”
BackgroundSadoughi, M., & اورگانی, ز. م. (2017) · Advances in nursing and midwifery · doi:10.22037/anm.v27i2.17152 · Cited by 12
“Also, since smartphones are more likely to be used for multitasking, they can possibly cause much stress for their users by limiting their relief [15].”
BackgroundTremmel, C. (2019) · doi:10.25777/m4g6-1g88 · Cited by 6
“The frontal lobe is associated with decision making [79] and researchers have found a connection between increased theta activity and memory load in working memory tasks [80].”
BackgroundWang, T., & Ivry, R. B. (2025) · Science Advances · doi:10.1126/sciadv.adr4540 · Cited by 18
“Where relevant, we consider several alternative models that have been proposed to elucidate how context and environmental uncertainty modulate sensorimotor learning ( 31 – 33 ).”
Metadata
- Authors
- Collins, A., & Koechlin, E.
- Affiliations
- Brown University (US)
- Corresponding author
- Collins, Anne
- ORCID
- Collins, Anne
- Venue
- PLoS Biology
- Publisher
- Public Library of Science (PLoS)
- Published
- 2012-03-27
- Volume
- 10
- Issue
- 3
- Pages
- e1001293
- ISSN
- 1544-9173 (ISSN-L)
- 1545-7885
- PMC
- PMC3313946
- OpenAlex
- W2093397813
- Cited by
- 558
- References
- 64
- Citations by year
- 2026: 24 · 2025: 45 · 2024: 47 · 2023: 47 · 2022: 66 · 2021: 69 · 2020: 58 · 2019: 47 · 2018: 39 · 2017: 29 · 2016: 24 · 2015: 25 · 2014: 19 · 2013: 14 · 2012: 5
- FWCI
- 10.33
- Type
- journal article
- Language
- en
- Open access
- gold
- doi.org
- Locations
- PLoS Biology (publishedVersion, cc-by)
- Europe PMC (PubMed Central) (publishedVersion, cc-by)
- PubMed Central (publishedVersion, cc-by)
- PubMed (publishedVersion)
- HAL (submittedVersion, other-oa)
- DOAJ (DOAJ: Directory of Open Access Journals) (submittedVersion, cc-by-sa)
- Figshare (submittedVersion, cc-by)
- Funders
- FP7 Ideas: European Research Council (250106)
- Topics
- Life Sciences › Neuroscience › Cognitive Neuroscience › Neural and Behavioral Psychology Studies
- Social Sciences › Decision Sciences › General Decision Sciences › Decision-Making and Behavioral Economics
- Social Sciences › Psychology › Experimental and Cognitive Psychology › Cognitive Functions and Memory
- Keywords
- frontal lobe function, executive function, decision-making, behavioral strategies, strategy monitoring, exploration, creativity, reasoning, learning, reward maximization, individual differences, naturalistic decision making, adaptive behavior
- MeSH terms
- Adaptation, Psychological, Behavior, Cognition, Creativity, Cues, Decision Making, Frontal Lobe, Humans, Individuality, Learning, Models, Neurological, Computational Biology, Executive Function
About these checks
Registry, retraction, Cites and statistics results are computed, not judged, with one exception: a printed reference that no index lists is read once by a model before it counts as a citation error. Claims are extracted by a model and kept only when their quote appears verbatim in the text; each cited source is then checked, with a model’s help, for whether it says what the claim relies on. Those verdicts can be wrong — read the claim’s quote and the cited source before relying on one.
Statistics and arithmetic are recomputed, not judged.
Confidence bands are shown only for fields calibrated on our annotated test set. None is calibrated yet, so no band is shown.
What counts as a claim ›How we measure confidence ›How we check this ›
Are you an author, or do you see a problem with this page? Request a review
Data sources
Bibliographic data: Semantic Scholar, OpenAlex, Crossref.
Contains information from the Semantic Scholar Academic Graph Datasets, made available under the ODC Attribution License (ODC-BY 1.0).
Semantic Scholar’s data is described in: Kinney, R., et al. (2023). The Semantic Scholar Open Data Platform. arXiv:2301.10140.
