

Prediction Errors but Not Sharpened Signals Simulate Multivoxel fMRI Patterns during Speech Perception
Open accessThe DOI matches its Crossref record; 114 of the 114 references it cites were found in a registry or an index.
Abstract
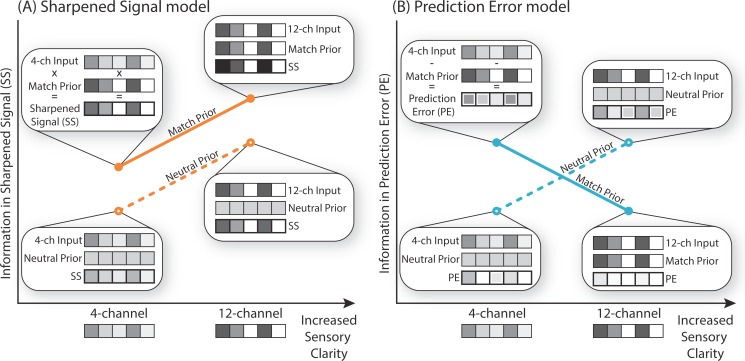
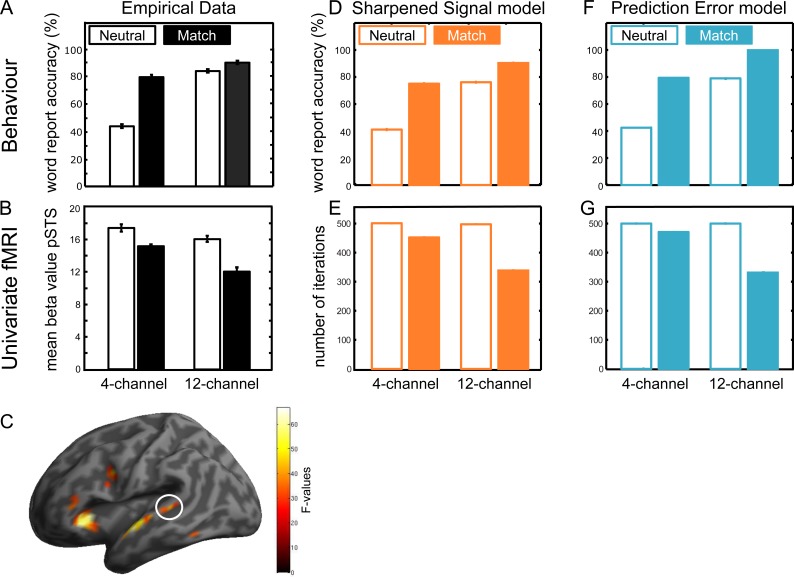
Successful perception depends on combining sensory input with prior knowledge. However, the underlying mechanism by which these two sources of information are combined is unknown. In speech perception, as in other domains, two functionally distinct coding schemes have been proposed for how expectations influence representation of sensory evidence. Traditional models suggest that expected features of the speech input are enhanced or sharpened via interactive activation (Sharpened Signals). Conversely, Predictive Coding suggests that expected features are suppressed so that unexpected features of the speech input (Prediction Errors) are processed further. The present work is aimed at distinguishing between these two accounts of how prior knowledge influences speech perception. By combining behavioural, univariate, and multivariate fMRI measures of how sensory detail and prior expectations influence speech perception with computational modelling, we provide evidence in favour of Prediction Error computations. Increased sensory detail and informative expectations have additive behavioural and univariate neural effects because they both improve the accuracy of word report and reduce the BOLD signal in lateral temporal lobe regions. However, sensory detail and informative expectations have interacting effects on speech representations shown by multivariate fMRI in the posterior superior temporal sulcus. When prior knowledge was absent, increased sensory detail enhanced the amount of speech information measured in superior temporal multivoxel patterns, but with informative expectations, increased sensory detail reduced the amount of measured information. Computational simulations of Sharpened Signals and Prediction Errors during speech perception could both explain these behavioural and univariate fMRI observations. However, the multivariate fMRI observations were uniquely simulated by a Prediction Error and not a Sharpened Signal model. The interaction between prior expectation and sensory detail provides evidence for a Predictive Coding account of speech perception. Our work establishes methods that can be used to distinguish representations of Prediction Error and Sharpened Signals in other perceptual domains.
Overview
The claims and statistics of this paper haven’t been checked yet.
Free: it reads the open-access text and checks the first 5 claims that cite a source we can check. Create a free account to check every claim.
Integrity signals
Registry
Cites
Statistics
Figures


Verification
Claims the paper makes
The claims and statistics of this paper haven’t been checked yet.
Free: it reads the open-access text and checks the first 5 claims that cite a source we can check. Create a free account to check every claim.
Claims other papers make about this one
Each is checked against this paper’s own text: does it say what the citing paper says it does?
The source backs part of the claim, not all of it — or backs it for a different population, condition or comparison.
In the citing paper
“that BOLD responses in posterior superior temporal sulcus (pSTS) to expected words were weaker and contained less information, as quantified by representational similarity analysis (RSA) [88];”
From How Do Expectations Shape Perception? (2018) · cites this paper as [88]
Experimental — accuracy not yet measured
Self-check
Percentages, sums and reported differences re-computed from the paper’s own numbers.
The self-check needs the paper’s full text.
Citations
Cites
Hearing lips and seeing voices
MCGURK, H., & MACDONALD, J. (1976) · Nature · doi:10.1038/264746a0 · Cited by 6,183
Whatever next? Predictive brains, situated agents, and the future of cognitive science
Clark, A. (2013) · Behavioral and Brain Sciences · doi:10.1017/s0140525x12000477 · Cited by 5,924
The cortical organization of speech processing
Hickok, G., & Poeppel, D. (2007) · Nature Reviews Neuroscience · doi:10.1038/nrn2113 · Cited by 5,495
Rao, R. P. N., & Ballard, D. H. (1999) · Nature Neuroscience · doi:10.1038/4580 · Cited by 5,483
A theory of cortical responses.
Friston, K. (2005) · Philosophical Transactions of the Royal Society B: Biological Sciences · doi:10.1098/rstb.2005.1622 · Cited by 4,578
Rubber hands ‘feel’ touch that eyes see
Botvinick, M., & Cohen, J. (1998) · Nature · doi:10.1038/35784 · Cited by 4,410
Representational similarity analysis-connecting the branches of systems neuroscience
Kriegeskorte, N. (2008) · Frontiers in Systems Neuroscience · doi:10.3389/neuro.06.004.2008 · Cited by 3,355
Speech Recognition with Primarily Temporal Cues
Shannon, R. V., Zeng, F.-G., Kamath, V., Wygonski, J., & Ekelid, M. (1995) · Science · doi:10.1126/science.270.5234.303 · Cited by 3,024
The TRACE model of speech perception
McClelland, J. L., & Elman, J. L. (1986) · Cognitive Psychology · doi:10.1016/0010-0285(86)90015-0 · Cited by 2,956
AIC model selection using Akaike weights
Wagenmakers, E.-J., & Farrell, S. (2004) · Psychonomic Bulletin & Review · doi:10.3758/bf03206482 · Cited by 2,684
Cited by
How Do Expectations Shape Perception?
de Lange, F. P., Heilbron, M., & Kok, P. (2018) · Trends in Cognitive Sciences · doi:10.1016/j.tics.2018.06.002 · Cited by 975
The Encoding of Speech Sounds in the Superior Temporal Gyrus
Yi, H. G., Leonard, M. K., & Chang, E. F. (2019) · Neuron · doi:10.1016/j.neuron.2019.04.023 · Cited by 417
A hierarchy of linguistic predictions during natural language comprehension
Heilbron, M., Armeni, K., Schoffelen, J.-M., Hagoort, P., & de Lange, F. P. (2022) · Proceedings of the National Academy of Sciences · doi:10.1073/pnas.2201968119 · Cited by 343
Evaluating the neurophysiological evidence for predictive processing as a model of perception
Walsh, K. S., McGovern, D. P., Clark, A., & O'Connell, R. G. (2020) · Annals of the New York Academy of Sciences · doi:10.1111/nyas.14321 · Cited by 333
The Perceptual Prediction Paradox
Press, C., Kok, P., & Yon, D. (2020) · Trends in Cognitive Sciences · doi:10.1016/j.tics.2019.11.003 · Cited by 246
Metadata
- Authors
- Blank, H., & Davis, M. H.
- Affiliations
- MRC Cognition and Brain Sciences Unit (GB)
- Corresponding author
- Blank, Helen
- Venue
- PLOS Biology
- Publisher
- Public Library of Science (PLoS)
- Published
- 2016-11-15
- Volume
- 14
- Issue
- 11
- Pages
- e1002577
- ISSN
- 1544-9173 (ISSN-L)
- 1545-7885
- PMC
- PMC5112801
- OpenAlex
- W2549771691
- Cited by
- 181
- References
- 112
- Citations by year
- 2026: 10 · 2025: 15 · 2024: 21 · 2023: 14 · 2022: 55 · 2021: 14 · 2020: 18 · 2019: 14 · 2018: 13 · 2017: 7
- FWCI
- 7.21
- Type
- journal article
- Language
- en
- Open access
- gold
- doi.org
- Licence
- Locations
- PLoS Biology (publishedVersion, cc-by)
- PubMed Central (publishedVersion, cc-by)
- PubMed (publishedVersion)
- RePEc: Research Papers in Economics (submittedVersion)
- DOAJ (DOAJ: Directory of Open Access Journals) (submittedVersion)
- OSF Preprints (OSF Preprints) (submittedVersion)
- Funders
- Medical Research Council (MC-A060-5PQ80)
- Topics
- Life Sciences › Neuroscience › Cognitive Neuroscience › Neurobiology of Language and Bilingualism
- Social Sciences › Psychology › Experimental and Cognitive Psychology › Phonetics and Phonology Research
- Life Sciences › Neuroscience › Cognitive Neuroscience › Neuroscience and Music Perception
- Keywords
- speech perception, prediction error, predictive coding, interactive activation, prior expectations, sensory detail, posterior superior temporal sulcus, lateral temporal lobe, perceptual representation
- MeSH terms
- Behavior, Humans, Magnetic Resonance Imaging, Models, Theoretical, Speech Perception, Temporal Lobe, Multivariate Analysis
About these checks
Registry, retraction, Cites and statistics results are computed, not judged, with one exception: a printed reference that no index lists is read once by a model before it counts as a citation error. Claims are extracted by a model and kept only when their quote appears verbatim in the text; each cited source is then checked, with a model’s help, for whether it says what the claim relies on. Those verdicts can be wrong — read the claim’s quote and the cited source before relying on one.
Statistics and arithmetic are recomputed, not judged.
Confidence bands are shown only for fields calibrated on our annotated test set. None is calibrated yet, so no band is shown.
What counts as a claim ›How we measure confidence ›How we check this ›
Are you an author, or do you see a problem with this page? Request a review
How to cite
Cite CoChat for the checks on this page, and the paper for its own findings.
- This page
- CoChat. (2026). Citation check: Prediction Errors but Not Sharpened Signals Simulate Multivoxel fMRI Patterns during Speech Perception. https://app.cochat.ai/papers/10.1371/journal.pbio.1002577
- The paper
- Blank, H., & Davis, M. H. (2016). Prediction Errors but Not Sharpened Signals Simulate Multivoxel fMRI Patterns during Speech Perception. PLOS Biology. https://doi.org/10.1371/journal.pbio.1002577
Data sources
Bibliographic data: Semantic Scholar, OpenAlex, Crossref.
Contains information from the Semantic Scholar Academic Graph Datasets, made available under the ODC Attribution License (ODC-BY 1.0).
Semantic Scholar’s data is described in: Kinney, R., et al. (2023). The Semantic Scholar Open Data Platform. arXiv:2301.10140.
