

The DOI matches its Crossref record; 27 of the 28 references it cites were found in a registry or an index.
Identifying a High Fraction of the Human Genome to be under Selective Constraint Using GERP++
Open accessAbstract
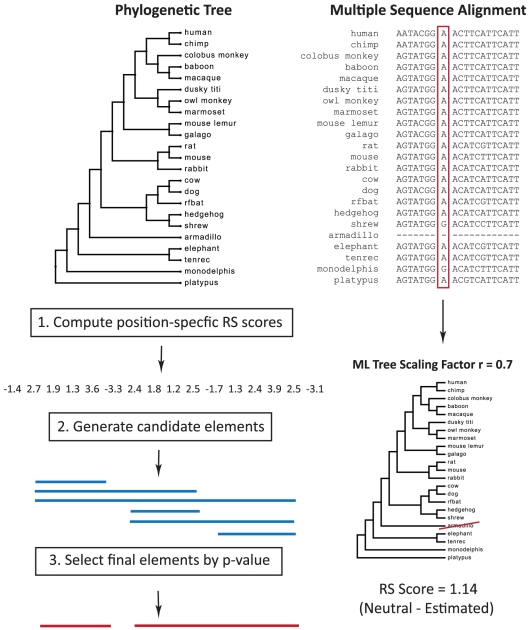
Computational efforts to identify functional elements within genomes leverage comparative sequence information by looking for regions that exhibit evidence of selective constraint. One way of detecting constrained elements is to follow a bottom-up approach by computing constraint scores for individual positions of a multiple alignment and then defining constrained elements as segments of contiguous, highly scoring nucleotide positions. Here we present GERP++, a new tool that uses maximum likelihood evolutionary rate estimation for position-specific scoring and, in contrast to previous bottom-up methods, a novel dynamic programming approach to subsequently define constrained elements. GERP++ evaluates a richer set of candidate element breakpoints and ranks them based on statistical significance, eliminating the need for biased heuristic extension techniques. Using GERP++ we identify over 1.3 million constrained elements spanning over 7% of the human genome. We predict a higher fraction than earlier estimates largely due to the annotation of longer constrained elements, which improves one to one correspondence between predicted elements with known functional sequences. GERP++ is an efficient and effective tool to provide both nucleotide- and element-level constraint scores within deep multiple sequence alignments.
Overview
The claims and statistics of this paper haven’t been checked yet.
Run the check — free, no account needed. It reads the open-access text and checks the sources it cites.
Integrity signals
Registry
Cites
Statistics
Figures
Verification
Claims the paper makes
The claims and statistics of this paper haven’t been checked yet.
Run the check — free, no account needed. It reads the open-access text and checks the sources it cites.
Claims other papers make about this one
Each is checked against this paper’s own text: does it say what the citing paper says it does?
In the citing paper
“Various comparative genomics resources, including PhyloP (Pollard et al., 2010), PhastCons (Siepel et al., 2005), and GERP++ (Davydov et al., 2010), showed our top loci to have similar properties regardless of the extent of pleiotropy.”
From Genomic Relationships, Novel Loci, and Pleiotropic Mechanisms across Eight Psychiatric Disorders (2019) · cites this paper as Davydov et al., 2010
Self-check
Percentages, sums and reported differences re-computed from the paper’s own numbers.
The self-check needs the paper’s full text.
Citations
Cites
Basic local alignment search tool
Altschul, S. F., Gish, W., Miller, W., Myers, E. W., & Lipman, D. J. (1990) · Journal of Molecular Biology · doi:10.1006/jmbi.1990.9999 · Cited by 98,669
Maximum Likelihood from Incomplete Data Via the EM Algorithm
Dempster, A. P., Laird, N. M., & Rubin, D. B. (1977) · Journal of the Royal Statistical Society Series B: Statistical Methodology · doi:10.1111/j.2517-6161.1977.tb01600.x · Cited by 50,444
Kimura, M. (1980) · Journal of Molecular Evolution · doi:10.1007/bf01731581 · Cited by 29,778
Numerical recipes in C: the art of scientific computing
(1993) · Choice Reviews Online · doi:10.5860/choice.30-5638 · Cited by 17,933
Evolutionary trees from DNA sequences: A maximum likelihood approach.
Felsenstein, J. (1981) · Journal of Molecular Evolution · doi:10.1007/bf01734359 · Cited by 14,571
Numerical recipes in Pascal: the art of scientific computing
(1990) · Choice Reviews Online · doi:10.5860/choice.27-5158 · Cited by 12,040
Evolution of Protein Molecules
JUKES, T. H., & CANTOR, C. R. (1969) · Mammalian Protein Metabolism · doi:10.1016/b978-1-4832-3211-9.50009-7 · Cited by 11,032
The Human Genome Browser at UCSC
Kent, W. J., Sugnet, C. W., Furey, T. S., Roskin, K. M., Pringle, T. H., Zahler, A. M., & Haussler, A. D. (2002) · Genome Research · doi:10.1101/gr.229102 · Cited by 10,400
Dating of the human–ape splitting by a molecular clock of mitochondrial DNA.
Hasegawa, M., Kishino, H., & Yano, T.-A. (1985) · Journal of Molecular Evolution · doi:10.1007/bf02101694 · Cited by 8,687
The ENCODE Project Consortium (2007) · Nature · doi:10.1038/nature05874 · Cited by 5,223
Cited by
Sorted by citations
Items 401–500 of 1,000
Desmoplakin and periplakin genetically and functionally contribute to eosinophilic esophagitis
Shoda, T., Kaufman, K. M., Wen, T., Caldwell, J. M., Osswald, G. A., Pathre, P., Zimmermann, N., Collins, M. H., Rehn, K., Foote, H. L., et al. (2021) · Nature Communications · doi:10.1038/s41467-021-26939-9 · Cited by 47
Ducoli, L., Agrawal, S., Sibler, E., Kouno, T., Tacconi, C., Hon, C.-C., Berger, S. D., Müllhaupt, D., He, Y., Kim, J., et al. (2021) · Nature Communications · doi:10.1038/s41467-021-21217-0 · Cited by 46
Evolutionary conservation in noncoding genomic regions
Leypold, N. A., & Speicher, M. R. (2021) · Trends in Genetics · doi:10.1016/j.tig.2021.06.007 · Cited by 51
Kerner, B., Rao, A. R., Christensen, B. R., Dandekar, S., Yourshaw, M., & Nelson, S. F. (2013) · Frontiers in Psychiatry · doi:10.3389/fpsyt.2013.00154 · Cited by 50
Congenital dilated cardiomyopathy caused by biallelic mutations in Filamin C
Reinstein, E., Gutiérrez‐Fernández, A., Tzur, S., Bormans, C. A., Marcu, S., Tayeb-Fligelman, E., Vinkler, C., Raas‐Rothschild, A., Irge, D., Landau, M., et al. (2016) · European Journal of Human Genetics · doi:10.1038/ejhg.2016.110 · Cited by 46
Using Population Genetics to Interrogate the Monogenic Nephrotic Syndrome Diagnosis in a Case Cohort
Sampson, M. G., Gillies, C. E., Robertson, C. C., Crawford, B. D., Vega-Warner, V., Otto, E. A., Kretzler, M., & Kang, H. M. (2015) · Journal of the American Society of Nephrology · doi:10.1681/asn.2015050504 · Cited by 45
Melchionda, S., Palladino, T., Castellana, S., Giordano, M., Benetti, E., Bonis, P. D., Zelante, L., & Bisceglia, L. (2016) · Journal of Human Genetics · doi:10.1038/jhg.2016.58 · Cited by 45
Principles and methods of in-silico prioritization of non-coding regulatory variants
Lee, P. H., Lee, C. R., Li, X., Wee, B., Dwivedi, T., & Daly, M. J. (2017) · Human Genetics · doi:10.1007/s00439-017-1861-0 · Cited by 46
Functional characterization of CHEK2 variants in a Saccharomyces cerevisiae system
Delimitsou, A., Fostira, F., Kalfakakou, D., Apostolou, P., Konstantopoulou, I., Κroupis, C., Papavassiliou, A. G., Kleibl, Z., Stratikos, E., Voutsinas, G. E., et al. (2019) · Human Mutation · doi:10.1002/humu.23728 · Cited by 46
Genetic variation drives seasonal onset of hibernation in the 13-lined ground squirrel
Grabek, K. R., Cooke, T. F., Epperson, L. E., Spees, K., Cabral, G. F., Sutton, S. C., Merriman, D. K., Martin, S. L., & Bustamante, C. D. (2019) · Communications Biology · doi:10.1038/s42003-019-0719-5 · Cited by 46
Expanding the phenotype of PRPS1 syndromes in females: neuropathy, hearing loss and retinopathy
Almoguera, B., He, S., Cortón, M., Jose, P. F.-S., Blanco‐Kelly, F., López-Molina, M. I., García‐Sandoval, B., del Val, J., Guo, Y., Tian, L., et al. (2014) · Orphanet Journal of Rare Diseases · doi:10.1186/s13023-014-0190-9 · Cited by 45
Determining the Effect of Natural Selection on Linked Neutral Divergence across Species
Phung, T. N., Huber, C. D., & Lohmueller, K. E. (2016) · PLOS Genetics · doi:10.1371/journal.pgen.1006199 · Cited by 45
Ansar, M., Ebstein, F., Özkoç, H., Paracha, S. A., Iwaszkiewicz, J., Gesemann, M., Zoete, V., Ranza, E., Santoni, F. A., Sarwar, M. T., et al. (2020) · Human Molecular Genetics · doi:10.1093/hmg/ddaa032 · Cited by 44
Clarke, C. M., Fok, V. T., Gustafson, J. A., Smyth, M. D., Timms, A. E., Frazar, C. D., Smith, J. D., Birgfeld, C. B., Lee, A., Ellenbogen, R. G., et al. (2018) · American Journal of Medical Genetics Part A · doi:10.1002/ajmg.a.38540 · Cited by 44
Roscito, J. G., Sameith, K., Kirilenko, B. M., Hecker, N., Winkler, S., Dahl, A., Rodrigues, M. T., & Hiller, M. (2022) · Cell Reports · doi:10.1016/j.celrep.2021.110280 · Cited by 44
Impact of whole-genome duplications on structural variant evolution in Cochlearia
Hämälä, T., Moore, C., Cowan, L., Carlile, M., Gopaulchan, D., Brandrud, M. K., Birkeland, S., Loose, M., Kolář, F., Koch, М. A., et al. (2024) · Nature Communications · doi:10.1038/s41467-024-49679-y · Cited by 44
Zhang, Y., Qiu, Z., Wei, L., Tang, R., Lian, B., Zhao, Y., He, X., & Xie, L. (2014) · PLoS ONE · doi:10.1371/journal.pone.0100854 · Cited by 45
Functional classification of 15 million SNPs detected from diverse chicken populations
Gheyas, A., Boschiero, C., Eöry, L., Ralph, H., Kuo, R. I., Woolliams, J. A., & Burt, D. W. (2015) · DNA Research · doi:10.1093/dnares/dsv005 · Cited by 48
Farag, H. G., Froehler, S., Oexle, K., Ravindran, E., Schindler, D., Staab, T., Huebner, A., Kraemer, N., Chen, W., & Kaindl, A. M. (2013) · Orphanet Journal of Rare Diseases · doi:10.1186/1750-1172-8-178 · Cited by 45
Orlando, G., Law, P., Palin, K., Tuupanen, S., Gylfe, A. E., Hänninen, U. A., Cajuso, T., Tanskanen, T. J., Kondelin, J., Kaasinen, E., et al. (2016) · Human Molecular Genetics · doi:10.1093/hmg/ddw087 · Cited by 44
Analysis of DNAJC13 mutations in French-Canadian/French cohort of Parkinson's disease
Ross, J. P., Dupré, N., Dauvilliers, Y. A., Strong, S., Ambalavanan, A., Spiegelman, D., Dionne‐Laporte, A., Pourcher, E., Langlois, M., Boivin, M., et al. (2016) · Neurobiology of Aging · doi:10.1016/j.neurobiolaging.2016.04.023 · Cited by 44
van Eyk, C. L., Webber, D. L., Minoche, A. E., Pérez‐Jurado, L. A., Corbett, M. A., Gardner, A. E., Berry, J. G., Harper, K., MacLennan, A. H., & Gécz, J. (2021) · npj Genomic Medicine · doi:10.1038/s41525-021-00238-0 · Cited by 45
Sung, Y. J., de las Fuentes, L., Winkler, T. W., Chasman, D. I., Bentley, A. R., Kraja, A. T., Ntalla, I., Warren, H. R., Guo, X., Schwander, K., et al. (2019) · Human Molecular Genetics · doi:10.1093/hmg/ddz070 · Cited by 43
De novo deletion of chromosome 11q12.3 in monozygotic twins affected by Poland Syndrome
Vaccari, C. M., Romanini, M. V., Musante, I., Tassano, E., Gimelli, S., Divizia, M. T., Torre, M., Morovic, C. G., Lerone, M., Ravazzolo, R., et al. (2014) · BMC Medical Genetics · doi:10.1186/1471-2350-15-63 · Cited by 43
Foley, J. W., & Sidow, A. (2013) · BMC Genomics · doi:10.1186/1471-2164-14-720 · Cited by 44
Self-citationKhan, A. O., Bećirović, E., Betz, C., Neuhaus, C., Altmüller, J., Riedmayr, L. M., Motameny, S., Nürnberg, G., Nürnberg, P., & Bolz, H. J. (2017) · Scientific Reports · doi:10.1038/s41598-017-01577-8 · Cited by 43
Genetic analysis of neurodegenerative diseases in a pathology cohort
Blauwendraat, C., Pletniková, O., Geiger, J. T., Murphy, N. A., Abramzon, Y. A., Rudow, G. L., Mamais, A., Sabir, M. S., Crain, B. J., Ahmed, S., et al. (2018) · Neurobiology of Aging · doi:10.1016/j.neurobiolaging.2018.11.007 · Cited by 44
CpG traffic lights are markers of regulatory regions in human genome
Lioznova, A. V., Khamis, A. M., Artemov, A. V., Besedina, E. G., Ramensky, V. E., Bajić, V. B., Kulakovskiy, I. V., & Medvedeva, Y. A. (2019) · BMC Genomics · doi:10.1186/s12864-018-5387-1 · Cited by 45
Functional annotation of rare structural variation in the human brain
Han, L., Zhao, X., Benton, M. L., Perumal, T. M., Collins, R. L., Hoffman, G. E., Johnson, J., Sloofman, L. G., Wang, H. Z., Stone, M. R., et al. (2020) · Nature Communications · doi:10.1038/s41467-020-16736-1 · Cited by 46
Preneoplastic somatic mutations including MYD88 L265P in lymphoplasmacytic lymphoma
Rodríguez, S., Celay, J., Goicoechea, I., Jiménez, C., Botta, C., Garcia-Barchino, M. J., Garcés, J., Larráyoz, M., Santos, S. A., Alignani, D., et al. (2022) · Science Advances · doi:10.1126/sciadv.abl4644 · Cited by 47
Rockowitz, S., & Zheng, D. (2015) · Nucleic Acids Research · doi:10.1093/nar/gkv514 · Cited by 42
Fröhler, S., Kieslich, M., Langnick, C., Feldkamp, M., Opgen‐Rhein, B., Berger, F. F., Will, J. C., & Chen, W. (2014) · BMC Medical Genetics · doi:10.1186/1471-2350-15-48 · Cited by 43
Rosenthal, E. A., Ranchalis, J., Crosslin, D. R., Burt, A., Brunzell, J. D., Motulsky, A. G., Nickerson, D. A., Wijsman, E. M., & Jarvik, G. P. (2013) · The American Journal of Human Genetics · doi:10.1016/j.ajhg.2013.10.019 · Cited by 42
Complex mode of inheritance in holoprosencephaly revealed by whole exome sequencing
Mouden, C., Dubourg, C., Carré, W., Rose, S., Quēlin, C., Akloul, L., Hamdi‐Rozé, H., Viot, G., Salhi, H., Darnault, P., et al. (2016) · Clinical Genetics · doi:10.1111/cge.12722 · Cited by 42
Mutation analysis of the MS4A and TREM gene clusters in a case-control Alzheimer's disease data set
Ghani, M., Sato, C., Kakhki, E. G., Gibbs, J. R., Traynor, B. J., George‐Hyslop, P. S., & Rogaeva, E. A. (2016) · Neurobiology of Aging · doi:10.1016/j.neurobiolaging.2016.03.009 · Cited by 43
Genetic surfing in human populations: from genes to genomes
Peischl, S., Dupanloup, I., Bosshard, L., & Excoffier, L. (2016) · Current Opinion in Genetics & Development · doi:10.1016/j.gde.2016.08.003 · Cited by 43
A phenotype centric benchmark of variant prioritisation tools
Anderson, D. R., & Lassmann, T. (2018) · npj Genomic Medicine · doi:10.1038/s41525-018-0044-9 · Cited by 42
Backhouse, B., Hanna, C., Robevska, G., van den Bergen, J., Pelosi, E., Simons, C., Koopman, P. A., Juniarto, A. Z., Grover, S. R., Faradz, S. M., et al. (2018) · Sexual Development · doi:10.1159/000494896 · Cited by 42
Characterisation and functional predictions of canine long non-coding RNAs
Béguec, C. L., Wucher, V., Lagoutte, L., Cadieu, É., Botherel, N., Hédan, B., Brito, C. D., Guillory, A.-S., André, C., Derrien, T., et al. (2018) · Scientific Reports · doi:10.1038/s41598-018-31770-2 · Cited by 42
Mourikis, T. P., Benedetti, L. G., Foxall, E., Temelkovski, D., Nulsen, J., Perner, J., Cereda, M., Lagergren, J., Howell, M. T., Yau, C., et al. (2019) · Nature Communications · doi:10.1038/s41467-019-10898-3 · Cited by 43
Ritelli, M., Cinquina, V., Giacopuzzi, E., Venturini, M., Chiarelli, N., & Colombi, M. (2019) · Genes · doi:10.3390/genes10090631 · Cited by 47
Stojanovic, J. R., Miletić, A., Peterlin, B., Maver, A., Mijovic, M., Borlja, N., Dimitrijevic, B., Soldatović, I., & Čuturilo, G. (2019) · Journal of Child Neurology · doi:10.1177/0883073819879835 · Cited by 42
ATAV: a comprehensive platform for population-scale genomic analyses
Ren, Z., Povysil, G., Hostyk, J. A., Cui, H., Bhardwaj, N., & Goldstein, D. B. (2021) · BMC Bioinformatics · doi:10.1186/s12859-021-04071-1 · Cited by 44
What’s Wrong in a Jump? Prediction and Validation of Splice Site Variants
Riolo, G., Cantara, S., & Ricci, C. (2021) · Methods and Protocols · doi:10.3390/mps4030062 · Cited by 45
Genomic trajectories of a near-extinction event in the Chatham Island black robin
von Seth, J., van der Valk, T., Lord, E., Sigeman, H., Olsen, R., Knapp, M., Kardailsky, O., Robertson, F., Hale, M. L., Houston, D., et al. (2022) · BMC Genomics · doi:10.1186/s12864-022-08963-1 · Cited by 45
Jiang, T. T., Li, F., & Wang, K. (2023) · The Innovation · doi:10.1016/j.xinn.2023.100487 · Cited by 47
Kawalia, A., Motameny, S., Wonczak, S., Thiele, H., Nieroda, L., Jabbari, K., Borowski, S., Sinha, V., Gunia, W., Lang, U., et al. (2015) · PLoS ONE · doi:10.1371/journal.pone.0126321 · Cited by 41
Impact of Receiving Secondary Results from Genomic Research: A 12‐Month Longitudinal Study
Wynn, J., Martinez, J., Bulafka, J., Duong, J., Zhang, Y., Chiuzan, C. C., Jain, P., Cremona, M. L., Jobanputra, V., Fyer, A. J., et al. (2017) · Journal of Genetic Counseling · doi:10.1007/s10897-017-0172-x · Cited by 41
Pseudogenes Provide Evolutionary Evidence for the Competitive Endogenous RNA Hypothesis
Glenfield, C., & McLysaght, A. (2018) · Molecular Biology and Evolution · doi:10.1093/molbev/msy183 · Cited by 42
Chan, D., Shao, X., Dumargne, M.-C., Aarabi, M., Simon, M.-M., Kwan, T., Bailey, J. L., Robaire, B., Kimmins, S., Gabriel, M. C. S., et al. (2019) · Environmental Health Perspectives · doi:10.1289/ehp4812 · Cited by 44
Zhang, C., Gao, Y., Ning, Z., Lü, Y., Zhang, X., Liu, J., Xie, B., Xue, Z., Wang, X., Yuan, K., et al. (2019) · Genome biology · doi:10.1186/s13059-019-1838-5 · Cited by 41
Mooney, J. A., Marsden, C. D., Yohannes, A., Wayne, R. K., & Lohmueller, K. E. (2022) · Molecular Biology and Evolution · doi:10.1093/molbev/msac277 · Cited by 44
Predicting regulatory variants with composite statistic
Li, M. J., Pan, Z., Liu, Z., Wu, J., Wang, P., Zhu, Y., Xu, F., Xia, Z., Sham, P. C., Kocher, J.-P. A., et al. (2016) · Bioinformatics · doi:10.1093/bioinformatics/btw288 · Cited by 40
Targeted next generation sequencing: the diagnostic value in early-onset epileptic encephalopathy
Gökben, S., Önay, H., Yılmaz, S., Atık, T., Serdaroğlu, G., Tekin, H. G., & Özkınay, F. (2016) · Acta Neurologica Belgica · doi:10.1007/s13760-016-0709-z · Cited by 42
Insufficient evidence for pathogenicity of SNCA His50Gln (H50Q) in Parkinson's disease
Blauwendraat, C., Kia, D. A., Pihlstrøm, L., Gan‐Or, Z., Lesage, S., Gibbs, J. R., Ding, J., Alcalay, R. N., Hassin‐Baer, S., Pittman, A. M., et al. (2017) · Neurobiology of Aging · doi:10.1016/j.neurobiolaging.2017.12.012 · Cited by 40
Targeted resequencing identifies genes with recurrent variation in cerebral palsy
van Eyk, C. L., Corbett, M. A., Frank, M. S. B., Webber, D. L., Newman, M., Berry, J. G., Harper, K., Haines, B. P., McMichael, G., Woenig, J. A., et al. (2019) · npj Genomic Medicine · doi:10.1038/s41525-019-0101-z · Cited by 42
Maia, C., Puig, N., Cedena, M., Goicoechea, I., Valdés‐Mas, R., Vázquez, I., Chillón, C., Aguirre‐Ruiz, P., Sarvide, S., Gracia-Aznárez, F. J., et al. (2020) · Blood · doi:10.1182/blood.2019003382 · Cited by 41
Evaluating the informativeness of deep learning annotations for human complex diseases
Dey, K. K., van de Geijn, B., Kim, S. S., Hormozdiari, F., Kelley, D. R., & Price, A. L. (2020) · Nature Communications · doi:10.1038/s41467-020-18515-4 · Cited by 42
Evidence for and localization of proposed causative variants in cattle and pig genomes
Johnsson, M., & Jungnickel, M. K. (2021) · Genetics Selection Evolution · doi:10.1186/s12711-021-00662-x · Cited by 43
Machine learning methods for prediction of cancer driver genes: a survey paper
de Andrades, R. S., & Recamonde‐Mendoza, M. (2022) · Briefings in Bioinformatics · doi:10.1093/bib/bbac062 · Cited by 41
Liu, Y., Yeung, W. S. B., Chiu, P. C. N., & Cao, D. (2022) · Frontiers in Genetics · doi:10.3389/fgene.2022.981005 · Cited by 44
Temporal dynamics of woolly mammoth genome erosion prior to extinction
Dehasque, M., Morales, H. E., Díez‐del‐Molino, D., Pečnerová, P., Chacón-Duque, J. C., Kanellidou, F., Muller, H., Plotnikov, V., Protopopov, A. V., Tikhonov, A., et al. (2024) · Cell · doi:10.1016/j.cell.2024.05.033 · Cited by 39
dbPSHP: a database of recent positive selection across human populations
Li, M. J., Wang, L. Y., Xia, Z., Wong, M. P., Sham, P. C., & Wang, J. (2013) · Nucleic Acids Research · doi:10.1093/nar/gkt1052 · Cited by 41
Abramovs, N., Brass, A., & Tassabehji, M. (2019) · Nature Genetics · doi:10.1038/s41588-019-0560-2 · Cited by 39
Dehcheshmeh, M. M., Moghbeli, S. M., Rahimirad, S., Alanazi, I. O., Shehri, Z. S. A., & Ebrahimie, E. (2021) · Cells · doi:10.3390/cells10020319 · Cited by 39
The 3D mutational constraint on amino acid sites in the human proteome
Li, B., Roden, D. M., & Capra, J. A. (2022) · Nature Communications · doi:10.1038/s41467-022-30936-x · Cited by 45
Ma, A., Zhou, J., Ali, H., Abbas, T., Ali, I., Zubair, M., Dil, S., Chen, J., Huang, X., Ma, H., et al. (2023) · JCI Insight · doi:10.1172/jci.insight.166869 · Cited by 39
Zotano, Á. G., Stricker, T. P., Formisano, L., Hutchinson, K. E., Stover, D. G., Lee, K., Schwarz, L. J., Giltnane, J. M., Estrada, M. V., Jansen, V. M., et al. (2018) · Clinical Cancer Research · doi:10.1158/1078-0432.ccr-17-2904 · Cited by 38
CDH23 Methylation Status and Presbycusis Risk in Elderly Women
Bouzid, A., Smeti, I., Chakroun, A., Loukil, S., Gibriel, A. A., Grati, M., Ghorbel, A., & Masmoudi, S. (2018) · Frontiers in Aging Neuroscience · doi:10.3389/fnagi.2018.00241 · Cited by 38
Functional characterization of 3D protein structures informed by human genetic diversity
Hicks, M. A., Bartha, I., di Iulio, J., Abagyan, R., Venter, J. C., & Telenti, A. (2019) · Proceedings of the National Academy of Sciences · doi:10.1073/pnas.1820813116 · Cited by 39
Osipova, E., Hecker, N., & Hiller, M. (2019) · GigaScience · doi:10.1093/gigascience/giz132 · Cited by 40
Haplotype structure in commercial maize breeding programs in relation to key founder lines
Coffman, S. M., Hufford, M. B., Andorf, C. M., & Lübberstedt, T. (2019) · Theoretical and Applied Genetics · doi:10.1007/s00122-019-03486-y · Cited by 38
LEAP: Using machine learning to support variant classification in a clinical setting
Lai, C., Zimmer, A. D., O'Connor, R., Kim, S., Chan, R., van den Akker, J., Zhou, A. Y., Topper, S., & Mishne, G. (2020) · Human Mutation · doi:10.1002/humu.24011 · Cited by 38
Hengel, H., Buchert, R., Sturm, M., Haack, T. B., Schelling, Y., Mahajnah, M. M., Sharkia, R. A., Azem, A., Balousha, G., Ghanem, Z., et al. (2020) · European Journal of Human Genetics · doi:10.1038/s41431-020-0609-9 · Cited by 38
Schrauwen, I., Liaqat, K., Schatteman, I., Bharadwaj, T., Nasır, A., Acharya, A., Ahmad, W., Camp, G. V., & Leal, S. M. (2020) · Genes · doi:10.3390/genes11060687 · Cited by 38
Akbari, A., Padidar, K., Salehi, N., Mashayekhi, M., Almadani, N., Gilani, M. A. S., Bashambou, A., McElreavey, K., & Totonchi, M. (2020) · Human Reproduction · doi:10.1093/humrep/deaa362 · Cited by 39
Wu, Y., Li, Y., Murtaza, G., Zhou, J., Jiao, Y., Gong, C., Hu, C., Han, Q., Zhang, H., Zhang, Y., et al. (2021) · Human Reproduction · doi:10.1093/humrep/deab185 · Cited by 42
Tuncay, İ. O., Parmalee, N. L., Khalil, R., Kaur, K. J., Kumar, A., Jimale, M., Howe, J., Goodspeed, K., Evans, P., Alzghoul, L., et al. (2022) · npj Genomic Medicine · doi:10.1038/s41525-022-00284-2 · Cited by 38
AlSaadi, M. M., Erzurumluoglu, A. M., Rodrı́guez, S., Guthrie, P. A. I., Gaunt, T. R., Omar, H. Z., Mubarak, M., Alharbi, K. K., Al‐Rikabi, A. C., & Day, I. N. M. (2014) · Human Mutation · doi:10.1002/humu.22698 · Cited by 38
VIPdb, a genetic variant impact predictor database
Hu, Z., Yu, C., Furutsuki, M., Andreoletti, G., Ly, M., Hoskins, R., Adhikari, A. N., & Brenner, S. E. (2019) · Human Mutation · doi:10.1002/humu.23858 · Cited by 37
Randomizing the human genome by engineering recombination between repeat elements
Koeppel, J., Ferreira, R., Vanderstichele, T., Riedmayr, L. M., Peets, E. M., Girling, G., Weller, J., Murat, P., Liberante, F. G., Ellis, T., et al. (2025) · Science · doi:10.1126/science.ado3979 · Cited by 40
Stiles, A. R., Ferdinandusse, S., Besse, A., Appadurai, V., Leydiker, K., Cambray-Forker, E. J., Bonnen, P. E., & Abdenur, J. E. (2015) · Molecular Genetics and Metabolism · doi:10.1016/j.ymgme.2015.05.008 · Cited by 37
Gillies, R., Bjorksten, A. R., du Sart, D., & Hockey, B. (2015) · Anaesthesia and Intensive Care · doi:10.1177/0310057x1504300204 · Cited by 37
Hartley, T., Balci, T. B., Rojas, S. K., Eaton, A. J., Canada, C., Dyment, D. A., & Boycott, K. M. (2018) · American Journal of Medical Genetics Part C Seminars in Medical Genetics · doi:10.1002/ajmg.c.31662 · Cited by 37
Robbins, S. M., Thimm, M. A., Valle, D. L., & Jelin, A. C. (2019) · Journal of Assisted Reproduction and Genetics · doi:10.1007/s10815-019-01499-6 · Cited by 38
Pandi, M., Koromina, M., Tsafaridis, I., Patsilinakos, S. P., Christoforou, E., van der Spek, P. J., & Patrinos, G. P. (2021) · Human Genomics · doi:10.1186/s40246-021-00352-1 · Cited by 37
Whole-exome sequencing identifies ADRA2A mutation in atypical familial partial lipodystrophy
Garg, A., Sankella, S., Xing, C., & Agarwal, A. (2016) · JCI Insight · doi:10.1172/jci.insight.86870 · Cited by 32
Thomas, C. P., Mansilla, M. A., Sompallae, R. R., Mason, S. O., Nishimura, C., Kimble, M., Campbell, C. A., Kwitek, A. E., Darbro, B. W., Stewart, Z. A., et al. (2016) · American Journal of Transplantation · doi:10.1111/ajt.13970 · Cited by 37
Morin, A., Kwan, T., Ge, B., Létourneau, L., Ban, M., Tandre, K., Caron, M., Sandling, J. K., Carlsson, J., Bourque, G., et al. (2016) · BMC Medical Genomics · doi:10.1186/s12920-016-0220-7 · Cited by 38
Tan, Q. K.-G., Cope, H., Spillmann, R. C., Stong, N., Jiang, Y.-H., McDonald, M. T., Rothman, J., Butler, M. W., Frush, D. P., Lachman, R. S., et al. (2018) · Molecular Case Studies · doi:10.1101/mcs.a003046 · Cited by 39
Forces driving transposable element load variation during Arabidopsis range expansion
Jiang, J., Xu, Y., Zhang, Z., Chen, J., Niu, X., Hou, X.-H., Li, X.-T., Wang, L., Zhang, Y. E., Ge, S., et al. (2023) · The Plant Cell · doi:10.1093/plcell/koad296 · Cited by 36
Critical assessment of missense variant effect predictors on disease-relevant variant data
Rastogi, R., Chung, R., Li, S., Li, C., Lee, K., Woo, J., Kim, D., Keum, C., Babbi, G., Martelli, P. L., et al. (2025) · Human Genetics · doi:10.1007/s00439-025-02732-2 · Cited by 39
Next Generation Sequencing Analysis in Early Onset Dementia Patients
Bonvicini, C., Initiative, A. D. N., Scassellati, C., Benussi, L., Maria, E. D., Maj, C., Ciani, M., Fostinelli, S., Mega, A., Bocchetta, M., et al. (2018) · Journal of Alzheimer s Disease · doi:10.3233/jad-180482 · Cited by 37
Rausell, A., Luo, Y., Lopez, M., Seeleuthner, Y., Rapaport, F., Favier, A., Stenson, P. D., Cooper, D. N., Patin, É., Casanova, J., et al. (2020) · Proceedings of the National Academy of Sciences · doi:10.1073/pnas.1917993117 · Cited by 42
The PDE-Opathies: Diverse Phenotypes Produced by a Functionally Related Multigene Family
Bolger, G. B. (2021) · Trends in Genetics · doi:10.1016/j.tig.2021.03.002 · Cited by 36
Zhou, Y., & Lauschke, V. M. (2021) · Clinical Pharmacology & Therapeutics · doi:10.1002/cpt.2289 · Cited by 36
Common Genetic Variants Contribute to Risk of Transposition of the Great Arteries
Škorić‐Milosavljević, D., Tadros, R., Bosada, F. M., Tessadori, F., van Weerd, J. H., Woudstra, O. I., Tjong, F. V. Y., Lahrouchi, N., Bajolle, F., Cordell, H. J., et al. (2021) · Circulation Research · doi:10.1161/circresaha.120.317107 · Cited by 36
Raimondi, D., Gazzo, A. M., Rooman, M. J., Lenaerts, T., & Vranken, W. (2016) · Bioinformatics · doi:10.1093/bioinformatics/btw094 · Cited by 36
Genome-Wide Association Study of Maternal and Inherited Loci for Conotruncal Heart Defects
Agopian, A. J., Mitchell, L. E., Glessner, J., Bhalla, A. D., Sewda, A., Hakonarson, H. H., & Goldmuntz, E. (2014) · PLoS ONE · doi:10.1371/journal.pone.0096057 · Cited by 35
Metadata
- Authors
- Davydov, E. V., Goode, D. L., Sirota, M., Cooper, G. M., Sidow, A., & Batzoglou, S.
- Affiliations
- Stanford University (US)
- Stanford Medicine (US)
- Howard Hughes Medical Institute (US)
- Corresponding author
- Sidow, Arend
- Venue
- PLoS Computational Biology
- Publisher
- Public Library of Science (PLoS)
- Published
- 2010-12-02
- Volume
- 6
- Issue
- 12
- Pages
- e1001025
- ISSN
- 1553-734X (ISSN-L)
- 1553-7358
- PMC
- PMC2996323
- OpenAlex
- W2038473742
- Cited by
- 1,757
- References
- 28
- Citations by year
- 2026: 105 · 2025: 116 · 2024: 128 · 2023: 134 · 2022: 142 · 2021: 174 · 2020: 156 · 2019: 164 · 2018: 134 · 2017: 107 · 2016: 118 · 2015: 100 · 2014: 69 · 2013: 71 · 2012: 25
- FWCI
- 14.08
- Type
- journal article
- Language
- en
- Open access
- gold
- doi.org
- Locations
- PLoS Computational Biology (publishedVersion, cc-by)
- PubMed Central (publishedVersion, cc-by)
- PubMed (publishedVersion)
- DOAJ (DOAJ: Directory of Open Access Journals) (submittedVersion, cc-by-sa)
- Figshare (submittedVersion, cc-by)
- Minerva Access (University of Melbourne) (submittedVersion, cc-by)
- Funders
- National Science Foundation (0347952)
- National Institutes of Health (LM007033)
- National Human Genome Research Institute
- U.S. National Library of Medicine (K22LM008261, LM007033, T15LM007033)
- Topics
- Life Sciences › Biochemistry, Genetics and Molecular Biology › Molecular Biology › Genomics and Phylogenetic Studies
- Life Sciences › Biochemistry, Genetics and Molecular Biology › Molecular Biology › Genomics and Chromatin Dynamics
- Life Sciences › Biochemistry, Genetics and Molecular Biology › Genetics › Chromosomal and Genetic Variations
- Keywords
- GERP, selective constraint, functional elements, human genome, sequence comparison, multiple sequence alignment, dynamic programming
- MeSH terms
- Algorithms, Animals, Humans, Mammals, Models, Genetic, Phylogeny, Software, User-Computer Interface, Genome, Human, Sequence Alignment, Sequence Analysis, DNA, Genomics
About these checks
Registry, retraction, Cites and statistics results are computed, not judged, with one exception: a printed reference that no index lists is read once by a model before it counts as a citation error. Claims are extracted by a model and kept only when their quote appears verbatim in the text; each cited source is then checked, with a model’s help, for whether it says what the claim relies on. Those verdicts can be wrong — read the claim’s quote and the cited source before relying on one.
Statistics and arithmetic are recomputed, not judged.
Confidence bands are shown only for fields calibrated on our annotated test set. None is calibrated yet, so no band is shown.
What counts as a claim ›How we measure confidence ›How we check this ›
Are you an author, or do you see a problem with this page? Request a review
