

The DOI matches its Crossref record; 39 of the 39 references it cites were found in a registry or an index.
AGEMAP: A Gene Expression Database for Aging in Mice
Open accessAbstract
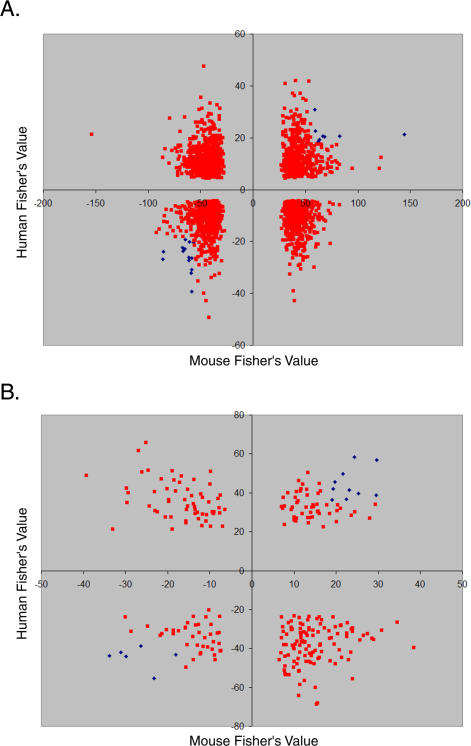
We present the AGEMAP (Atlas of Gene Expression in Mouse Aging Project) gene expression database, which is a resource that catalogs changes in gene expression as a function of age in mice. The AGEMAP database includes expression changes for 8,932 genes in 16 tissues as a function of age. We found great heterogeneity in the amount of transcriptional changes with age in different tissues. Some tissues displayed large transcriptional differences in old mice, suggesting that these tissues may contribute strongly to organismal decline. Other tissues showed few or no changes in expression with age, indicating strong levels of homeostasis throughout life. Based on the pattern of age-related transcriptional changes, we found that tissues could be classified into one of three aging processes: (1) a pattern common to neural tissues, (2) a pattern for vascular tissues, and (3) a pattern for steroid-responsive tissues. We observed that different tissues age in a coordinated fashion in individual mice, such that certain mice exhibit rapid aging, whereas others exhibit slow aging for multiple tissues. Finally, we compared the transcriptional profiles for aging in mice to those from humans, flies, and worms. We found that genes involved in the electron transport chain show common age regulation in all four species, indicating that these genes may be exceptionally good markers of aging. However, we saw no overall correlation of age regulation between mice and humans, suggesting that aging processes in mice and humans may be fundamentally different.
Overview
The claims and statistics of this paper haven’t been checked yet.
Run the check — free, no account needed. It reads the open-access text and checks the sources it cites.
Integrity signals
Registry
Cites
Statistics
Figures
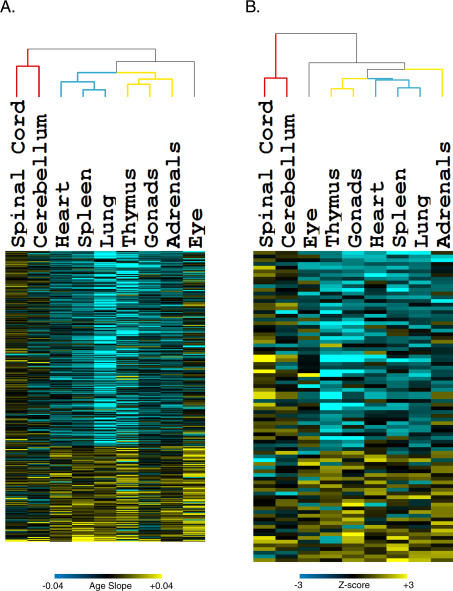
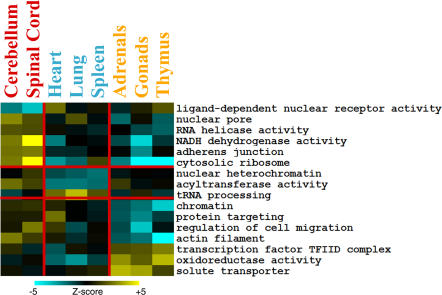
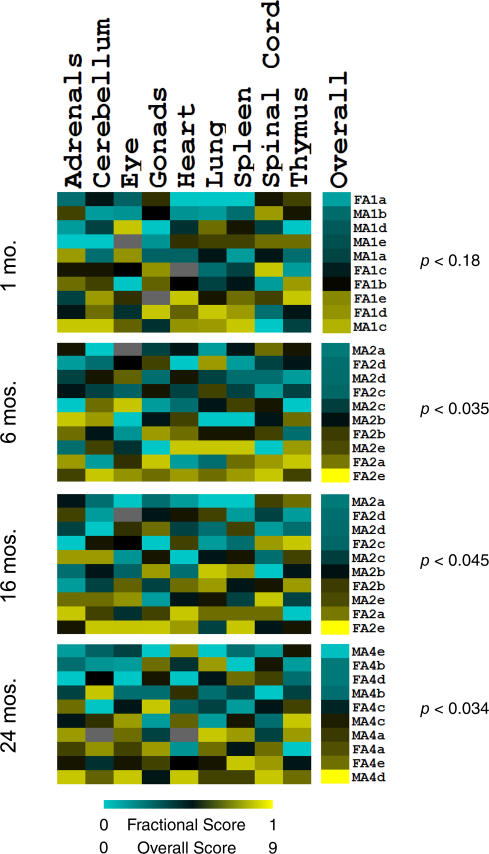
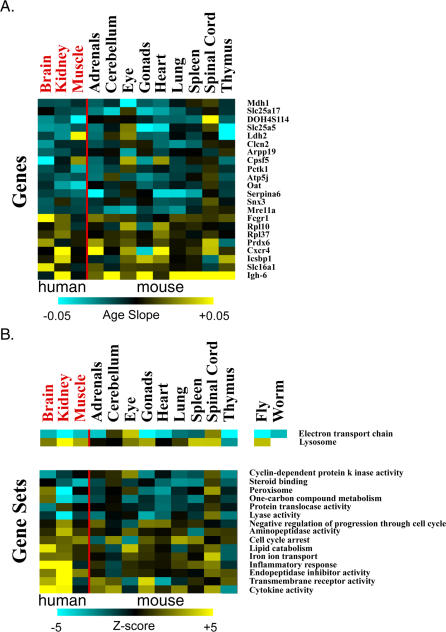
Verification
Claims the paper makes
The claims and statistics of this paper haven’t been checked yet.
Run the check — free, no account needed. It reads the open-access text and checks the sources it cites.
Claims other papers make about this one
Each is checked against this paper’s own text: does it say what the citing paper says it does?
The source backs part of the claim, not all of it — or backs it for a different population, condition or comparison.
In the citing paper
“Large mouse studies have observed that the transcriptomes of different organs and cell types have starkly different ageing trajectories41,42,156.”
From Measuring biological age using omics data (2022) · cites this paper as [156]
Experimental — accuracy not yet measuredIn the citing paper
“Genome-wide gene expression studies during ageing of the nematode Caenorhabditis elegans, the common fruitfly (Drosophila melanogaster) and the brains of mice, rats, chimpanzees and humans have revealed a few broadly conserved functional categories of genes with age-dependent expression changes (6,19) (Table 2 and Fig. 2).”
From Neural mechanisms of ageing and cognitive decline (2010) · cites this paper as [19]
In the citing paper
“In particular, most of these studies provide evidence of reduced mitochondrial function during ageing.”
From Neural mechanisms of ageing and cognitive decline (2010) · cites this paper as [19]
In the citing paper
“Gene expression studies suggest that reduced expression of mitochondrial genes is a strongly conserved feature of ageing in organisms ranging from C. elegans to humans (6,19).”
From Neural mechanisms of ageing and cognitive decline (2010) · cites this paper as [19]
In the citing paper
“Another universally conserved feature of ageing is increased expression of genes involved in stress-response pathways.”
From Neural mechanisms of ageing and cognitive decline (2010) · cites this paper as [19]
In the citing paper
“Indeed, gene expression has been shown to change drastically during aging (for example, Baumgart et al., 2014; Budovskaya et al., 2008; Zahn et al., 2007).”
From The Aging Epigenome (2016) · cites this paper as Zahn et al., 2007
In the citing paper
“Aging-associated expression changes in genes associated with mitochondrial function, protein metabolism, and immune response have been identified in several tissues (173) and are consistent with some proposed mechanisms for late-onset neurodegenerative diseases (98, 113, 124, 166).”
From Unraveling a Multifactorial Late-Onset Disease: From Genetic Susceptibility to Disease Mechanisms for Age-Related Macular Degeneration (2009) · cites this paper as [173]
In the citing paper
“As expected, this analysis verified previously identified top aging-related genes (such as Apod, B2m, C1qa, C4b, Ctss, Il33, Rpl8).”
From Single-cell transcriptomic profiling of the aging mouse brain (2019) · cites this paper as [5]
In the citing paper
“By aggregating all our sequenced single cells and performing DGE analysis comparable to prior bulk sequencing studies, we validated many of the previously identified aging-related genes 5,7,37 and extended the list to include numerous additional gene signatures.”
From Single-cell transcriptomic profiling of the aging mouse brain (2019) · cites this paper as [5]
Self-check
Percentages, sums and reported differences re-computed from the paper’s own numbers.
The self-check needs the paper’s full text.
Citations
Cites
Subramanian, A., Tamayo, P., Mootha, V. K., Mukherjee, S., Ebert, B. L., Gillette, M. A., Paulovich, A., Pomeroy, S. L., Golub, T. R., Lander, E. S., et al. (2005) · Proceedings of the National Academy of Sciences · doi:10.1073/pnas.0506580102 · Cited by 53,625
Gene Ontology: tool for the unification of biology
Ashburner, M., Ball, C. A., Blake, J. A., Botstein, D., Butler, H., Cherry, J. M., Davis, A. P., Dolinski, K., Dwight, S. S., Eppig, J. T., et al. (2000) · Nature Genetics · doi:10.1038/75556 · Cited by 43,206
Cluster analysis and display of genome-wide expression patterns
Eisen, M. B., Spellman, P. T., Brown, P. O., & Botstein, D. (1998) · Proceedings of the National Academy of Sciences · doi:10.1073/pnas.95.25.14863 · Cited by 16,184
Mootha, V. K., Lindgren, C. M., Eriksson, K.-F., Subramanian, A., Sihag, S., Lehar, J., Puigserver, P., Carlsson, E., Ridderstråle, M., Laurila, E., et al. (2003) · Nature Genetics · doi:10.1038/ng1180 · Cited by 10,197
Aging: a theory based on free radical and radiation chemistry
Harman, D. (1956) · Journal of Gerontology · doi:10.1093/geronj/11.3.298 · Cited by 8,567
Gene regulation and DNA damage in the ageing human brain
Lu, T., Pan, Y., Kao, S.-Y., Li, C., Kohane, I., Chan, J., & Yankner, B. A. (2004) · Nature · doi:10.1038/nature02661 · Cited by 1,874
Ink4a/Arf expression is a biomarker of aging
Krishnamurthy, J., Torrice, C., Ramsey, M. R., Kovalev, G. I., Al-Regaiey, K., Su, L., & Sharpless, N. E. (2004) · Journal of Clinical Investigation · doi:10.1172/jci22475 · Cited by 1,486
Gene expression profile of aging and its retardation by caloric restriction
Lee, C.-K., Klopp, R. G., Weindruch, R., & Prolla, T. A. (1999) · Science · doi:10.1126/science.285.5432.1390 · Cited by 1,473
Analysis of Microarray Data Using Z Score Transformation
Cheadle, C., Vawter, M. P., Freed, W. J., & Becker, K. G. (2003) · Journal of Molecular Diagnostics · doi:10.1016/s1525-1578(10)60455-2 · Cited by 1,150
Self-citationGene-expression profile of the ageing brain in mice
Lee, C.-K., Weindruch, R., & Prolla, T. A. (2000) · Nature Genetics · doi:10.1038/77046 · Cited by 1,055
Research works printed but not linked: 1
- XuXZhanMDuanWBrennemanRWoodWHIII 2007 Impact of age, energy intake, and sex on central nervous system regional transcriptomes. Genome Biology In press.
Cited by
Sorted by citations
Items 401–429 of 429
Howard, G. C. (2021) · Oxford University Press eBooks · doi:10.1093/oso/9780190687724.003.0003
Death in Bacteria, Fungi, and Protista
Howard, G. C. (2021) · Oxford University Press eBooks · doi:10.1093/oso/9780190687724.003.0011
Howard, G. C. (2021) · Oxford University Press eBooks · doi:10.1093/oso/9780190687724.003.0015
Howard, G. C. (2021) · Oxford University Press eBooks · doi:10.1093/oso/9780190687724.003.0012
Programmed Cell Death in Humans
Howard, G. C. (2021) · Oxford University Press eBooks · doi:10.1093/oso/9780190687724.003.0009
Howard, G. C. (2021) · Oxford University Press eBooks · doi:10.1093/oso/9780190687724.003.0013
Pagiatakis, C., Gornati, R., & Papait, R. (2023) · Elsevier eBooks · doi:10.1016/b978-0-12-823931-5.00004-9
Batalha, C. M. P. F., Fujita, A., & de Souza-Pinto, N. C. (2023) · bioRxiv (Cold Spring Harbor Laboratory) · doi:10.1101/2023.05.26.542445
Schneider, A. L., Saraiva-Agostinho, N., & Barbosa‐Morais, N. L. (2023) · eLife · doi:10.7554/elife.88623.1
Nakanishi, Y., Nozu, R., Ueno, M., Hioki, K., Ishii, C., Murakami, S., Suzuki, K. M., Ka, Y., Ogura, T., Ito, A., et al. (2023) · Research Square · doi:10.21203/rs.3.rs-3464296/v1
Schneider, A. L., Martins-Silva, R., Kaizeler, A., Saraiva-Agostinho, N., & Barbosa‐Morais, N. L. (2024) · eLife · doi:10.7554/elife.88623.2
Howard, G. C. (2021) · Oxford University Press eBooks · doi:10.1093/oso/9780190687724.002.0004
Howard, G. C. (2021) · Oxford University Press eBooks · doi:10.1093/oso/9780190687724.002.0003
Howard, G. C. (2021) · Oxford University Press eBooks · doi:10.1093/oso/9780190687724.002.0007
Howard, G. C. (2021) · Oxford University Press eBooks · doi:10.1093/oso/9780190687724.002.0006
Bell, M. (2021) · Oxford University Press eBooks · doi:10.1093/oso/9780190687724.002.0008
AgeMeta: QUANTITATIVE GENE EXPRESSION DATABASE OF MAMMALIAN AGING
Tikhonov, S., Batin, M., Gladyshev, V. N., Dmitriev, S. E., & Tyshkovskiy, A. (2024) · Biochemistry (Moscow) · doi:10.31857/s0320972524020099mhqeg
Saul, D., Batmaz, O. M., Raude, P., Leidig, V., Wang, X., & Kosinsky, R. L. (2025) · RNA technologies · doi:10.1007/978-3-031-91072-2_1
Mechanisms of Biological Aging with Special Reference to the Skeletal Muscle
Goto, S., & Radak, Z. O. (2025) · Advances in experimental medicine and biology · doi:10.1007/978-3-031-88361-3_13
Choukrallah, M.-A., Hoeng, J., Peitsch, M. C., & Florian, M. (2020) · Figshare · doi:10.6084/m9.figshare.12109497
Choukrallah, M.-A., Hoeng, J., Peitsch, M. C., & Florian, M. (2020) · Figshare · doi:10.6084/m9.figshare.12109503
Zhang, Y., Qian, W., Zhang, Y., Ma, Y., Qian, J., Li, J., Wei, X., Long, Y., & Wan, X. (2024) · Figshare · doi:10.6084/m9.figshare.25116073
Batalha, C. M. P. F., Fujita, A., & de Souza-Pinto, N. C. (2025) · Aging · doi:10.18632/aging.206347
Systems Biology of Aging: Opportunities for Parkinson’s Disease
Kriete, A. (2012) · Springer eBooks · doi:10.1007/978-1-4614-3411-5_3
Wang, X. (2012) · D-Scholarship@Pitt (University of Pittsburgh)
Genome instability : from genome content variations to gene expression plasticity
Goupil, A. (2021) · theses.fr (ABES) · doi:10.70675/73c5ad47z37c8z4114zaf3ez3ddd10007a35
Kondashevskaya, M. V., Алексанкина, В. В., Artemyeva, K. A., & Mikhaleva, L. M. (2026) · Doklady Biological Sciences · doi:10.1134/s001249662660017x
A systems-level approach to the evolution of ageing
Rashidi, A. (2011) · OpenGrey (Institut de l'Information Scientifique et Technique)
Metadata
- Authors
- Zahn, J. M., Poosala, S., Owen, A. B., Ingram, D. K., Lustig, A., Carter, A., Weeraratna, A. T., Taub, D. D., Gorospe, M., Mazan-Mamczarz, K., Lakatta, E. G., Boheler, K. R., Xu, X., Mattson, M. P., Falco, G., Ko, M. S. H., Schlessinger, D., Firman, J., Kummerfeld, S. K., Wood, W. H., Zonderman, A. B., Kim, S. K., & Becker, K. G.
- Affiliations
- Stanford Medicine (US)
- National Institutes of Health (US)
- Stanford University (US)
- Corresponding author
- Kim, Stuart K
- Becker, Kevin G
- ORCID
- Venue
- PLoS Genetics
- Publisher
- Public Library of Science (PLoS)
- Published
- 2007-11-30
- Volume
- 3
- Issue
- 11
- Pages
- e201
- ISSN
- 1553-7390 (ISSN-L)
- 1553-7404
- PMC
- PMC2098796
- OpenAlex
- W2069049877
- Cited by
- 431
- References
- 39
- Citations by year
- 2026: 3 · 2025: 14 · 2024: 18 · 2023: 23 · 2022: 16 · 2021: 44 · 2020: 22 · 2019: 18 · 2018: 20 · 2017: 26 · 2016: 27 · 2015: 33 · 2014: 14 · 2013: 29 · 2012: 43
- FWCI
- 5.17
- Type
- journal article
- Language
- en
- Open access
- gold
- doi.org
- Licence
- Locations
- PLoS Genetics (publishedVersion, public-domain)
- PubMed Central (publishedVersion, public-domain)
- PubMed (publishedVersion)
- RePEc: Research Papers in Economics (submittedVersion)
- DOAJ (DOAJ: Directory of Open Access Journals) (submittedVersion, cc-by-sa)
- eScholarship (California Digital Library) (submittedVersion)
- Figshare (submittedVersion, cc-by)
- The HKU Scholars Hub (University of Hong Kong) (submittedVersion)
- Funders
- National Science Foundation (0604939)
- Ellison Medical Foundation
- National Institutes of Health
- National Institute on Aging (R01AG025941)
- Topics
- Life Sciences › Biochemistry, Genetics and Molecular Biology › Aging › Genetics, Aging, and Longevity in Model Organisms
- Life Sciences › Biochemistry, Genetics and Molecular Biology › Molecular Biology › Single-cell and spatial transcriptomics
- Life Sciences › Biochemistry, Genetics and Molecular Biology › Molecular Biology › Gene expression and cancer classification
- Keywords
- gene expression database, mouse aging, age-related gene expression, tissue-specific aging, transcriptional heterogeneity, aging biomarkers
- MeSH terms
- Aging, Animals, Diptera, Gene Expression Regulation, Helminths, Humans, Organ Specificity, Species Specificity, Gene Expression Profiling, Databases, Genetic, Mice
About these checks
Registry, retraction, Cites and statistics results are computed, not judged, with one exception: a printed reference that no index lists is read once by a model before it counts as a citation error. Claims are extracted by a model and kept only when their quote appears verbatim in the text; each cited source is then checked, with a model’s help, for whether it says what the claim relies on. Those verdicts can be wrong — read the claim’s quote and the cited source before relying on one.
Statistics and arithmetic are recomputed, not judged.
Confidence bands are shown only for fields calibrated on our annotated test set. None is calibrated yet, so no band is shown.
What counts as a claim ›How we measure confidence ›How we check this ›
Are you an author, or do you see a problem with this page? Request a review
