Cited by 276Genetics and Neurodevelopmental DisordersNeurogenesis and neuroplasticity mechanismsAxon Guidance and Neuronal Signaling

The DOI matches its Crossref record; 70 of the 70 references it cites were found in a registry or an index.

Foxp2 Regulates Gene Networks Implicated in Neurite Outgrowth in the Developing Brain

Open access

Abstract

Forkhead-box protein P2 is a transcription factor that has been associated with intriguing aspects of cognitive function in humans, non-human mammals, and song-learning birds. Heterozygous mutations of the human FOXP2 gene cause a monogenic speech and language disorder. Reduced functional dosage of the mouse version (Foxp2) causes deficient cortico-striatal synaptic plasticity and impairs motor-skill learning. Moreover, the songbird orthologue appears critically important for vocal learning. Across diverse vertebrate species, this well-conserved transcription factor is highly expressed in the developing and adult central nervous system. Very little is known about the mechanisms regulated by Foxp2 during brain development. We used an integrated functional genomics strategy to robustly define Foxp2-dependent pathways, both direct and indirect targets, in the embryonic brain. Specifically, we performed genome-wide in vivo ChIP-chip screens for Foxp2-binding and thereby identified a set of 264 high-confidence neural targets under strict, empirically derived significance thresholds. The findings, coupled to expression profiling and in situ hybridization of brain tissue from wild-type and mutant mouse embryos, strongly highlighted gene networks linked to neurite development. We followed up our genomics data with functional experiments, showing that Foxp2 impacts on neurite outgrowth in primary neurons and in neuronal cell models. Our data indicate that Foxp2 modulates neuronal network formation, by directly and indirectly regulating mRNAs involved in the development and plasticity of neuronal connections.

Overview

The claims and statistics of this paper haven’t been checked yet.

Run the check — free, no account needed. It reads the open-access text and checks the sources it cites.

A few free checks a day · papers already verified open instantly · results are public

Integrity signals

Registry

Crossref · 10.1371/journal.pgen.1002145

Cites

70 of 70 references verified0 citation errors · 0 not checkable

Statistics

Figures

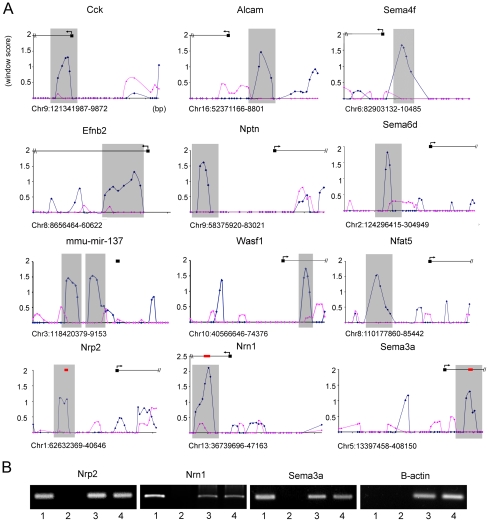
Figure 1 In vivo Foxp2 promoter occupancy in embryonic mouse brain. (A) Foxp2-ChIP window enrichment scores of probes across promoters of a subset of putative targets from the neurite outgrowth and axon guidance pathways. The window score (Y axis) is given versus the distance across the promoter region (X axis) - each cross bar represents 1000 bp and each data point represents a single probe (chromosome and position in bp are given below the X axis of each graph). The enrichment in the wild-type experiments is shown by the blue trace, and the pink trace indicates the corresponding values in null mutant controls that lack Foxp2 protein. The predicted start site of the gene (as annotated on UCSC genome browser: http://genome.ucsc.edu/) is given by the black box and arrows denote the direction of transcription. Grey shading indicates the peak area of enrichment and the most likely region for Foxp2 binding to occur. (B) Analysis of in vivo promoter occupancy. DNA isolated via Foxp2-ChIP was PCR amplified using primers directed towards the promoter regions of Nrp2, Sema3a, Nrn1 or the β-actin control. The position of these amplicons within the target promoter region is given by red bars in part A. Results from E16 wild type mice were compared to those from homozygous null mutant littermates. Lane 1 = wild-type Foxp2-ChIP, lane 2 = mutant null Foxp2-ChIP, lane 3 = wild-type total DNA, lane 4 = mutant total DNA. Target gene promoters were found to be specifically enriched in Foxp2-ChIP samples isolated from wild-type brains compared to those from null mutant brains, unlike the β-actin control promoter. Gels are representative of results from triplicate experiments.
Figure 1 In vivo Foxp2 promoter occupancy in embryonic mouse brain. (A) Foxp2-ChIP window enrichment scores of probes across promoters of a subset of putative targets from the neurite outgrowth and axon guidance pathways. The window score (Y axis) is given versus the distance across the promoter region (X axis) - each cross bar represents 1000 bp and each data point represents a single probe (chromosome and position in bp are given below the X axis of each graph). The enrichment in the wild-type experiments is shown by the blue trace, and the pink trace indicates the corresponding values in null mutant controls that lack Foxp2 protein. The predicted start site of the gene (as annotated on UCSC genome browser: http://genome.ucsc.edu/) is given by the black box and arrows denote the direction of transcription. Grey shading indicates the peak area of enrichment and the most likely region for Foxp2 binding to occur. (B) Analysis of in vivo promoter occupancy. DNA isolated via Foxp2-ChIP was PCR amplified using primers directed towards the promoter regions of Nrp2, Sema3a, Nrn1 or the β-actin control. The position of these amplicons within the target promoter region is given by red bars in part A. Results from E16 wild type mice were compared to those from homozygous null mutant littermates. Lane 1 = wild-type Foxp2-ChIP, lane 2 = mutant null Foxp2-ChIP, lane 3 = wild-type total DNA, lane 4 = mutant total DNA. Target gene promoters were found to be specifically enriched in Foxp2-ChIP samples isolated from wild-type brains compared to those from null mutant brains, unlike the β-actin control promoter. Gels are representative of results from triplicate experiments.CC BY · PubMed Central
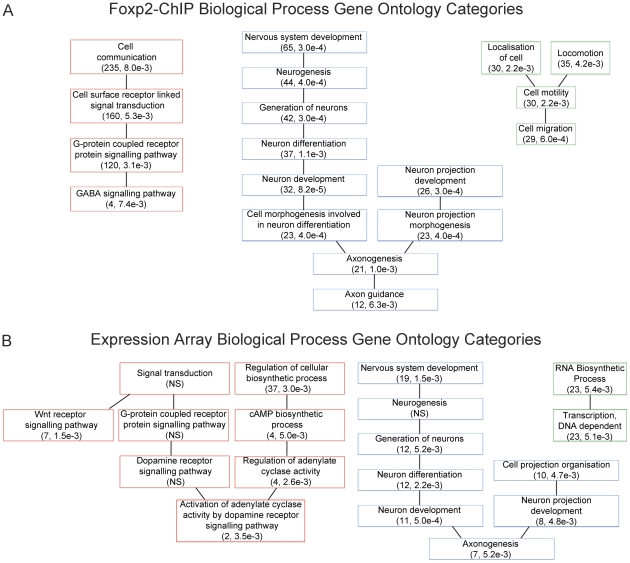
Figure 2 Gene Ontology categories suggest Foxp2 involvement in known functional pathways. (A) Gene ontology analysis of Foxp2-ChIP target gene list (see Table S2) and (B) Gene ontology analysis of genes differentially expressed between Foxp2-S321X and wild-type embryos (see Table S4). For each, a selection of biological process ontology categories are shown that were found to be significantly over-represented in the putative target gene lists, including neurogenesis, neuron projection development and axonogenesis (A–B), cell migration (A) and G-protein receptor signalling (B). The number of genes per category and p-values are shown in brackets.
Figure 2 Gene Ontology categories suggest Foxp2 involvement in known functional pathways. (A) Gene ontology analysis of Foxp2-ChIP target gene list (see Table S2) and (B) Gene ontology analysis of genes differentially expressed between Foxp2-S321X and wild-type embryos (see Table S4). For each, a selection of biological process ontology categories are shown that were found to be significantly over-represented in the putative target gene lists, including neurogenesis, neuron projection development and axonogenesis (A–B), cell migration (A) and G-protein receptor signalling (B). The number of genes per category and p-values are shown in brackets.CC BY · PubMed Central
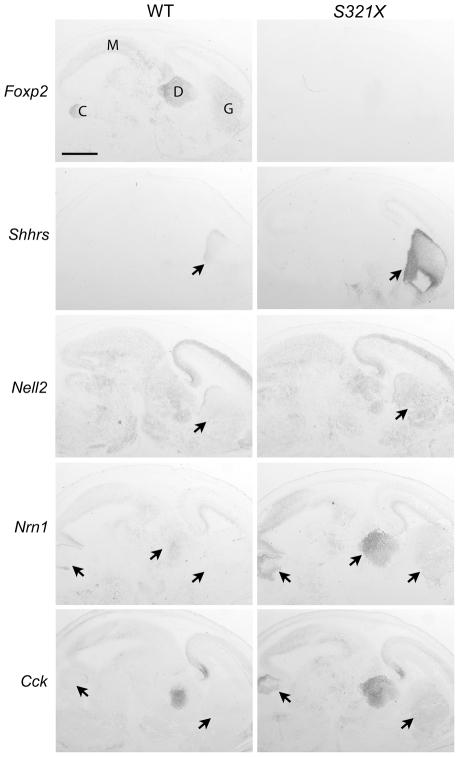
Figure 3 Foxp2 regulates putative target gene expression in the E16 mouse brain. In situ hybridisation of wild-type (WT) and Foxp2-S321X homozygous mutant brains at E16. Foxp2 is predominantly expressed in the ganglionic eminences (G), diencephalon (D), midbrain (M) and developing cerebellum (C) in WT mice. Figure displays results from selected transcripts that had shown increased levels in expression profiling of Foxp2 mutant mice. Nrn1, Nell2 and Cck were also identified from the ChIP screen. Arrows indicate equivalent regions from brains of both genotypes. In Foxp2 mutants, all target genes show increased expression in the ganglionic eminence, with additional increased expression of Nrn1 in the diencephalon and Nrn1 and Cck in the developing cerebellum. Scale bar is 1 mm. Results are representative of 3 mice of each genotype.
Figure 3 Foxp2 regulates putative target gene expression in the E16 mouse brain. In situ hybridisation of wild-type (WT) and Foxp2-S321X homozygous mutant brains at E16. Foxp2 is predominantly expressed in the ganglionic eminences (G), diencephalon (D), midbrain (M) and developing cerebellum (C) in WT mice. Figure displays results from selected transcripts that had shown increased levels in expression profiling of Foxp2 mutant mice. Nrn1, Nell2 and Cck were also identified from the ChIP screen. Arrows indicate equivalent regions from brains of both genotypes. In Foxp2 mutants, all target genes show increased expression in the ganglionic eminence, with additional increased expression of Nrn1 in the diencephalon and Nrn1 and Cck in the developing cerebellum. Scale bar is 1 mm. Results are representative of 3 mice of each genotype.CC BY · PubMed Central
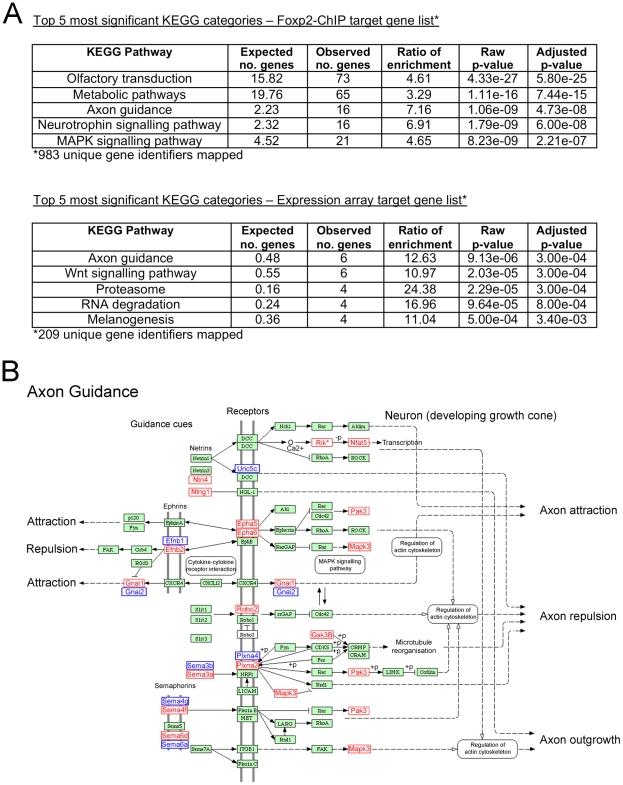
Figure 4 Neurite outgrowth and axon guidance pathways are major biological themes of Foxp2-dependent networks in embryonic brain. (A) The Foxp2 target gene datasets obtained via ChIP-chip (see Table S2) and expression profiling (see Table S4) were assessed separately for significantly over-represented KEGG pathways. (B) The axon guidance pathway displayed one of the most highly significant over-representations in the respective datasets (Foxp2-ChIP: p = 4.73×10⁻⁸ and expression profiling: p = 3.00×10⁻⁴). Genes that were present in this pathway from the Foxp2-ChIP target list (window score >0.974) are highlighted on the WebGestalt KEGG pathway in red, with those from expression analysis (p<0.01) highlighted in blue. None of the genes shown were common to both datasets. Expression profiling showed Efnb1 and Plxna4 to be upregulated in vivo in response to Foxp2; all other genes highlighted in blue were downregulated. Figure adapted from the WebGestalt program results (see Materials and Methods).
Figure 4 Neurite outgrowth and axon guidance pathways are major biological themes of Foxp2-dependent networks in embryonic brain. (A) The Foxp2 target gene datasets obtained via ChIP-chip (see Table S2) and expression profiling (see Table S4) were assessed separately for significantly over-represented KEGG pathways. (B) The axon guidance pathway displayed one of the most highly significant over-representations in the respective datasets (Foxp2-ChIP: p = 4.73×10⁻⁸ and expression profiling: p = 3.00×10⁻⁴). Genes that were present in this pathway from the Foxp2-ChIP target list (window score >0.974) are highlighted on the WebGestalt KEGG pathway in red, with those from expression analysis (p<0.01) highlighted in blue. None of the genes shown were common to both datasets. Expression profiling showed Efnb1 and Plxna4 to be upregulated in vivo in response to Foxp2; all other genes highlighted in blue were downregulated. Figure adapted from the WebGestalt program results (see Materials and Methods).CC BY · PubMed Central
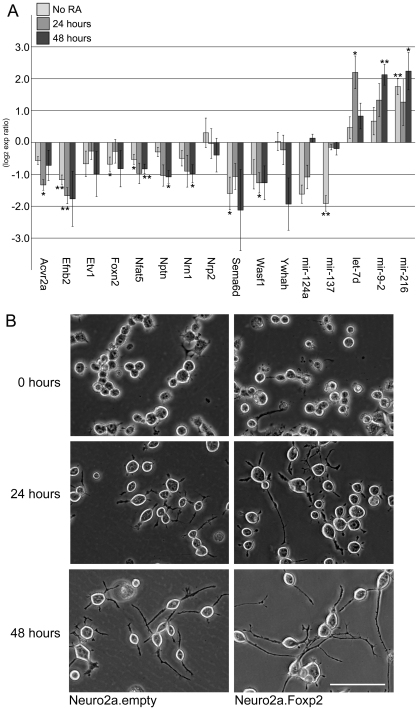
Figure 5 Foxp2 modulates neurite outgrowth in neuronal cell models. (A) Expression of target genes involved in neurite outgrowth and associated pathways. Quantitative PCR was performed for cDNA reverse-transcribed from stable Neuro2a cell-lines undergoing no differentiation or following 24 or 48 hours differentiation (via the addition of retinoic acid, RA). Expression changes are mean log2 expression ratios comparing three independent clones stably transfected with Foxp2 and three independent clones stably transfected with an empty vector, normalized for equal expression of the internal control, Gapdh, or U6 (for miRNAs). Error bars indicate the ± SEM, p-values were calculated using a two-tailed unpaired t-test (** = p<0.01, * = p<0.05). (B) Cells expressing Foxp2 demonstrate visible changes in neurite outgrowth. Neuro2a cells stably transfected with Foxp2 or an empty vector control were grown for 24 and 48 hours in differentiation media before images were captured directly under a light microscope. Pictures are representative of >15 images taken for three independent clones of each cell type (Scale bar, 100 µm).
Figure 5 Foxp2 modulates neurite outgrowth in neuronal cell models. (A) Expression of target genes involved in neurite outgrowth and associated pathways. Quantitative PCR was performed for cDNA reverse-transcribed from stable Neuro2a cell-lines undergoing no differentiation or following 24 or 48 hours differentiation (via the addition of retinoic acid, RA). Expression changes are mean log2 expression ratios comparing three independent clones stably transfected with Foxp2 and three independent clones stably transfected with an empty vector, normalized for equal expression of the internal control, Gapdh, or U6 (for miRNAs). Error bars indicate the ± SEM, p-values were calculated using a two-tailed unpaired t-test (** = p<0.01, * = p<0.05). (B) Cells expressing Foxp2 demonstrate visible changes in neurite outgrowth. Neuro2a cells stably transfected with Foxp2 or an empty vector control were grown for 24 and 48 hours in differentiation media before images were captured directly under a light microscope. Pictures are representative of >15 images taken for three independent clones of each cell type (Scale bar, 100 µm).CC BY · PubMed Central
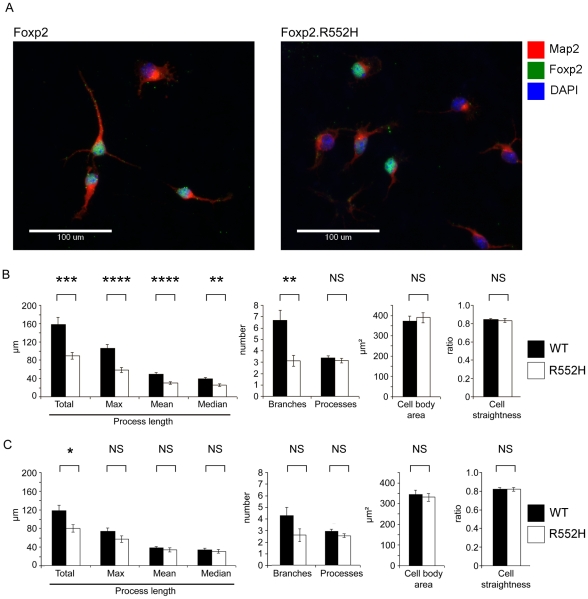
Figure 6 Foxp2 regulates neurite outgrowth in primary neurons. (A) Primary cells were harvested from the ganglionic eminences (developing striatum and pallidum) of wild-type and homozygous Foxp2-R552H E16 littermates and grown in culture for 4 days before fixation and staining for immunofluorescence. Map2 was detected using a TRITC-conjugated (red) antibody and Foxp2 via a FITC-conjugated (green) antibody. The R552H mutation produces a form of Foxp2 protein that appears to be largely non-functional in vitro and in vivo (see references [30] and [9], respectively), but is still detectable via immunofluorescence. DAPI counterstain (blue) indicates the location of nuclei. (Scale bar, 100 µm) (B–C) Quantification of properties of neurite outgrowths in primary culture. Neurites were quantified for all cells in each image and then the data were separated into Foxp2-positive and Foxp2-negative cells. These data represent the mean of 141 Foxp2-positive cells taken from wild-type embryos and 84 Foxp2-positive cells taken from R552H littermates (B) and the mean values of Foxp2-negative cells taken from the same wild-type embryos (142 cells) and the same homozygous R552H littermates (115 cells) (C). Cells were harvested from six wild-type and four Foxp2-R552H embryos, across two litters. All measures of process length as well as the number of branches per cell showed significant differences between wild-type (black bars) and Foxp2-R552H mutant (white bars) mice. However no significant contribution was observed for embryo for any measure except ‘Processes’ (p = 0.018), a measure that was not significant between genotypes. Error bars indicate the ± SEM and p-values were calculated using ANCOVA followed by post-hoc Sidak correction (**** = p<0.001, *** = p = 0.001, ** = p<0.01, * = p<0.05).
Figure 6 Foxp2 regulates neurite outgrowth in primary neurons. (A) Primary cells were harvested from the ganglionic eminences (developing striatum and pallidum) of wild-type and homozygous Foxp2-R552H E16 littermates and grown in culture for 4 days before fixation and staining for immunofluorescence. Map2 was detected using a TRITC-conjugated (red) antibody and Foxp2 via a FITC-conjugated (green) antibody. The R552H mutation produces a form of Foxp2 protein that appears to be largely non-functional in vitro and in vivo (see references [30] and [9], respectively), but is still detectable via immunofluorescence. DAPI counterstain (blue) indicates the location of nuclei. (Scale bar, 100 µm) (B–C) Quantification of properties of neurite outgrowths in primary culture. Neurites were quantified for all cells in each image and then the data were separated into Foxp2-positive and Foxp2-negative cells. These data represent the mean of 141 Foxp2-positive cells taken from wild-type embryos and 84 Foxp2-positive cells taken from R552H littermates (B) and the mean values of Foxp2-negative cells taken from the same wild-type embryos (142 cells) and the same homozygous R552H littermates (115 cells) (C). Cells were harvested from six wild-type and four Foxp2-R552H embryos, across two litters. All measures of process length as well as the number of branches per cell showed significant differences between wild-type (black bars) and Foxp2-R552H mutant (white bars) mice. However no significant contribution was observed for embryo for any measure except ‘Processes’ (p = 0.018), a measure that was not significant between genotypes. Error bars indicate the ± SEM and p-values were calculated using ANCOVA followed by post-hoc Sidak correction (**** = p<0.001, *** = p = 0.001, ** = p<0.01, * = p<0.05).CC BY · PubMed Central

Verification

Claims the paper makes

The claims and statistics of this paper haven’t been checked yet.

Run the check — free, no account needed. It reads the open-access text and checks the sources it cites.

A few free checks a day · papers already verified open instantly · results are public

Claims other papers make about this one

Each is checked against this paper’s own text: does it say what the citing paper says it does?

Self-check

Percentages, sums and reported differences re-computed from the paper’s own numbers.

The self-check needs the paper’s full text.

Citations

Cites

Show all 69 references

Cited by

Sorted by citations

See all 276

Metadata

Authors
Vernes, S. C., Oliver, P. L., Spiteri, E., Lockstone, H. E., Puliyadi, R., Taylor, J. M., Ho, J., Mombereau, C., Brewer, A., Lowy, E., Nicod, J., Groszer, M., Baban, D., Sahgal, N., Cazier, J.-B., Ragoussis, J., Davies, K. E., Geschwind, D. H., & Fisher, S. E.
Affiliations
  • Centre for Human Genetics (GB)
  • University of Oxford (GB)
  • University of California, Los Angeles (US)
  • Inserm (FR)
Corresponding author
Fisher, Simon E.
Venue
PLoS Genetics
Published
2011-07-07
Volume
7
Issue
7
Pages
e1002145
ISSN
  • 1553-7390 (ISSN-L)
  • 1553-7404
OpenAlex
W2010016215
Cited by
276
References
69
Citations by year
2026: 9 · 2025: 14 · 2024: 10 · 2023: 11 · 2022: 13 · 2021: 12 · 2020: 19 · 2019: 27 · 2018: 26 · 2017: 19 · 2016: 21 · 2015: 16 · 2014: 26 · 2013: 29 · 2012: 21
FWCI
15.76
Type
journal article
Language
en
Open access
Locations
  • PLoS Genetics (publishedVersion, cc-by)
  • PubMed Central (publishedVersion, cc-by)
  • PubMed (publishedVersion)
  • HAL (submittedVersion, other-oa)
  • DOAJ (DOAJ: Directory of Open Access Journals) (submittedVersion, cc-by-sa)
  • eScholarship (California Digital Library) (submittedVersion)
  • eScholarship (California Digital Library) (submittedVersion, cc-by)
  • Max Planck Digital Library (submittedVersion, other-oa)
  • Figshare (submittedVersion, cc-by)
  • University of Birmingham Research Portal (University of Birmingham) (submittedVersion, other-oa)
  • MPG.PuRe (Max Planck Society) (submittedVersion, other-oa)
Funders
  • Autism Speaks
  • Simons Foundation
  • Wellcome Trust (075491, 080971, 075491/Z/04,)
  • Simons Foundation Autism Research Initiative
  • Royal Society
  • Institut National de la Santé et de la Recherche Médicale
  • Max-Planck-Gesellschaft
  • National Institutes of Health (080971, 075491/Z/04)
  • Directorate for Biological Sciences
  • National Institute of Mental Health (R21MH075028, R37MH060233)
  • National Institute of General Medical Sciences (T32GM008243)
Topics
  • Life Sciences › Biochemistry, Genetics and Molecular Biology › Genetics › Genetics and Neurodevelopmental Disorders
  • Life Sciences › Neuroscience › Developmental Neuroscience › Neurogenesis and neuroplasticity mechanisms
  • Life Sciences › Neuroscience › Cellular and Molecular Neuroscience › Axon Guidance and Neuronal Signaling
Keywords
FOXP2, transcription factors, neurite outgrowth, embryonic brain development, gene regulatory networks, ChIP-chip, neuronal network formation, synaptic plasticity, speech and language disorders, corticostriatal synapses, motor skill learning, vocal learning
MeSH terms
Animals, Brain, Corpus Striatum, Mice, Inbred C57BL, Models, Biological, Mutation, Repressor Proteins, RNA, Messenger, Neurites, Gene Expression Regulation, Developmental, Oligonucleotide Array Sequence Analysis, Gene Expression Profiling, Cell Line, Tumor, Chromatin Immunoprecipitation, Mice, Forkhead Transcription Factors, Gene Regulatory Networks, Primary Cell Culture

About these checks

Registry, retraction, Cites and statistics results are computed, not judged, with one exception: a printed reference that no index lists is read once by a model before it counts as a citation error. Claims are extracted by a model and kept only when their quote appears verbatim in the text; each cited source is then checked, with a model’s help, for whether it says what the claim relies on. Those verdicts can be wrong — read the claim’s quote and the cited source before relying on one.

Statistics and arithmetic are recomputed, not judged.

Confidence bands are shown only for fields calibrated on our annotated test set. None is calibrated yet, so no band is shown.

What counts as a claim ›How we measure confidence ›How we check this ›

Are you an author, or do you see a problem with this page? Request a review