

The DOI matches its Crossref record; 46 of the 46 references it cites were found in a registry or an index.
Genomic Ancestry of North Africans Supports Back-to-Africa Migrations
Open accessAbstract
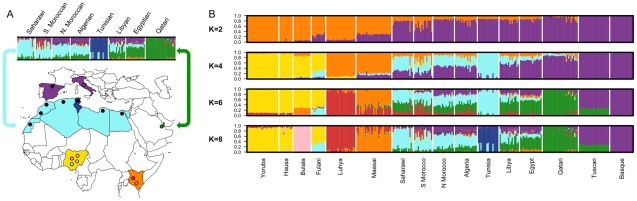
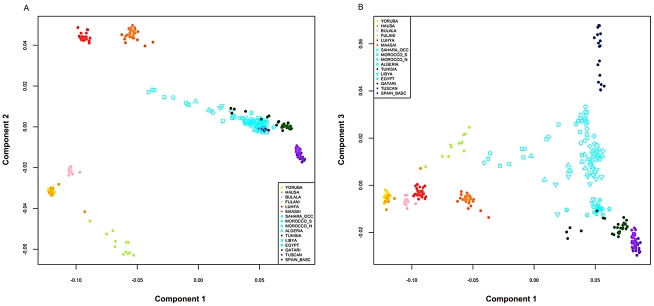
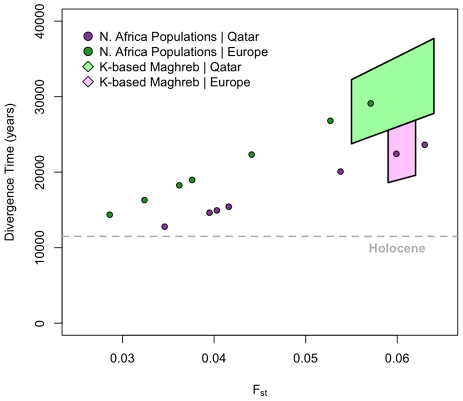
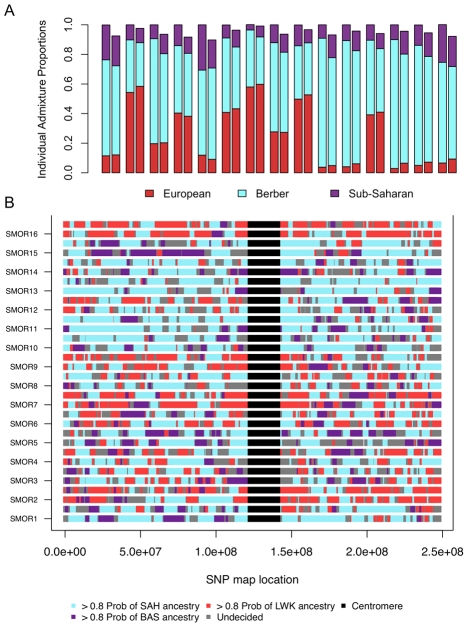
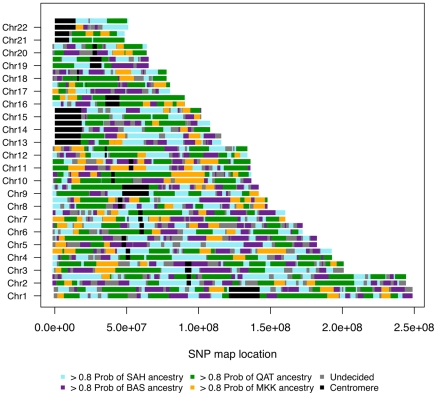
North African populations are distinct from sub-Saharan Africans based on cultural, linguistic, and phenotypic attributes; however, the time and the extent of genetic divergence between populations north and south of the Sahara remain poorly understood. Here, we interrogate the multilayered history of North Africa by characterizing the effect of hypothesized migrations from the Near East, Europe, and sub-Saharan Africa on current genetic diversity. We present dense, genome-wide SNP genotyping array data (730,000 sites) from seven North African populations, spanning from Egypt to Morocco, and one Spanish population. We identify a gradient of likely autochthonous Maghrebi ancestry that increases from east to west across northern Africa; this ancestry is likely derived from "back-to-Africa" gene flow more than 12,000 years ago (ya), prior to the Holocene. The indigenous North African ancestry is more frequent in populations with historical Berber ethnicity. In most North African populations we also see substantial shared ancestry with the Near East, and to a lesser extent sub-Saharan Africa and Europe. To estimate the time of migration from sub-Saharan populations into North Africa, we implement a maximum likelihood dating method based on the distribution of migrant tracts. In order to first identify migrant tracts, we assign local ancestry to haplotypes using a novel, principal component-based analysis of three ancestral populations. We estimate that a migration of western African origin into Morocco began about 40 generations ago (approximately 1,200 ya); a migration of individuals with Nilotic ancestry into Egypt occurred about 25 generations ago (approximately 750 ya). Our genomic data reveal an extraordinarily complex history of migrations, involving at least five ancestral populations, into North Africa.
Overview
The claims and statistics of this paper haven’t been checked yet.
Run the check — free, no account needed. It reads the open-access text and checks the sources it cites.
Integrity signals
Registry
Cites
Statistics
Figures
Verification
Claims the paper makes
The claims and statistics of this paper haven’t been checked yet.
Run the check — free, no account needed. It reads the open-access text and checks the sources it cites.
Claims other papers make about this one
Each is checked against this paper’s own text: does it say what the citing paper says it does?
The cited source says what the claim attributes to it.
In the citing paper
“We then used ALDER40 to estimate the time of a putative pulse-like admixture event, which was estimated to have occurred 24 generations ago (700 years ago), consistent with previous results from Henn and colleagues16.”
From Ancient Egyptian mummy genomes suggest an increase of Sub-Saharan African ancestry in post-Roman periods (2017) · cites this paper as [16]
The cited source says what the claim attributes to it.
In the citing paper
“By comparing ancient individuals from Abusir el-Meleq with modern Egyptian reference populations, we found an influx of sub-Saharan African ancestry after the Roman Period, which corroborates the findings by Henn and colleagues16.”
From Ancient Egyptian mummy genomes suggest an increase of Sub-Saharan African ancestry in post-Roman periods (2017) · cites this paper as [16]
Self-check
Percentages, sums and reported differences re-computed from the paper’s own numbers.
The self-check needs the paper’s full text.
Citations
Cites
PLINK: a tool set for whole-genome association and population-based linkage analyses.
Purcell, S., Neale, B., Todd-Brown, K., Thomas, L., Ferreira, M. A. R., Bender, D., Maller, J., Sklar, P., de Bakker, P. I. W., Daly, M. J., et al. (2007) · The American Journal of Human Genetics · doi:10.1086/519795 · Cited by 34,089
Fast model-based estimation of ancestry in unrelated individuals
Alexander, D. H., Novembre, J., & Lange, K. (2009) · Genome Research · doi:10.1101/gr.094052.109 · Cited by 9,898
Browning, S. R., & Browning, B. L. (2007) · The American Journal of Human Genetics · doi:10.1086/521987 · Cited by 3,217
Integrating common and rare genetic variation in diverse human populations
The International HapMap 3 Consortium (2010) · Nature · doi:10.1038/nature09298 · Cited by 3,026
Worldwide Human Relationships Inferred from Genome-Wide Patterns of Variation
Li, J. Z., Absher, D. M., Tang, H., Southwick, A. M., Casto, A. M., Ramachandran, S., Cann, H. M., Barsh, G. S., Feldman, M. W., Cavalli-Sforza, L. L., et al. (2008) · Science · doi:10.1126/science.1153717 · Cited by 1,915
Genetics in geographically structured populations: defining, estimating and interpreting FST
Holsinger, K. E., & Weir, B. S. (2009) · Nature Reviews Genetics · doi:10.1038/nrg2611 · Cited by 1,480
A worldwide survey of haplotype variation and linkage disequilibrium in the human genome
Conrad, D. F., Jakobsson, M., Coop, G., Wen, X., Wall, J. D., Rosenberg, N. A., & Pritchard, J. K. (2006) · Nature Genetics · doi:10.1038/ng1911 · Cited by 546
Sensitive detection of chromosomal segments of distinct ancestry in admixed populations
Price, A. L., Tandon, A., Patterson, N., Barnes, K. C., Rafaels, N., Ruczinski, I., Beaty, T. H., Mathias, R., Reich, D., & Myers, S. (2009) · PLoS Genetics · doi:10.1371/journal.pgen.1000519 · Cited by 539
Hunter-gatherer genomic diversity suggests a southern African origin for modern humans
Henn, B. M., Gignoux, C. R., Jobin, M., Granka, J. M., Macpherson, J. M., Kidd, J. M., Rodríguez-Botigué, L., Ramachandran, S., Hon, L., Brisbin, A., et al. (2011) · Proceedings of the National Academy of Sciences · doi:10.1073/pnas.1017511108 · Cited by 502
Self-citationGenome-wide patterns of population structure and admixture in West Africans and African Americans
Bryc, K., Auton, A., Nelson, M. R., Oksenberg, J. R., Hauser, S. L., Williams, S., Froment, A., Bodo, J.-M., Wambebe, C., Tishkoff, S. A., et al. (2010) · Proceedings of the National Academy of Sciences · doi:10.1073/pnas.0909559107 · Cited by 455
Self-citation
Cited by
Sorted by citations
Inference of population splits and mixtures from genome-wide allele frequency data
Pickrell, J. K., & Pritchard, J. K. (2012) · PLoS Genetics · doi:10.1371/journal.pgen.1002967 · Cited by 2,731
Genomic insights into the origin of farming in the ancient Near East
Lazaridis, I., Nadel, D., Rollefson, G., Merrett, D. C., Rohland, N., Mallick, S., Fernandes, D., Novak, M., Gamarra, B., Sirak, K., et al. (2016) · Nature · doi:10.1038/nature19310 · Cited by 955
Self-citationA genetic atlas of human admixture history
Hellenthal, G., Busby, G. B. J., Band, G., Wilson, J. F., Capelli, C., Falush, D., & Myers, S. (2014) · Science · doi:10.1126/science.1243518 · Cited by 798
Evaluating the Use of ABBA–BABA Statistics to Locate Introgressed Loci
Martin, S. H., Davey, J. W., & Jiggins, C. D. (2014) · Molecular Biology and Evolution · doi:10.1093/molbev/msu269 · Cited by 740
Did Our Species Evolve in Subdivided Populations across Africa, and Why Does It Matter?
Scerri, E. M. L., Thomas, M., Manica, A., Gunz, P., Stock, J. T., Stringer, C. B., Grove, M. L., Groucutt, H. S., Timmermann, A., Rightmire, G. P., et al. (2018) · Trends in Ecology & Evolution · doi:10.1016/j.tree.2018.05.005 · Cited by 514
Self-citation
Metadata
- Authors
- Henn, B. M., Botigué, L. R., Gravel, S., Wang, W., Brisbin, A., Byrnes, J. K., Fadhlaoui-Zid, K., Zalloua, P. A., Moreno-Estrada, A., Bertranpetit, J., Bustamante, C. D., & Comas, D.
- Affiliations
- Stanford University (US)
- Consejo Superior de Investigaciones Científicas (ES)
- Cornell University (US)
- Lebanese American University (LB)
- Corresponding author
- Bustamante, Carlos D.
- Comas, David
- ORCID
- Venue
- PLoS Genetics
- Publisher
- Public Library of Science (PLoS)
- Published
- 2012-01-12
- Volume
- 8
- Issue
- 1
- Pages
- e1002397
- ISSN
- 1553-7390 (ISSN-L)
- 1553-7404
- PMC
- PMC3257290
- OpenAlex
- W2059277852
- Cited by
- 331
- References
- 46
- Citations by year
- 2026: 11 · 2025: 25 · 2024: 16 · 2023: 26 · 2022: 11 · 2021: 29 · 2020: 16 · 2019: 28 · 2018: 29 · 2017: 27 · 2016: 29 · 2015: 22 · 2014: 26 · 2013: 23 · 2012: 13
- FWCI
- 16.19
- Type
- journal article
- Language
- en
- Open access
- gold
- doi.org
- Locations
- PLoS Genetics (publishedVersion, cc-by)
- Europe PMC (PubMed Central) (publishedVersion, cc-by)
- PubMed Central (publishedVersion, cc-by)
- PubMed (publishedVersion)
- RECERCAT (Consorci de Serveis Universitaris de Catalunya) (publishedVersion, other-oa)
- eScholarship (California Digital Library) (submittedVersion, cc-by)
- DIGITAL.CSIC (Spanish National Research Council (CSIC)) (submittedVersion)
- DOAJ (DOAJ: Directory of Open Access Journals) (submittedVersion, cc-by-sa)
- eScholarship (California Digital Library) (submittedVersion)
- Figshare (submittedVersion, cc-by)
- Repositori digital de la UPF (Universitat Pompeu Fabra) (submittedVersion, other-oa)
- Greater South Information System
- Funders
- Generalitat de Catalunya (2009SGR1101)
- National Institutes of Health
- National Human Genome Research Institute (R01HG003229)
- National Institute of General Medical Sciences (R01GM083606)
- Topics
- Life Sciences › Biochemistry, Genetics and Molecular Biology › Genetics › Forensic and Genetic Research
- Life Sciences › Biochemistry, Genetics and Molecular Biology › Genetics › Genetic diversity and population structure
- Social Sciences › Anthropology › Race, Genetics, and Society
- Keywords
- Berber populations, migration timing, local ancestry, Morocco
- MeSH terms
- Egypt, Ancient, Africa, Northern, DNA, Mitochondrial, Emigration and Immigration, Europe, Gene Pool, Genotype, Haplotypes, Humans, Middle East, Morocco, Population, Population Dynamics, Genetic Variation, Africa South of the Sahara, Polymorphism, Single Nucleotide, Genomics, Black People, White People, History, Ancient, Gene Flow
About these checks
Registry, retraction, Cites and statistics results are computed, not judged, with one exception: a printed reference that no index lists is read once by a model before it counts as a citation error. Claims are extracted by a model and kept only when their quote appears verbatim in the text; each cited source is then checked, with a model’s help, for whether it says what the claim relies on. Those verdicts can be wrong — read the claim’s quote and the cited source before relying on one.
Statistics and arithmetic are recomputed, not judged.
Confidence bands are shown only for fields calibrated on our annotated test set. None is calibrated yet, so no band is shown.
What counts as a claim ›How we measure confidence ›How we check this ›
Are you an author, or do you see a problem with this page? Request a review
