Cited by 125RNA Research and SplicingGenetics and Neurodevelopmental DisordersNeuroscience and Neuropharmacology Research

The DOI matches its Crossref record; 77 of the 78 references it cites were found in a registry or an index.

CELF4 Regulates Translation and Local Abundance of a Vast Set of mRNAs, Including Genes Associated with Regulation of Synaptic Function

Open access

Abstract

RNA-binding proteins have emerged as causal agents of complex neurological diseases. Mice deficient for neuronal RNA-binding protein CELF4 have a complex neurological disorder with epilepsy as a prominent feature. Human CELF4 has recently been associated with clinical features similar to those seen in mutant mice. CELF4 is expressed primarily in excitatory neurons, including large pyramidal cells of the cerebral cortex and hippocampus, and it regulates excitatory but not inhibitory neurotransmission. We examined mechanisms underlying neuronal hyperexcitability in Celf4 mutants by identifying CELF4 target mRNAs and assessing their fate in the absence of CELF4 in view of their known functions. CELF4 binds to at least 15%-20% of the transcriptome, with striking specificity for the mRNA 3' untranslated region. CELF4 mRNA targets encode a variety of proteins, many of which are well established in neuron development and function. While the overall abundance of these mRNA targets is often dysregulated in Celf4 deficient mice, the actual expression changes are modest at the steady-state level. In contrast, by examining the transcriptome of polysome fractions and the mRNA distribution along the neuronal cell body-neuropil axis, we found that CELF4 is critical for maintaining mRNA stability and availability for translation. Among biological processes associated with CELF4 targets that accumulate in neuropil of mutants, regulation of synaptic plasticity and transmission are the most prominent. Together with a related study of the impact of CELF4 loss on sodium channel Na(v)1.6 function, we suggest that CELF4 deficiency leads to abnormal neuronal function by combining a specific effect on neuronal excitation with a general impairment of synaptic transmission. These results also expand our understanding of the vital roles RNA-binding proteins play in regulating and shaping the activity of neural circuits.

Overview

The claims and statistics of this paper haven’t been checked yet.

Run the check — free, no account needed. It reads the open-access text and checks the sources it cites.

A few free checks a day · papers already verified open instantly · results are public

Integrity signals

Registry

Crossref · 10.1371/journal.pgen.1003067

Cites

77 of 77 references verified0 citation errors · 0 not checkable

Statistics

Figures

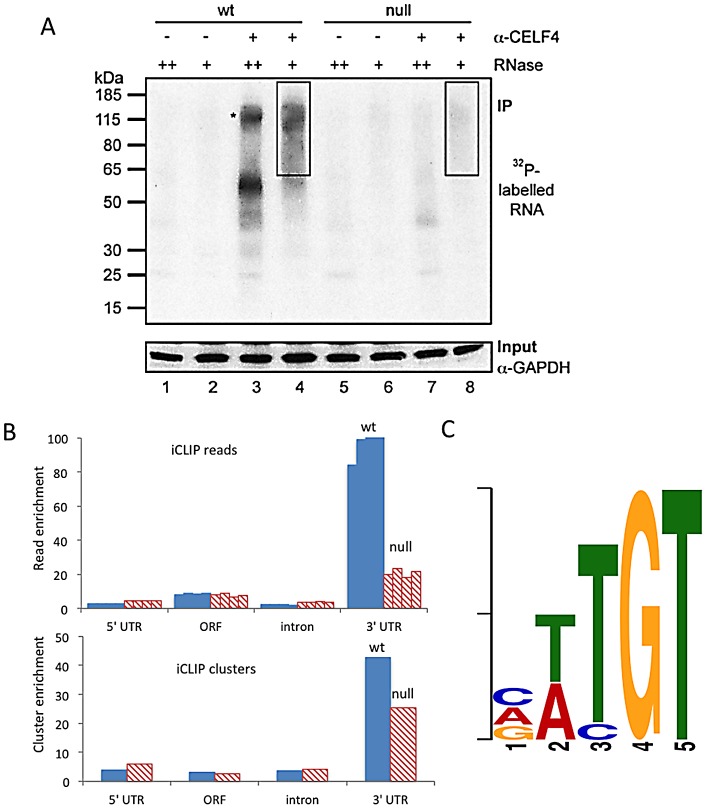
Figure 1 CELF4 binds mRNAs mostly in the 3′ UTR and favors an (A/U)UGU binding motif. A. Rigorous purification of CELF4-bound RNAs with iCLIP. The autoradiogram shows size-separated crosslinked protein-RNA complexes following complete digestion with high (++) or partial digestion with low (+) amounts of RNase I, immunopurification with an anti-CELF4 antibody and 5′ end radiolabeling. The boxes depict the areas on the nitrocellulose membrane from which crosslinked RNAs were purified for reverse transcription. The asterisk marks dimerized CELF4. B. Gene segment analysis showing 3′ UTR enrichment of CELF4 binding. For enrichment, the percentage of reads (upper panel) or clusters (lower panel) mapping to a particular gene segment is divided by the percentage of the genome encoding this type of segment. For read enrichment, individual replicates are shown, and for cluster enrichment, the wildtype and knockdown experiments were grouped. C. The most significant CELF4 regulatory motif discovered by comparison of significant crosslink clusters determined by CELF4 iCLIP from wildtype or Celf4 null brain. The e-value of the top motif, as determined by DREME software, was 4.7×10−338.
Figure 1 CELF4 binds mRNAs mostly in the 3′ UTR and favors an (A/U)UGU binding motif. A. Rigorous purification of CELF4-bound RNAs with iCLIP. The autoradiogram shows size-separated crosslinked protein-RNA complexes following complete digestion with high (++) or partial digestion with low (+) amounts of RNase I, immunopurification with an anti-CELF4 antibody and 5′ end radiolabeling. The boxes depict the areas on the nitrocellulose membrane from which crosslinked RNAs were purified for reverse transcription. The asterisk marks dimerized CELF4. B. Gene segment analysis showing 3′ UTR enrichment of CELF4 binding. For enrichment, the percentage of reads (upper panel) or clusters (lower panel) mapping to a particular gene segment is divided by the percentage of the genome encoding this type of segment. For read enrichment, individual replicates are shown, and for cluster enrichment, the wildtype and knockdown experiments were grouped. C. The most significant CELF4 regulatory motif discovered by comparison of significant crosslink clusters determined by CELF4 iCLIP from wildtype or Celf4 null brain. The e-value of the top motif, as determined by DREME software, was 4.7×10−338.CC BY · PubMed Central
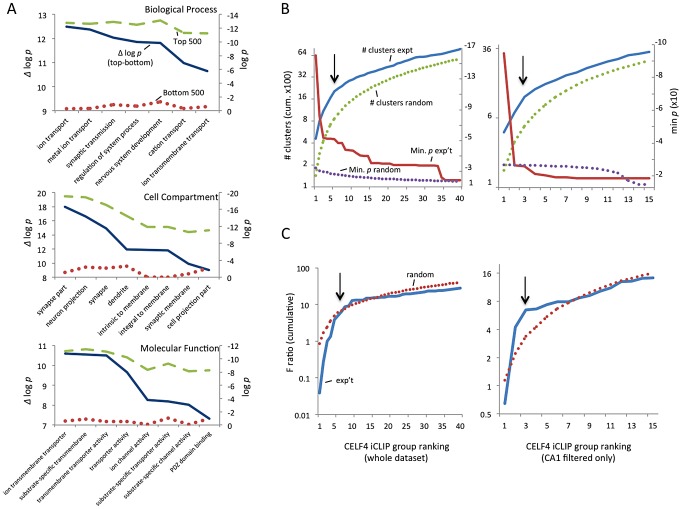
Figure 2 Functional annotation clustering of CELF4 mRNA targets and estimating CELF4 target binding threshold. A. Charts in this panel summarize gene ontology (GO) functional annotation clustering by “Biological Process” (top), “Cellular Compartment” (middle) and “Molecular Function” classes (bottom) for the top 500 ranked CELF4 targets (log p value - dashed line, green), vs. the bottom 500 ranked CELF4 targets (log p value - stippled line, red), and the difference between them (Δ log p - solid line, blue). For each class, the most significant log p categories are shown for either group, with no omissions. This panel illustrates how the highest-ranking CELF4 targets show strong enrichment for being associated with neurons and neuronal and synaptic functions. The VLAD tool at the Jackson Laboratory Mouse Genome Informatics website was used for this analysis (http://proto.informatics.jax.org/prototypes/vlad). The complete list of gene queries and analyses can be found in File S3. B. Enriched functional annotation clustering was exploited to approximate the threshold of significant CELF4 binding to targets based on iCLIP data. The left panel represents all 14,288 gene annotations chosen for further analysis, and the right panel a subset of 3,222 genes after filtering the larger set using a list of genes reported to represent the rodent hippocampal CA1 pyramidal neuron transcriptome [48]. For these estimates, iCLIP data were split serially by rank into 40 groups (357 genes each) for all annotations, or 15 groups (204 genes each) for the CA1 subset, each group was fed into the DAVID (v6.7) set of functional annotation tools (http://david.abcc.ncifcrf.gov) and functional annotation charts were obtained for each using the same default settings for each group. The maximum number of clusters (# clusters, exp't - solid line, blue) and minimum p value (Min p - dashed line, red) for any functional category clustered by that group was recorded and plotted cumulatively on the Y axis against each group on the X axis. As a control, the iCLIP ranking was permuted 100 times and each group fed into DAVID 6.7 and the average cluster number (# clusters, random - stippled line, green) and minimum p value (Min p, random - stippled line, purple) were similarly plotted. C. Similar to panel B, except using steady-state mRNA expression differences between Celf4 null and wildtype brain as the indicator (F ratio – cumulative), as described in the text. For panels B and C, the black arrows indicate inflections where the correlation between iCLIP rank and enrichment (functional clustering, or change in steady-state gene expression, respectively) begin to decrease, noting the approximate binding threshold which is similar for both measures. The gene lists used in each can be found in File S3.
Figure 2 Functional annotation clustering of CELF4 mRNA targets and estimating CELF4 target binding threshold. A. Charts in this panel summarize gene ontology (GO) functional annotation clustering by “Biological Process” (top), “Cellular Compartment” (middle) and “Molecular Function” classes (bottom) for the top 500 ranked CELF4 targets (log p value - dashed line, green), vs. the bottom 500 ranked CELF4 targets (log p value - stippled line, red), and the difference between them (Δ log p - solid line, blue). For each class, the most significant log p categories are shown for either group, with no omissions. This panel illustrates how the highest-ranking CELF4 targets show strong enrichment for being associated with neurons and neuronal and synaptic functions. The VLAD tool at the Jackson Laboratory Mouse Genome Informatics website was used for this analysis (http://proto.informatics.jax.org/prototypes/vlad). The complete list of gene queries and analyses can be found in File S3. B. Enriched functional annotation clustering was exploited to approximate the threshold of significant CELF4 binding to targets based on iCLIP data. The left panel represents all 14,288 gene annotations chosen for further analysis, and the right panel a subset of 3,222 genes after filtering the larger set using a list of genes reported to represent the rodent hippocampal CA1 pyramidal neuron transcriptome [48]. For these estimates, iCLIP data were split serially by rank into 40 groups (357 genes each) for all annotations, or 15 groups (204 genes each) for the CA1 subset, each group was fed into the DAVID (v6.7) set of functional annotation tools (http://david.abcc.ncifcrf.gov) and functional annotation charts were obtained for each using the same default settings for each group. The maximum number of clusters (# clusters, exp't - solid line, blue) and minimum p value (Min p - dashed line, red) for any functional category clustered by that group was recorded and plotted cumulatively on the Y axis against each group on the X axis. As a control, the iCLIP ranking was permuted 100 times and each group fed into DAVID 6.7 and the average cluster number (# clusters, random - stippled line, green) and minimum p value (Min p, random - stippled line, purple) were similarly plotted. C. Similar to panel B, except using steady-state mRNA expression differences between Celf4 null and wildtype brain as the indicator (F ratio – cumulative), as described in the text. For panels B and C, the black arrows indicate inflections where the correlation between iCLIP rank and enrichment (functional clustering, or change in steady-state gene expression, respectively) begin to decrease, noting the approximate binding threshold which is similar for both measures. The gene lists used in each can be found in File S3.CC BY · PubMed Central
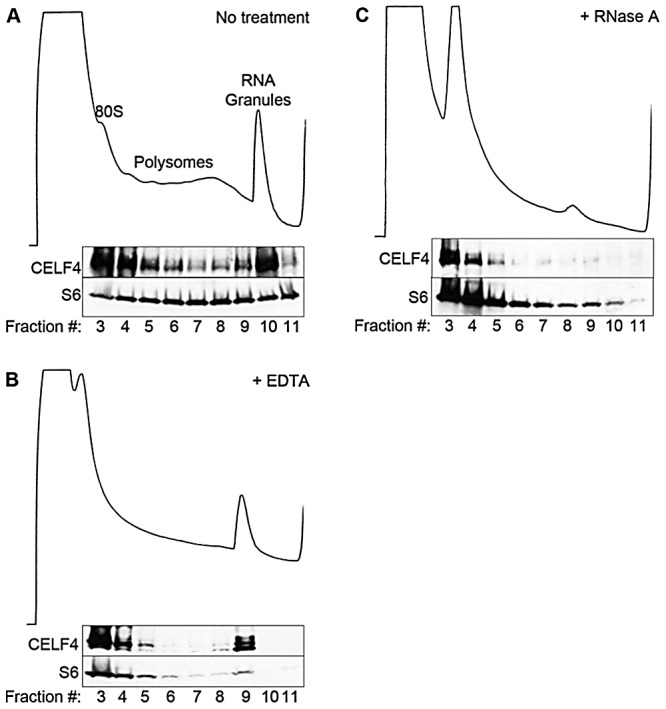
Figure 3 CELF4 cosediments with polysomes and large RNA granules. A. Cortical brain tissue lysates from 4-week old mice were fractionated on 15–55% linear sucrose gradients. Fractions were collected and analyzed by immunoblot with antibodies against CELF4 and ribosomal S6 (S6) protein. Lysates were treated with either EDTA (B) or RNase A (C) in parallel. Sedimentation is show from left to right, with the positions of monosomes (80S), polysomes, and RNA granules indicated.
Figure 3 CELF4 cosediments with polysomes and large RNA granules. A. Cortical brain tissue lysates from 4-week old mice were fractionated on 15–55% linear sucrose gradients. Fractions were collected and analyzed by immunoblot with antibodies against CELF4 and ribosomal S6 (S6) protein. Lysates were treated with either EDTA (B) or RNase A (C) in parallel. Sedimentation is show from left to right, with the positions of monosomes (80S), polysomes, and RNA granules indicated.CC BY · PubMed Central
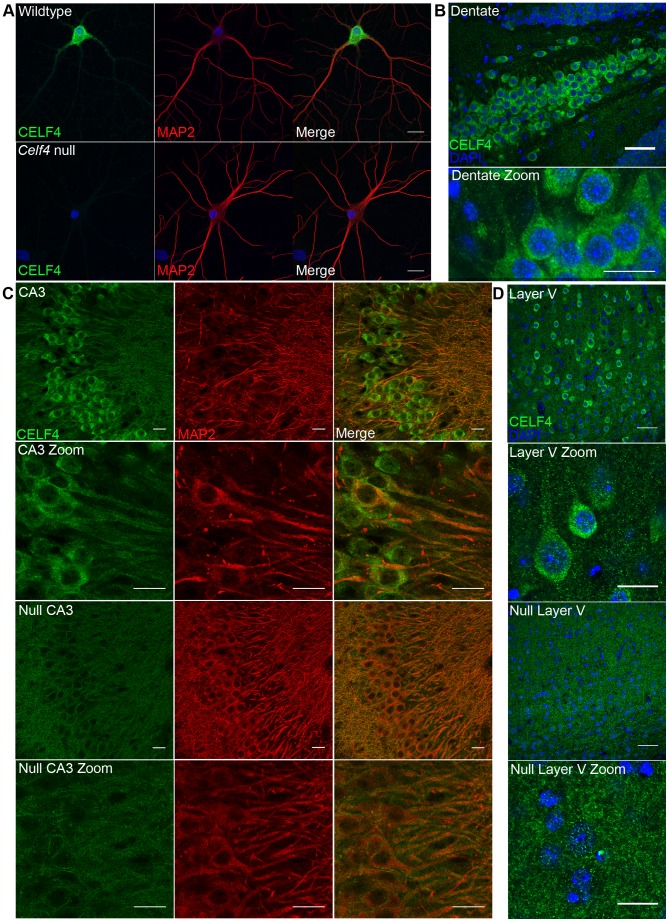
Figure 4 CELF4 protein is localized in soma and in neuronal projections. A. Wildtype DIV14 cultured primary hippocampal neurons were examined for CELF4 protein localization by immunostaining with antibody against CELF4. Neuronal projections were stained with antibody against MAP2. Scale bar 20 µm. B–D. Sections from adult wildtype and Celf4 null mouse brains were examined for CELF4 protein localization by immunostaining with antibody against CELF4. In coronal cryosections, high CELF4 expression is seen in hippocampus, including the dentate gyrus (B), and in cortical layer V pyramidal neurons (D), which show CELF4 localization in soma and apical dendrites (D - top two panels). In sagittal vibratome sections, CELF4 localizes to soma and into dendrites in the CA3 region of the hippocampus as shown by colocalization with MAP2 (C – top two panels). The CELF4 antibody is specific as no signal above background is seen in Celf4 null hippocampal or cortical layer V cells (C,D - bottom two panels). Nuclei were stained with DAPI. Scale bar 20 µm.
Figure 4 CELF4 protein is localized in soma and in neuronal projections. A. Wildtype DIV14 cultured primary hippocampal neurons were examined for CELF4 protein localization by immunostaining with antibody against CELF4. Neuronal projections were stained with antibody against MAP2. Scale bar 20 µm. B–D. Sections from adult wildtype and Celf4 null mouse brains were examined for CELF4 protein localization by immunostaining with antibody against CELF4. In coronal cryosections, high CELF4 expression is seen in hippocampus, including the dentate gyrus (B), and in cortical layer V pyramidal neurons (D), which show CELF4 localization in soma and apical dendrites (D - top two panels). In sagittal vibratome sections, CELF4 localizes to soma and into dendrites in the CA3 region of the hippocampus as shown by colocalization with MAP2 (C – top two panels). The CELF4 antibody is specific as no signal above background is seen in Celf4 null hippocampal or cortical layer V cells (C,D - bottom two panels). Nuclei were stained with DAPI. Scale bar 20 µm.CC BY · PubMed Central
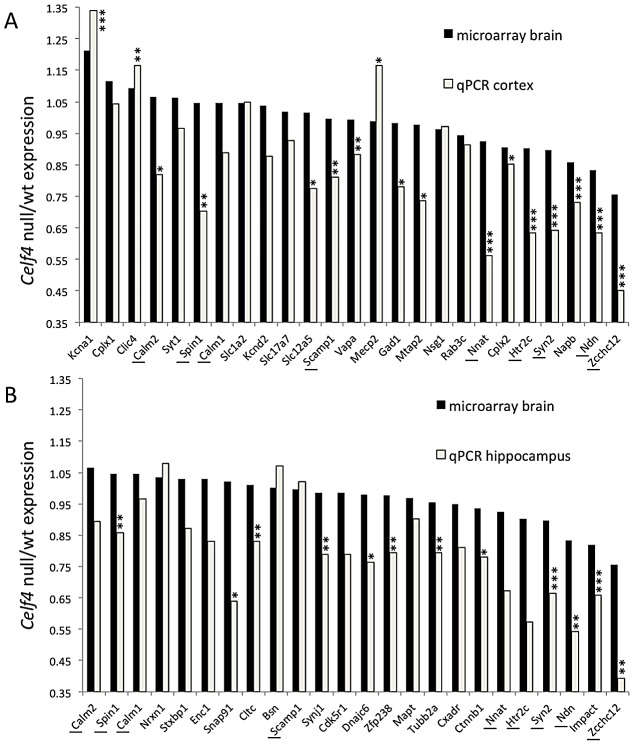
Figure 5 Validation of CELF4 genotype-dependent abundance changes of select CELF4 target mRNAs. The white column in each panel shows relative fold change (expressed as 2ΔΔCt –Methods) between Celf4 null and wt for dissected cerebral cortex (panel A), or hippocampus (panel B), respectively by quantitative real-time RT-PCR (qPCR). In both panels filled columns show the ratio of normalized average fluorescence between Celf4 null and wt from the whole brain microarray. For qPCR data, statistical significance was determined using Student's |t| test: *p<0.1, **p<.05, ***p<0.01. Underlined gene symbols highlight genes tested in both tissues. The ΔΔCt data for qPCR and subset of microarray data can be found in File S4.
Figure 5 Validation of CELF4 genotype-dependent abundance changes of select CELF4 target mRNAs. The white column in each panel shows relative fold change (expressed as 2ΔΔCt –Methods) between Celf4 null and wt for dissected cerebral cortex (panel A), or hippocampus (panel B), respectively by quantitative real-time RT-PCR (qPCR). In both panels filled columns show the ratio of normalized average fluorescence between Celf4 null and wt from the whole brain microarray. For qPCR data, statistical significance was determined using Student's |t| test: *p<0.1, **p<.05, ***p<0.01. Underlined gene symbols highlight genes tested in both tissues. The ΔΔCt data for qPCR and subset of microarray data can be found in File S4.CC BY · PubMed Central
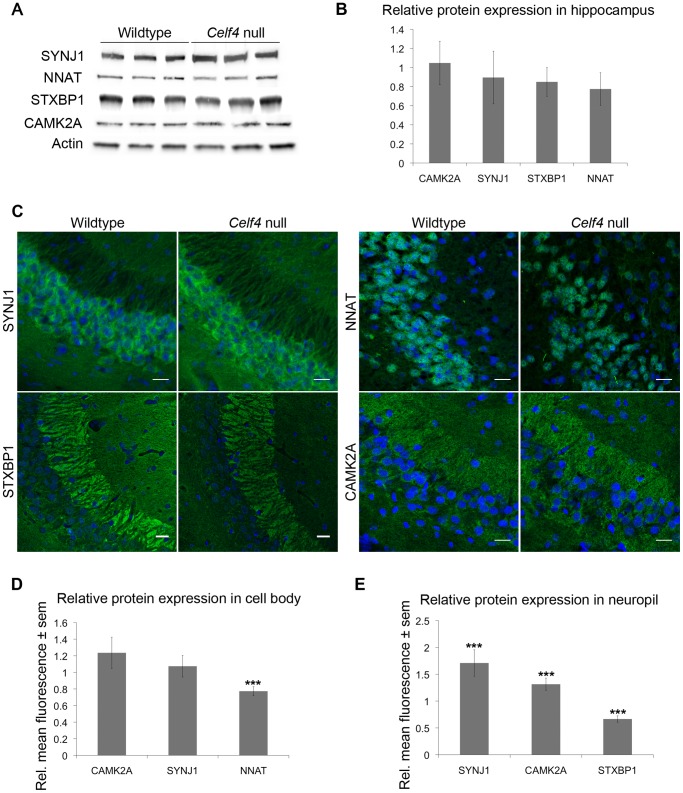
Figure 6 Celf4 genotype-dependent whole cell versus subcellular expression for four CELF4 targets. A, B. Protein abundance in wildtype and Celf4 null hippocampal tissue extracts were examined by quantitative western blotting. Representative immunoblots are shown; each protein was assessed in extracts from three mice of the same genotype. Immunoblots were visualized with chemiluminescence and signal was captured with a cooled CCD camera. B. Quantification of protein abundance was performed using ImageJ. Each sample was normalized to actin. Relative mean OD values of the Celf4 null samples compared to wildtype samples are shown with standard deviation. C–E. Sagittal sections from wildtype and Celf4 null mutant mouse brains were examined for CELF4 target protein expression using immunostaining. C. Representative images from the CA3 region of the hippocampus is shown. D. For cell body, fluorescence was quantitated in ImageJ by measuring the mean intensity for each positive cell body. Background was subtracted and average mean fluorescence for Celf4 null and wildtype were calculated. Data are presented as mean fluorescence of Celf4 null relative to wildtype ± sem. E. For dendrites, fluorescence was quantitated in ImageJ by measuring the mean intensity for each positive dendrite in the stratum radiatum or positive region in the stratum lacunosum-moleculare. Background was subtracted and average mean fluorescence for Celf4 null and wildtype were calculated. Data are presented as mean fluorescence of Celf4 null relative to wildtype ± sem. For D and E, statistical significance was determined using Student's |t| test: ***p<0.01.
Figure 6 Celf4 genotype-dependent whole cell versus subcellular expression for four CELF4 targets. A, B. Protein abundance in wildtype and Celf4 null hippocampal tissue extracts were examined by quantitative western blotting. Representative immunoblots are shown; each protein was assessed in extracts from three mice of the same genotype. Immunoblots were visualized with chemiluminescence and signal was captured with a cooled CCD camera. B. Quantification of protein abundance was performed using ImageJ. Each sample was normalized to actin. Relative mean OD values of the Celf4 null samples compared to wildtype samples are shown with standard deviation. C–E. Sagittal sections from wildtype and Celf4 null mutant mouse brains were examined for CELF4 target protein expression using immunostaining. C. Representative images from the CA3 region of the hippocampus is shown. D. For cell body, fluorescence was quantitated in ImageJ by measuring the mean intensity for each positive cell body. Background was subtracted and average mean fluorescence for Celf4 null and wildtype were calculated. Data are presented as mean fluorescence of Celf4 null relative to wildtype ± sem. E. For dendrites, fluorescence was quantitated in ImageJ by measuring the mean intensity for each positive dendrite in the stratum radiatum or positive region in the stratum lacunosum-moleculare. Background was subtracted and average mean fluorescence for Celf4 null and wildtype were calculated. Data are presented as mean fluorescence of Celf4 null relative to wildtype ± sem. For D and E, statistical significance was determined using Student's |t| test: ***p<0.01.CC BY · PubMed Central
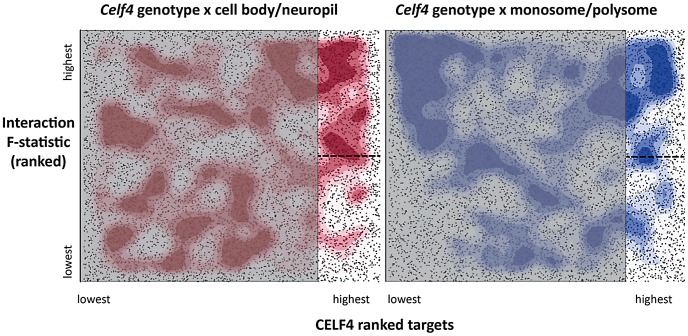
Figure 7 Visualization of Celf4 genotype-dependent shift of CELF4 target mRNAs between polysome fractions and along the cell body/neuropil axis of CA1 hippocampal neurons. Each chart shows the entire space examined in interaction ANOVA models described in the text and summarized on Table 2, for the hippocampal CA1 cell body vs. neuropil experiment (left panel) and the monosomes vs. polysomes experiment (right panel). Each square shows individual genes (dots), plotting the rank of their iCLIP occupancy score (X axis) against the rank of their interaction F-statistic (Y axis). Less likely CELF4 targets (below the top 2,000 occupancy scores) are de-emphasized by masking, and the most likely 2,000 CELF4 targets are unmasked on the right of each square. Density contouring (applied using a standard graphing in JMP software) reveals where CELF4 target rank is most associated with differential expression. The dashed line at the right of each divides the most likely CELF4 targets in half by F-statistic score—these two halves are compared to each other for the analysis shown in Figure 8. We note that the monosomes vs. polysomes experiment did show strong contouring in the corresponding upper-left quadrant. These entries correspond largely to mitochondrial mRNAs or nuclear or mitochondrial mRNAs that encode ribosomal proteins (data not shown).
Figure 7 Visualization of Celf4 genotype-dependent shift of CELF4 target mRNAs between polysome fractions and along the cell body/neuropil axis of CA1 hippocampal neurons. Each chart shows the entire space examined in interaction ANOVA models described in the text and summarized on Table 2, for the hippocampal CA1 cell body vs. neuropil experiment (left panel) and the monosomes vs. polysomes experiment (right panel). Each square shows individual genes (dots), plotting the rank of their iCLIP occupancy score (X axis) against the rank of their interaction F-statistic (Y axis). Less likely CELF4 targets (below the top 2,000 occupancy scores) are de-emphasized by masking, and the most likely 2,000 CELF4 targets are unmasked on the right of each square. Density contouring (applied using a standard graphing in JMP software) reveals where CELF4 target rank is most associated with differential expression. The dashed line at the right of each divides the most likely CELF4 targets in half by F-statistic score—these two halves are compared to each other for the analysis shown in Figure 8. We note that the monosomes vs. polysomes experiment did show strong contouring in the corresponding upper-left quadrant. These entries correspond largely to mitochondrial mRNAs or nuclear or mitochondrial mRNAs that encode ribosomal proteins (data not shown).CC BY · PubMed Central
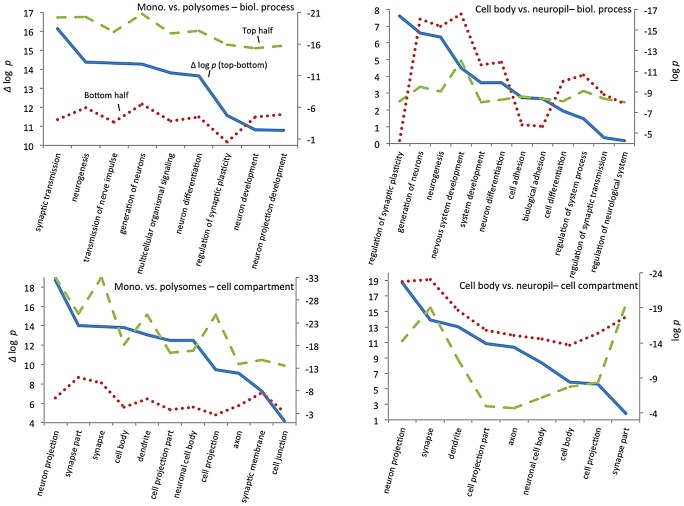
Figure 8 GO functional annotation clustering of CELF4 targets. These charts summarize gene ontology (GO) functional annotation clustering by “Biological Process” (top panels) and “Cellular Compartment” (bottom panels) for the most differentially expressed CELF4 targets compared with the least differentially expressed - as derived from the interaction ANOVA models (Table 2; Figure 7) for the monosomes vs. polysomes experiment (left panels) or the hippocampal CA1 cell body vs. neuropil experiment (right panels). The format and approach to construction of these charts were the same as for those shown in Figure 2A. The analysis illustrates how differentially expressed CELF4 targets in the monosomes vs. polysomes experiment cluster very significantly across many neuronal biological processes and cell compartments, whereas only a subset of CELF4 targets are associated with biological processes and sites that are differentially expressed between cell body and neuropil. The gene lists and VLAD output for all data, as well as the list of 142 enriched genes as derived from this analysis, may be found in File S8.
Figure 8 GO functional annotation clustering of CELF4 targets. These charts summarize gene ontology (GO) functional annotation clustering by “Biological Process” (top panels) and “Cellular Compartment” (bottom panels) for the most differentially expressed CELF4 targets compared with the least differentially expressed - as derived from the interaction ANOVA models (Table 2; Figure 7) for the monosomes vs. polysomes experiment (left panels) or the hippocampal CA1 cell body vs. neuropil experiment (right panels). The format and approach to construction of these charts were the same as for those shown in Figure 2A. The analysis illustrates how differentially expressed CELF4 targets in the monosomes vs. polysomes experiment cluster very significantly across many neuronal biological processes and cell compartments, whereas only a subset of CELF4 targets are associated with biological processes and sites that are differentially expressed between cell body and neuropil. The gene lists and VLAD output for all data, as well as the list of 142 enriched genes as derived from this analysis, may be found in File S8.CC BY · PubMed Central
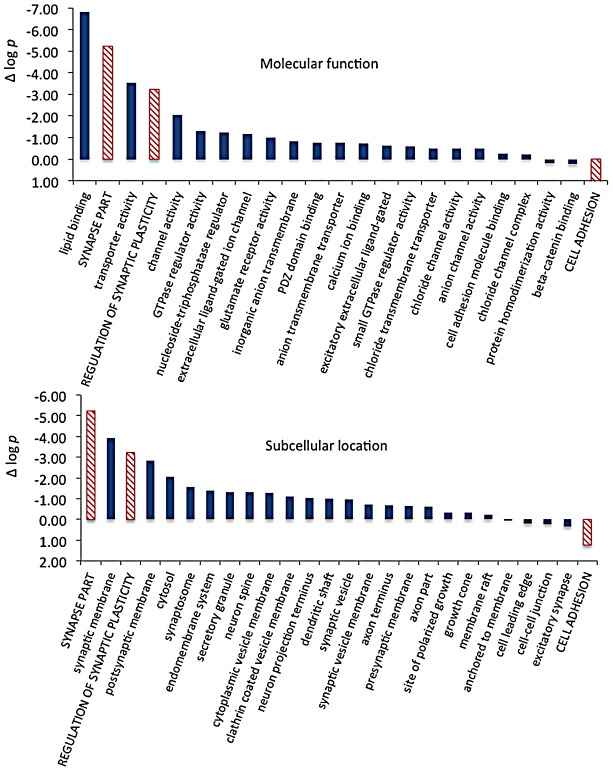
Figure 9 Significance and direction of effect for synaptic CELF targets enriched between cell body and neuropil. This figure, together with Table 3, considers the subset of 142 CELF4 targets selectively enriched for differential expression between hippocampal CA1 cell body vs. neuropil, as derived from the GO categories “Regulation of synaptic plasticity”, “Synapse part” and “Cell adhesion”, from Figure 8. The relative significance is shown for the three proxy categories (non-solid columns) and various subcategories (solid columns) of molecular function (panel A) and subcellular location (panel B), using the difference in the log p value derived from Fisher's Exact test for each (Δ log p), as an indicator (Y-axis). Categories were selected based on having at least 12 CELF4 targets in each, and also only one category is shown if closely-related GO categories had the same members in them (e.g. “transporter activity” was shown but not “ion transporter activity”, “transmembrane transporter activity” which had the same members). For molecular function, the largest effect is seen for proteins that associate with “lipid binding”, transporter activity” and “channel activity”, with the next category being almost an order of magnitude less significant. For subcellular localization, the subcategories that had the largest effect were “synaptic membrane”, and “presynaptic membrane”, although various other structures were almost as significant. The full list of genes, categories, sample sizes and expression data can be found in File S8.
Figure 9 Significance and direction of effect for synaptic CELF targets enriched between cell body and neuropil. This figure, together with Table 3, considers the subset of 142 CELF4 targets selectively enriched for differential expression between hippocampal CA1 cell body vs. neuropil, as derived from the GO categories “Regulation of synaptic plasticity”, “Synapse part” and “Cell adhesion”, from Figure 8. The relative significance is shown for the three proxy categories (non-solid columns) and various subcategories (solid columns) of molecular function (panel A) and subcellular location (panel B), using the difference in the log p value derived from Fisher's Exact test for each (Δ log p), as an indicator (Y-axis). Categories were selected based on having at least 12 CELF4 targets in each, and also only one category is shown if closely-related GO categories had the same members in them (e.g. “transporter activity” was shown but not “ion transporter activity”, “transmembrane transporter activity” which had the same members). For molecular function, the largest effect is seen for proteins that associate with “lipid binding”, transporter activity” and “channel activity”, with the next category being almost an order of magnitude less significant. For subcellular localization, the subcategories that had the largest effect were “synaptic membrane”, and “presynaptic membrane”, although various other structures were almost as significant. The full list of genes, categories, sample sizes and expression data can be found in File S8.CC BY · PubMed Central

Verification

Claims the paper makes

The claims and statistics of this paper haven’t been checked yet.

Run the check — free, no account needed. It reads the open-access text and checks the sources it cites.

A few free checks a day · papers already verified open instantly · results are public

Claims other papers make about this one

Each is checked against this paper’s own text: does it say what the citing paper says it does?

Self-check

Percentages, sums and reported differences re-computed from the paper’s own numbers.

The self-check needs the paper’s full text.

Citations

Cites

Show all 78 references

Cited by

Sorted by citations

Items 101–125 of 125

Metadata

Authors
Wagnon, J. L., Briese, M., Sun, W., Mahaffey, C. L., Curk, T., Rot, G., Ule, J., & Frankel, W. N.
Affiliations
  • Jackson Laboratory (US)
  • MRC Laboratory of Molecular Biology (GB)
  • University of Ljubljana (SI)
Corresponding author
Frankel, Wayne N.
Venue
PLoS Genetics
Published
2012-11-29
Volume
8
Issue
11
Pages
e1003067
ISSN
  • 1553-7390 (ISSN-L)
  • 1553-7404
OpenAlex
W1998831398
Cited by
125
References
78
Citations by year
2026: 11 · 2025: 10 · 2024: 9 · 2023: 8 · 2022: 8 · 2021: 7 · 2020: 19 · 2019: 8 · 2018: 11 · 2017: 12 · 2016: 5 · 2015: 7 · 2014: 2 · 2013: 7 · 2012: 1
FWCI
2.19
Type
journal article
Language
en
Open access
Locations
  • PLoS Genetics (publishedVersion, cc-by)
  • PubMed Central (publishedVersion, cc-by)
  • PubMed (publishedVersion)
  • Repository of the University of Ljubljana (University of Ljubljana) (publishedVersion, other-oa)
  • DOAJ (DOAJ: Directory of Open Access Journals) (submittedVersion, cc-by-sa)
  • UCL Discovery (University College London) (submittedVersion)
  • Figshare (submittedVersion, cc-by)
  • The Mouseion at the JAXlibrary (Jackson Laboratory) (submittedVersion)
Funders
  • Epilepsy Foundation
  • Wellcome Trust (089701)
  • Javna Agencija za Raziskovalno Dejavnost RS
  • National Institutes of Health
  • Medical Research Council
Topics
  • Life Sciences › Biochemistry, Genetics and Molecular Biology › Molecular Biology › RNA Research and Splicing
  • Life Sciences › Biochemistry, Genetics and Molecular Biology › Genetics › Genetics and Neurodevelopmental Disorders
  • Life Sciences › Neuroscience › Cellular and Molecular Neuroscience › Neuroscience and Neuropharmacology Research
Keywords
CELF4, RNA-binding proteins, 3' untranslated region, mRNA stability, translational regulation, polysome fractionation, neuronal hyperexcitability, epilepsy, synaptic plasticity, synaptic transmission, excitatory neurons
MeSH terms
CELF Proteins, Animals, Cerebral Cortex, Epilepsy, Hippocampus, Humans, Synaptic Transmission, Neurons, RNA, Messenger, Synapses, Protein Biosynthesis, RNA-Binding Proteins, Pyramidal Cells, RNA Stability, Mice, Transcriptome, NAV1.6 Voltage-Gated Sodium Channel

About these checks

Registry, retraction, Cites and statistics results are computed, not judged, with one exception: a printed reference that no index lists is read once by a model before it counts as a citation error. Claims are extracted by a model and kept only when their quote appears verbatim in the text; each cited source is then checked, with a model’s help, for whether it says what the claim relies on. Those verdicts can be wrong — read the claim’s quote and the cited source before relying on one.

Statistics and arithmetic are recomputed, not judged.

Confidence bands are shown only for fields calibrated on our annotated test set. None is calibrated yet, so no band is shown.

What counts as a claim ›How we measure confidence ›How we check this ›

Are you an author, or do you see a problem with this page? Request a review