

The DOI matches its Crossref record; 148 of the 149 references it cites were found in a registry or an index.
A Framework for the Establishment of a Cnidarian Gene Regulatory Network for “Endomesoderm” Specification: The Inputs of ß-Catenin/TCF Signaling
Open accessAbstract
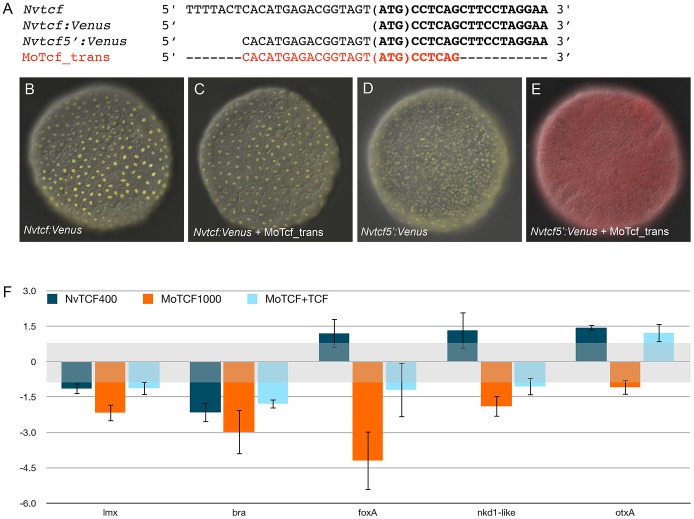
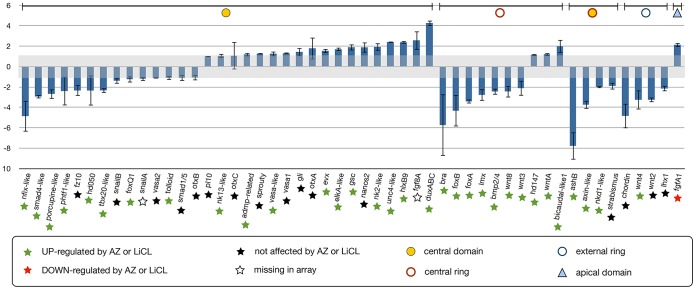
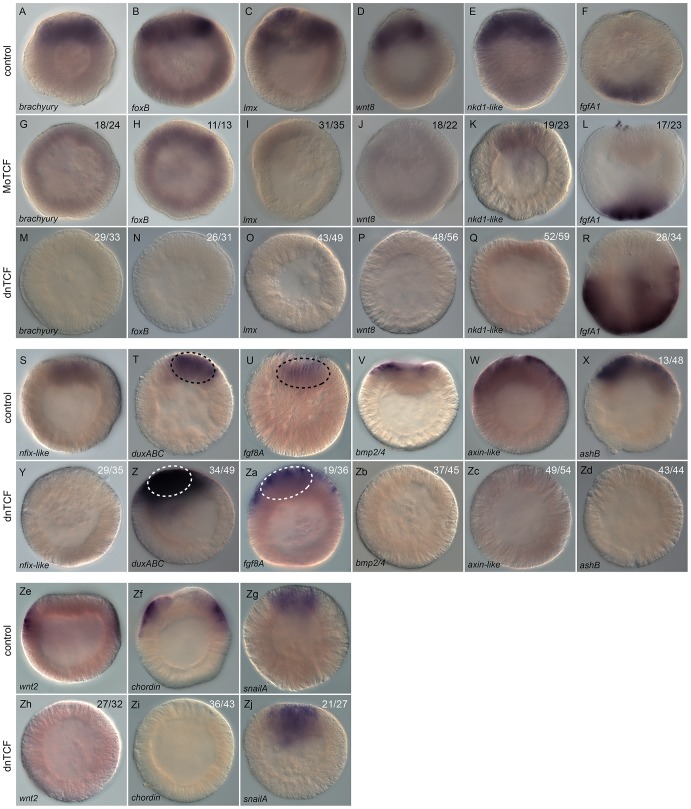
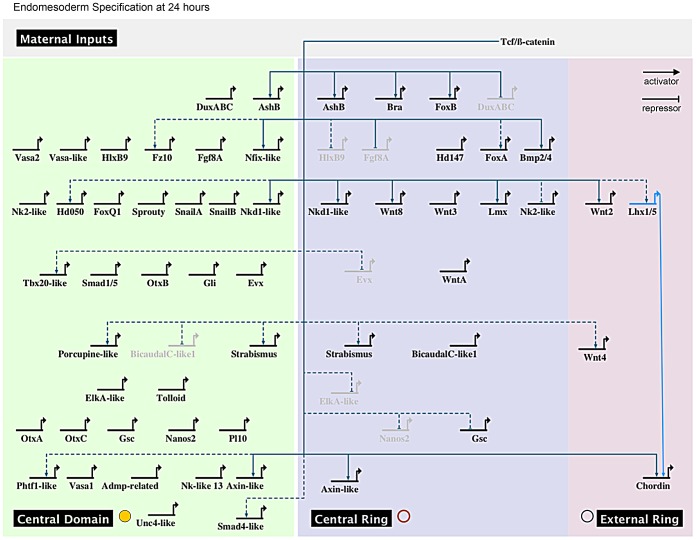
Understanding the functional relationship between intracellular factors and extracellular signals is required for reconstructing gene regulatory networks (GRN) involved in complex biological processes. One of the best-studied bilaterian GRNs describes endomesoderm specification and predicts that both mesoderm and endoderm arose from a common GRN early in animal evolution. Compelling molecular, genomic, developmental, and evolutionary evidence supports the hypothesis that the bifunctional gastrodermis of the cnidarian-bilaterian ancestor is derived from the same evolutionary precursor of both endodermal and mesodermal germ layers in all other triploblastic bilaterian animals. We have begun to establish the framework of a provisional cnidarian "endomesodermal" gene regulatory network in the sea anemone, Nematostella vectensis, by using a genome-wide microarray analysis on embryos in which the canonical Wnt/ß-catenin pathway was ectopically targeted for activation by two distinct pharmaceutical agents (lithium chloride and 1-azakenpaullone) to identify potential targets of endomesoderm specification. We characterized 51 endomesodermally expressed transcription factors and signaling molecule genes (including 18 newly identified) with fine-scale temporal (qPCR) and spatial (in situ) analysis to define distinct co-expression domains within the animal plate of the embryo and clustered genes based on their earliest zygotic expression. Finally, we determined the input of the canonical Wnt/ß-catenin pathway into the cnidarian endomesodermal GRN using morpholino and mRNA overexpression experiments to show that NvTcf/canonical Wnt signaling is required to pattern both the future endomesodermal and ectodermal domains prior to gastrulation, and that both BMP and FGF (but not Notch) pathways play important roles in germ layer specification in this animal. We show both evolutionary conserved as well as profound differences in endomesodermal GRN structure compared to bilaterians that may provide fundamental insight into how GRN subcircuits have been adopted, rewired, or co-opted in various animal lineages that give rise to specialized endomesodermal cell types.
Overview
The claims and statistics of this paper haven’t been checked yet.
Run the check — free, no account needed. It reads the open-access text and checks the sources it cites.
Integrity signals
Registry
Cites
Statistics
Figures
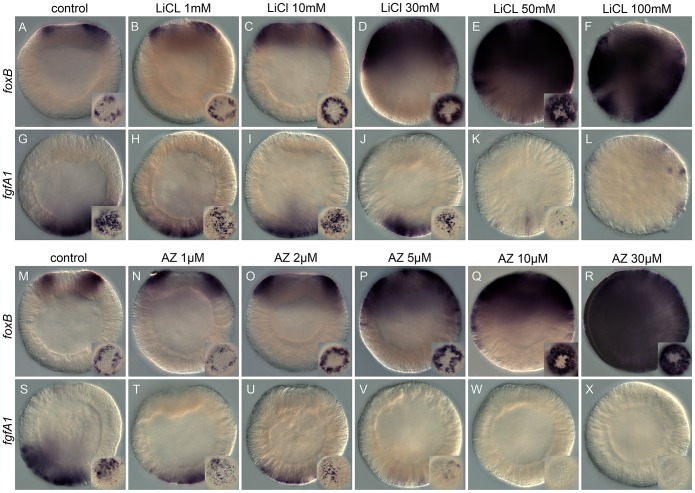
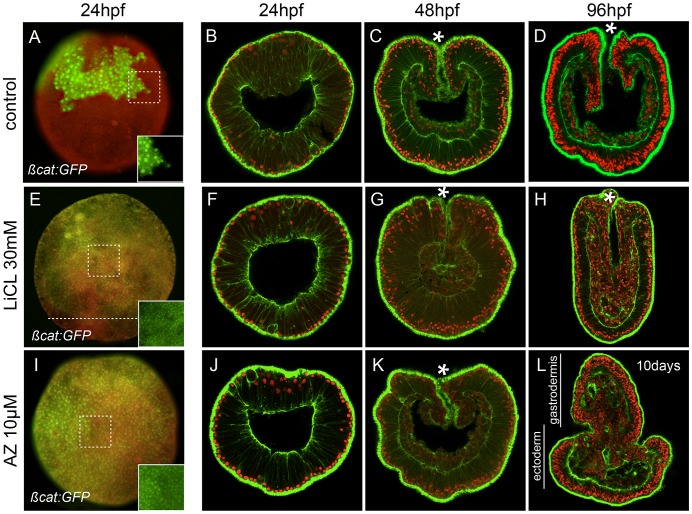
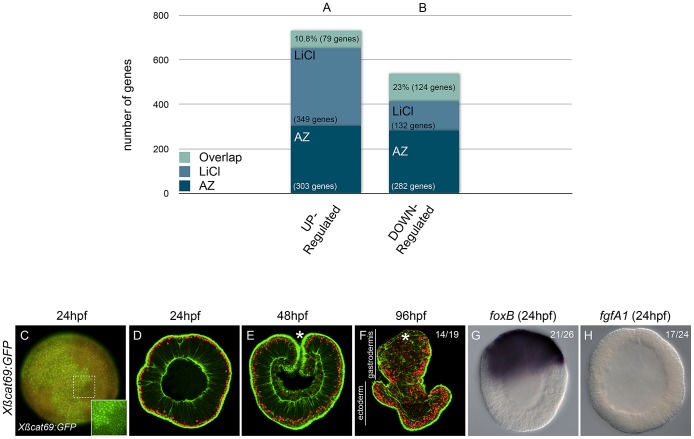
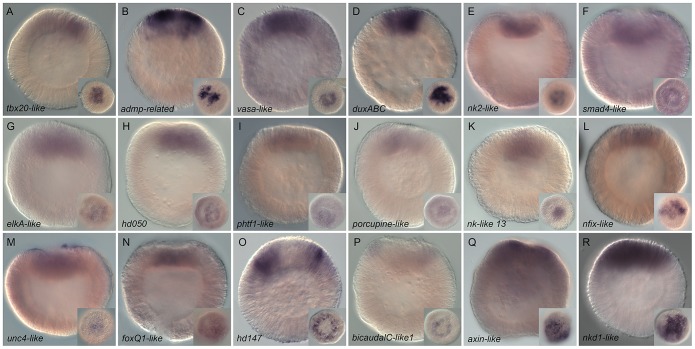
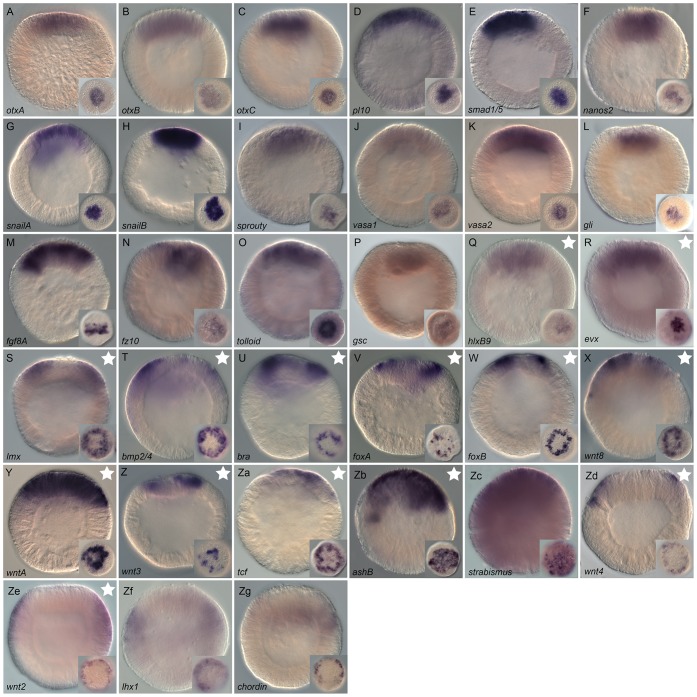
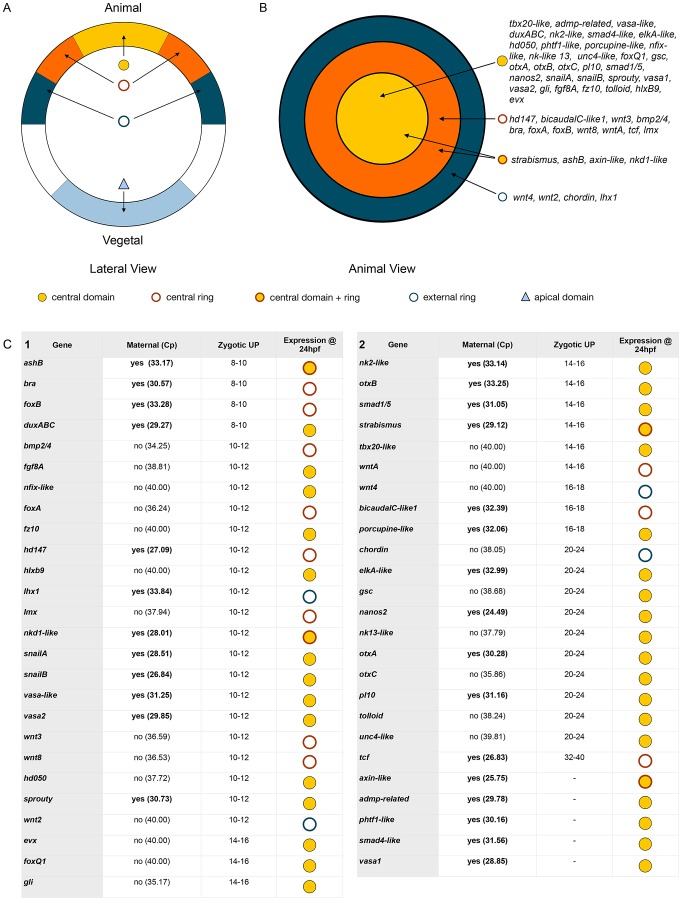
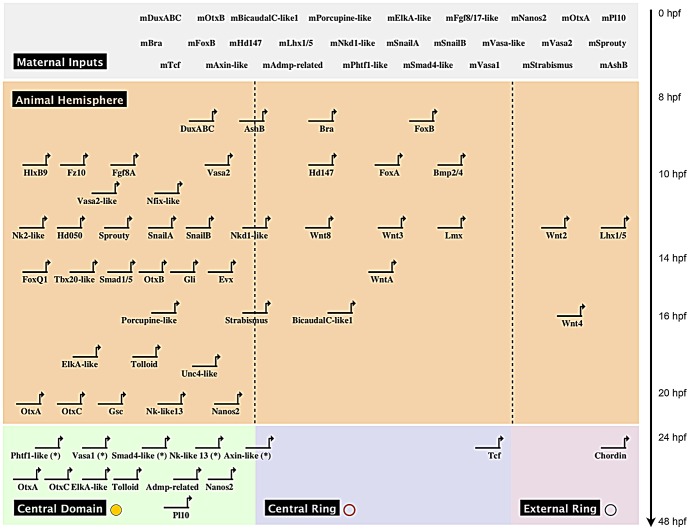
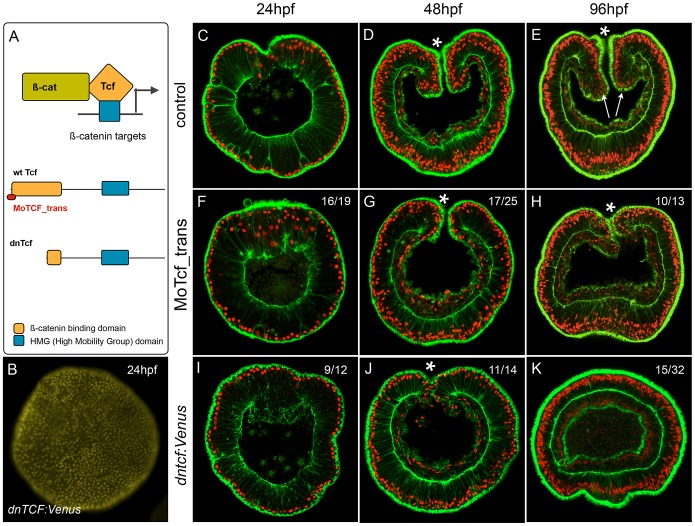
Verification
Claims the paper makes
The claims and statistics of this paper haven’t been checked yet.
Run the check — free, no account needed. It reads the open-access text and checks the sources it cites.
Claims other papers make about this one
Each is checked against this paper’s own text: does it say what the citing paper says it does?
In the citing paper
“While the posterior-anterior gradient of expression of Wnt ligands in larval and adult eumetazoans reflects the conserved role in axial patterning, the earliest function of the canonical Wnt pathway (signalling through b-catenin) is specification of the endomesoderm 19,51,52 .”
From Developmental gene expression provides clues to relationships between sponge and eumetazoan body plans (2014) · cites this paper as [19]
Self-check
Percentages, sums and reported differences re-computed from the paper’s own numbers.
The self-check needs the paper’s full text.
Citations
Cites
Basic local alignment search tool
Altschul, S. F., Gish, W., Miller, W., Myers, E. W., & Lipman, D. J. (1990) · Journal of Molecular Biology · doi:10.1006/jmbi.1990.9999 · Cited by 98,669
Exploration, normalization, and summaries of high density oligonucleotide array probe level data
Irizarry, R. A. (2003) · Biostatistics · doi:10.1093/biostatistics/4.2.249 · Cited by 10,603
Bolstad, B. M., Irizarry, R. A., Åstrand, M., & Speed, T. P. (2003) · Bioinformatics · doi:10.1093/bioinformatics/19.2.185 · Cited by 8,328
A molecular mechanism for the effect of lithium on development.
Klein, P. S., & Melton, D. A. (1996) · Proceedings of the National Academy of Sciences · doi:10.1073/pnas.93.16.8455 · Cited by 2,334
XTcf-3 Transcription Factor Mediates β-Catenin-Induced Axis Formation in Xenopus Embryos
Molenaar, M., van de Wetering, M., Oosterwegel, M., Peterson-Maduro, J., Godsave, S., Korinek, V., Roose, J., Destrée, O., & Clevers, H. (1996) · Cell · doi:10.1016/s0092-8674(00)80112-9 · Cited by 1,824
Newport, J. W., & Kirschner, M. W. (1982) · Cell · doi:10.1016/0092-8674(82)90272-0 · Cited by 1,619
A genomic regulatory network for development
Davidson, E. H., Rast, J. P., Oliveri, P., Ransick, A., Calestani, C., Yuh, C.-H., Minokawa, T., Amore, G., Hinman, V., Arenas-Mena, C., et al. (2002) · Science · doi:10.1126/science.1069883 · Cited by 1,567
Sea Anemone Genome Reveals Ancestral Eumetazoan Gene Repertoire and Genomic Organization
Putnam, N. H., Srivastava, M., Hellsten, U., Dirks, B., Chapman, J., Salamov, A., Terry, A., Shapiro, H., Lindquist, E., Kapitonov, V. V., et al. (2007) · Science · doi:10.1126/science.1139158 · Cited by 1,555
Self-citationThe specificities of protein kinase inhibitors: an update
BAIN, J., McLAUCHLAN, H., ELLIOTT, M., & COHEN, P. (2003) · Biochemical Journal · doi:10.1042/bj20021535 · Cited by 1,369
Lithium inhibits glycogen synthase kinase-3 activity and mimics wingless signalling in intact cells
Stambolic, V., Ruel, L., & Woodgett, J. R. (1996) · Current Biology · doi:10.1016/s0960-9822(02)70790-2 · Cited by 1,321
Research works printed but not linked: 4
- A Rodaway, 2001, Mesendoderm. an ancient germ layer?, Cell, 105, 169
- CA Byrum, 2003, Gastrulation in the Cnidara and Ctenophora, Gastrulation, From Cells to Embryo CSHL Press, 33
- Fautin DG, Mariscal R.N. (1991) Cnidaria: Anthozoa. New York: Wiley-Liss.
- U Technau, 2011, Evolutionary crossroads in developmental biology: Cnidaria, Development, 138, 1447, 10.1242/dev.048959 · DOI · Paper page
Cited by
Sorted by citations
From nerve net to nerve ring, nerve cord and brain — evolution of the nervous system
Arendt, D., Tosches, M. A., & Marlow, H. (2016) · Nature Reviews Neuroscience · doi:10.1038/nrn.2015.15 · Cited by 279
The genome of the jellyfish Clytia hemisphaerica and the evolution of the cnidarian life-cycle
Leclère, L., Horin, C., Chevalier, S., Lapébie, P., Dru, P., Péron, S., Jager, M., Condamine, T., Pottin, K., Romano, S., et al. (2019) · Nature Ecology & Evolution · doi:10.1038/s41559-019-0833-2 · Cited by 189
TALEN and CRISPR/Cas9-mediated genome editing in the early-branching metazoan Nematostella vectensis
Ikmi, A., McKinney, S. A., Delventhal, K. M., & Gibson, M. C. (2014) · Nature Communications · doi:10.1038/ncomms6486 · Cited by 165
Layden, M. J., Rentzsch, F., & Röttinger, É. (2016) · Wiley Interdisciplinary Reviews Developmental Biology · doi:10.1002/wdev.222 · Cited by 148
Pre-bilaterian origin of the blastoporal axial organizer
Kraus, Y., Aman, A., Technau, U., & Genikhovich, G. (2016) · Nature Communications · doi:10.1038/ncomms11694 · Cited by 143
Leininger, S., Adamski, M., Bergum, B., Guder, C., Liu, J., Laplante, M., Bråte, J., Hoffmann, F., Fortunato, S., Jordal, S., et al. (2014) · Nature Communications · doi:10.1038/ncomms4905 · Cited by 136
Gut-like ectodermal tissue in a sea anemone challenges germ layer homology
Steinmetz, P. R. H., Aman, A. J., Kraus, J. E. M., & Technau, U. (2017) · Nature Ecology & Evolution · doi:10.1038/s41559-017-0285-5 · Cited by 135
DuBuc, T. Q., Traylor‐Knowles, N., & Martindale, M. Q. (2014) · BMC Biology · doi:10.1186/1741-7007-12-24 · Cited by 143
Self-citationOn the evolution of bilaterality
Genikhovich, G., & Technau, U. (2017) · Development · doi:10.1242/dev.141507 · Cited by 118
Evolutionary origin of gastrulation: insights from sponge development
Nakanishi, N., Sogabe, S., & Degnan, B. M. (2014) · BMC Biology · doi:10.1186/1741-7007-12-26 · Cited by 109
Diversity of Cnidarian Muscles: Function, Anatomy, Development and Regeneration
Leclère, L., & Röttinger, É. (2017) · Frontiers in Cell and Developmental Biology · doi:10.3389/fcell.2016.00157 · Cited by 108
The cellular and molecular basis of cnidarian neurogenesis
Rentzsch, F., Layden, M. J., & Manuel, M. (2016) · Wiley Interdisciplinary Reviews Developmental Biology · doi:10.1002/wdev.257 · Cited by 96
Leclère, L., Bause, M., Sinigaglia, C., Steger, J., & Rentzsch, F. (2016) · Development · doi:10.1242/dev.120931 · Cited by 82
Layden, M. J., Röttinger, É., Wolenski, F. S., Gilmore, T. D., & Martindale, M. Q. (2013) · Nature Protocols · doi:10.1038/nprot.2013.009 · Cited by 81
Self-citationMarlow, H. Q., Matus, D. Q., & Martindale, M. Q. (2013) · Developmental Biology · doi:10.1016/j.ydbio.2013.05.022 · Cited by 82
Self-citationAmiel, A., Johnston, H. T., Nedoncelle, K., Warner, J. F., Ferreira, S., & Röttinger, É. (2015) · International Journal of Molecular Sciences · doi:10.3390/ijms161226100 · Cited by 80
Duffy, D. J., Krstić, A., Schwarzl, T., Higgins, D. G., & Kölch, W. (2013) · Molecular Cancer Therapeutics · doi:10.1158/1535-7163.mct-13-0560-t · Cited by 79
Sequential actions of β-catenin and Bmp pattern the oral nerve net in Nematostella vectensis
Watanabe, H., Kuhn, A., Fushiki, M., Agata, K., Özbek, S., Fujisawa, T., & Holstein, T. W. (2014) · Nature Communications · doi:10.1038/ncomms6536 · Cited by 79
Yankura, K. A., Koechlein, C. S., Cryan, A. F., Jarvela, A. M. C., & Hinman, V. F. (2013) · Proceedings of the National Academy of Sciences · doi:10.1073/pnas.1220903110 · Cited by 75
β-Catenin–dependent mechanotransduction dates back to the common ancestor of Cnidaria and Bilateria
Pukhlyakova, E., Aman, A. J., Elsayad, K., & Technau, U. (2018) · Proceedings of the National Academy of Sciences · doi:10.1073/pnas.1713682115 · Cited by 75
Hox and Wnt pattern the primary body axis of an anthozoan cnidarian before gastrulation
DuBuc, T. Q., Stephenson, T. B., Rock, A. Q., & Martindale, M. Q. (2018) · Nature Communications · doi:10.1038/s41467-018-04184-x · Cited by 73
Self-citationBoyle, M. J., Yamaguchi, E., & Seaver, E. C. (2014) · EvoDevo · doi:10.1186/2041-9139-5-39 · Cited by 67
Warner, J. F., Guerlais, V., Amiel, A., Johnston, H., Nedoncelle, K., & Röttinger, É. (2018) · Development · doi:10.1242/dev.162867 · Cited by 72
Jager, M., Dayraud, C., Mialot, A., Quéinnec, É., Guyader, H. L., & Manuel, M. (2013) · PLoS ONE · doi:10.1371/journal.pone.0084363 · Cited by 74
Babonis, L. S., Martindale, M. Q., & Ryan, J. F. (2016) · BMC Evolutionary Biology · doi:10.1186/s12862-016-0683-3 · Cited by 65
Self-citationPerry, K. J., Lyons, D. C., Truchado-García, M., Fischer, A., Helfrich, L. W., Johansson, K. B., Diamond, J. C., Grande, C., & Henry, J. J. (2015) · Developmental Dynamics · doi:10.1002/dvdy.24308 · Cited by 64
MAPK signaling is necessary for neurogenesis in Nematostella vectensis
Layden, M. J., Johnston, H. T., Amiel, A., Havrilak, J. A., Steinworth, B. M., Chock, T., Röttinger, É., & Martindale, M. Q. (2016) · BMC Biology · doi:10.1186/s12915-016-0282-1 · Cited by 62
Self-citationYasuoka, Y., Shinzato, C., & Satoh, N. (2016) · Current Biology · doi:10.1016/j.cub.2016.08.011 · Cited by 60
Tulin, S., Aguiar, D., Istrail, S., & Smith, J. (2013) · EvoDevo · doi:10.1186/2041-9139-4-16 · Cited by 55
From direct to indirect lithium targets: a comprehensive review of omics data
Roux-Rouquié, M., & Dosseto, A. (2017) · Metallomics · doi:10.1039/c7mt00203c · Cited by 50
Servetnick, M. D., Steinworth, B. M., Babonis, L. S., Simmons, D., Salinas‐Saavedra, M., & Martindale, M. Q. (2017) · Development · doi:10.1242/dev.145839 · Cited by 45
Self-citationDose-dependent nuclear β-catenin response segregates endomesoderm along the sea star primary axis
McCauley, B. S., Akyar, E., Saad, H. R., & Hinman, V. F. (2014) · Development · doi:10.1242/dev.113043 · Cited by 45
PaxA, but not PaxC, is required for cnidocyte development in the sea anemone Nematostella vectensis
Babonis, L. S., & Martindale, M. Q. (2017) · EvoDevo · doi:10.1186/s13227-017-0077-7 · Cited by 44
Self-citationGastrulation and germ layer formation in the sea anemone Nematostella vectensis and other cnidarians
Technau, U. (2020) · Mechanisms of Development · doi:10.1016/j.mod.2020.103628 · Cited by 43
An anterior signaling center patterns and sizes the anterior neuroectoderm of the sea urchin embryo
Range, R., & Zheng, W. (2016) · Development · doi:10.1242/dev.128165 · Cited by 43
Old Cell, New Trick? Cnidocytes as a Model for the Evolution of Novelty
Babonis, L. S., & Martindale, M. Q. (2014) · Integrative and Comparative Biology · doi:10.1093/icb/icu027 · Cited by 41
Self-citationDuBuc, T. Q., Bobkov, Y. V., Ryan, J. F., & Martindale, M. Q. (2019) · Molecular Biology and Evolution · doi:10.1093/molbev/msz025 · Cited by 41
Self-citationExpression of wnt and frizzled genes during early sea star development
McCauley, B. S., Akyar, E., Filliger, L. Z., & Hinman, V. F. (2013) · Gene Expression Patterns · doi:10.1016/j.gep.2013.07.007 · Cited by 41
Developmental gene regulatory network evolution: Insights from comparative studies in echinoderms
Hinman, V. F., & Jarvela, A. M. C. (2014) · genesis · doi:10.1002/dvg.22757 · Cited by 41
Hayward, D. C., Grasso, L. C., Saint, R. B., Miller, D. J., & Ball, E. E. (2015) · Developmental Biology · doi:10.1016/j.ydbio.2015.01.006 · Cited by 38
Salinas‐Saavedra, M., Rock, A. Q., & Martindale, M. Q. (2018) · eLife · doi:10.7554/elife.36740 · Cited by 37
Self-citationCell shape changes during larval body plan development in Clytia hemisphaerica
Kraus, Y. A., Chevalier, S., & Houliston, E. (2020) · Developmental Biology · doi:10.1016/j.ydbio.2020.09.013 · Cited by 36
Röttinger, É. (2021) · Cells · doi:10.3390/cells10102692 · Cited by 40
Wijesena, N. M., Simmons, D. K., & Martindale, M. Q. (2017) · Proceedings of the National Academy of Sciences · doi:10.1073/pnas.1701607114 · Cited by 36
Self-citationGenomics and development of Nematostella vectensis and other anthozoans
Rentzsch, F., & Technau, U. (2016) · Current Opinion in Genetics & Development · doi:10.1016/j.gde.2016.05.024 · Cited by 32
The origins of developmental gene regulation
Arenas‐Mena, C. (2017) · Evolution & Development · doi:10.1111/ede.12217 · Cited by 39
Recent advances in genomics and transcriptomics of cnidarians
Technau, U., & Schwaiger, M. (2015) · Marine Genomics · doi:10.1016/j.margen.2015.09.007 · Cited by 38
Sponges as models to study emergence of complex animals
Adamska, M. (2016) · Current Opinion in Genetics & Development · doi:10.1016/j.gde.2016.05.026 · Cited by 34
Schwaiger, M., Andrikou, C., Dnyansagar, R., Murguia, P. F., Paganos, P., Voronov, D., Zimmermann, B., Lebedeva, T. S., Schmidt, H. A., Genikhovich, G., et al. (2022) · Nature Ecology & Evolution · doi:10.1038/s41559-022-01905-w · Cited by 29
Deep conservation of cis -regulatory elements in metazoans
Maeso, I., Irimia, M., Tena, J. J., Casares, F., & Gómez-Skármeta, J. L. (2013) · Philosophical Transactions of the Royal Society B Biological Sciences · doi:10.1098/rstb.2013.0020 · Cited by 35
Love, A. C. (2024) · Cambridge University Press eBooks · doi:10.1017/9781108616751 · Cited by 33
Fortunato, S. A. V., Adamski, M., & Adamska, M. (2015) · Marine Genomics · doi:10.1016/j.margen.2015.07.008 · Cited by 31
Molluscan models: Crepidula fornicata
Henry, J. J., & Lyons, D. C. (2016) · Current Opinion in Genetics & Development · doi:10.1016/j.gde.2016.05.021 · Cited by 31
Wnt signalling is a bi-directional vulnerability of cancer cells
Duffy, D. J., Krstić, A., Schwarzl, T., Halász, M., Iljin, K., Fey, D., Haley, B., Whilde, J., Haapa-Paananen, S. M., Fey, V., et al. (2016) · Oncotarget · doi:10.18632/oncotarget.11203 · Cited by 30
Amiel, A., Foucher, K., Ferreira, S., & Röttinger, É. (2019) · bioRxiv (Cold Spring Harbor Laboratory) · doi:10.1101/2019.12.31.891804 · Cited by 27
Fischer, A., Pang, K., Henry, J. J., & Martindale, M. Q. (2014) · EvoDevo · doi:10.1186/2041-9139-5-4 · Cited by 28
Self-citationAmiel, A., Johnston, H., Chock, T., Dahlin, P., Iglesias, M., Layden, M. J., Röttinger, É., & Martindale, M. Q. (2017) · Developmental Biology · doi:10.1016/j.ydbio.2017.08.015 · Cited by 27
Self-citationOrigin of Metazoan Developmental Toolkits and Their Expression in the Fossil Record
Tweedt, S. M., & Erwin, D. H. (2015) · Advances in Marine Genomics · doi:10.1007/978-94-017-9642-2_3 · Cited by 27
Clarke, D. N., Lowe, C. J., & Nelson, W. J. (2019) · Developmental Biology · doi:10.1016/j.ydbio.2019.01.007 · Cited by 25
Ins and outs of Spiralian gastrulation
Lyons, D. C., & Henry, J. J. (2014) · The International Journal of Developmental Biology · doi:10.1387/ijdb.140151dl · Cited by 27
Sipuncula: an emerging model of spiralian development and evolution
Boyleand, M. J., & Rice, M. E. (2014) · The International Journal of Developmental Biology · doi:10.1387/ijdb.140095mb · Cited by 26
Lineage‐specific evolution of cnidarian Wnt ligands
Hensel, K., Lotan, T., Sanders, S. M., Cartwright, P., & Uri Frank, A. (2014) · Evolution & Development · doi:10.1111/ede.12089 · Cited by 23
Žídek, R., Machoň, O., & Kozmík, Z. (2018) · EvoDevo · doi:10.1186/s13227-018-0100-7 · Cited by 23
Ruocco, N., Fedele, A. M., Costantini, S., Romano, G., Ianora, A., & Costantini, M. (2017) · Ecotoxicology and Environmental Safety · doi:10.1016/j.ecoenv.2017.04.022 · Cited by 22
Salinas-Saavedra, M., Stephenson, T. Q., Dunn, C., & Martindale, M. (2015) · EvoDevo · doi:10.1186/s13227-015-0014-6 · Cited by 27
Self-citationWhole body regeneration deploys a rewired embryonic gene regulatory network logicPreprint
Johnston, H., Warner, J. F., Amiel, A., Nedoncelle, K., Carvalho, J. E., & Röttinger, É. (2019) · bioRxiv (Cold Spring Harbor Laboratory) · doi:10.1101/658930 · Cited by 36
From apolar gastrula to polarized larva: Embryonic development of a marine hydroid, Dynamena pumila
Vetrova, A. A., Lebedeva, T. S., Saidova, A. A., Kupaeva, D. M., Kraus, Y. A., & Kremnyov, S. V. (2021) · Developmental Dynamics · doi:10.1002/dvdy.439 · Cited by 18
Okubo, N., Hayward, D. C., Forêt, S., & Ball, E. E. (2016) · BMC Evolutionary Biology · doi:10.1186/s12862-016-0615-2 · Cited by 20
Mörsdorf, D., Knabl, P., & Genikhovich, G. (2024) · Development Genes and Evolution · doi:10.1007/s00427-024-00714-4 · Cited by 17
Chang, Y.-C., Pai, C.-Y., Chen, Y., Ting, H.-C., Martı́nez, P., Telford, M. J., Yu, J., & Su, Y. (2015) · Developmental Biology · doi:10.1016/j.ydbio.2015.12.015 · Cited by 16
The Diversity of Muscles and Their Regenerative Potential across Animals
Zullo, L., Bozzo, M., Daya, A., Clemente, A. D., Mancini, F. P., Megighian, A., Nesher, N., Röttinger, É., Shomrat, T., Tiozzo, S., et al. (2020) · Cells · doi:10.3390/cells9091925 · Cited by 17
Botman, D., Röttinger, É., Martindale, M. Q., de Jong, J., & Kaandorp, J. A. (2014) · PLoS ONE · doi:10.1371/journal.pone.0103341 · Cited by 16
Self-citationEctomesoderm and epithelial–mesenchymal transition‐related genes in spiralian development
Osborne, C. C., Perry, K. J., Shankland, M., & Henry, J. J. (2018) · Developmental Dynamics · doi:10.1002/dvdy.24667 · Cited by 17
Technau, U., Genikhovich, G., & Kraus, J. E. M. (2015) · Springer eBooks · doi:10.1007/978-3-7091-1862-7_6 · Cited by 17
Wijesena, N. M., Sun, H., Kumburegama, S., & Wikramanayake, A. H. (2021) · Developmental Biology · doi:10.1016/j.ydbio.2021.11.002 · Cited by 13
Klein, S., Frazier, V., Readdean, T., Lucas, E., Diaz-Jimenez, E. P., Sogin, M. L., Ruff, S. E., & Echeverri, K. (2021) · Frontiers in Ecology and Evolution · doi:10.3389/fevo.2021.786037 · Cited by 15
β-catenin-driven endomesoderm specification is a Bilateria-specific novelty
Lebedeva, T. S., Boström, J., Kremnyov, S. V., Mörsdorf, D., Niedermoser, I., Genikhovich, E., Hejnol, A., Adameyko, I. I., & Genikhovich, G. (2025) · Nature Communications · doi:10.1038/s41467-025-57109-w · Cited by 18
Yasuoka, Y., Tando, Y., Kubokawa, K., & Taira, M. (2019) · Zoological Letters · doi:10.1186/s40851-019-0143-1 · Cited by 13
Developmental Signalling and Emergence of Animal Multicellularity
Adamska, M. (2015) · Advances in marine genomics · doi:10.1007/978-94-017-9642-2_20 · Cited by 13
Dynamics of Drosophila endoderm specification
Keenan, S. E., Avdeeva, M., Yang, L., Alber, D. S., Wieschaus, E. F., & Shvartsman, S. Y. (2022) · Proceedings of the National Academy of Sciences · doi:10.1073/pnas.2112892119 · Cited by 13
Onai, T. (2018) · Evolution & Development · doi:10.1111/ede.12273 · Cited by 13
Reflections on Model Organisms in Evolutionary Developmental Biology
Love, A. C., & Yoshida, Y. (2019) · Results and problems in cell differentiation · doi:10.1007/978-3-030-23459-1_1 · Cited by 12
Sea anemone Frizzled receptors play partially redundant roles in oral-aboral axis patterning
Niedermoser, I., Lebedeva, T. S., & Genikhovich, G. (2022) · Development · doi:10.1242/dev.200785 · Cited by 12
Nguyen, N. M., Merle, T., Broders, F., Brunet, A., Battistella, A., Land, E. B. L., Sarron, F., Jha, A., Gennisson, J., Röttinger, É., et al. (2022) · Frontiers in Cell and Developmental Biology · doi:10.3389/fcell.2022.992371 · Cited by 10
Zhao, Y., Song, M., Yu, Z., Pang, L., Zhang, L., Karakassis, I., Dimitriou, P. D., & Yuan, X. (2023) · Biology · doi:10.3390/biology12121520 · Cited by 9
Kawai, N., Kuraishi, R., & Kaneko, H. (2016) · Gene Expression Patterns · doi:10.1016/j.gep.2016.06.003 · Cited by 9
β-catenin has an ancestral role in cell fate specification but not cell adhesionPreprint
Salinas‐Saavedra, M., Wikramanayake, A. H., & Martindale, M. Q. (2019) · bioRxiv (Cold Spring Harbor Laboratory) · doi:10.1101/520957 · Cited by 9
Self-citationWarner, J. F., Besemer, R. M., Schickle, A., Borbee, E. M., Changsut, I. V., Sharp, K. H., & Babonis, L. S. (2025) · EvoDevo · doi:10.1186/s13227-025-00243-9 · Cited by 10
Evolution of glial cells: a non-bilaterian perspective
Sheloukhova, L., & Watanabe, H. (2024) · Neural Development · doi:10.1186/s13064-024-00184-4 · Cited by 9
Bause, M., van der Horst, R., & Rentzsch, F. (2016) · Developmental Biology · doi:10.1016/j.ydbio.2016.04.011 · Cited by 8
Transcriptomic Analysis in the Sea Anemone Nematostella vectensis
Warner, J. F., & Röttinger, É. (2020) · Methods in molecular biology · doi:10.1007/978-1-0716-0974-3_14 · Cited by 8
Dattoli, A. A., Hink, M. A., DuBuc, T. Q., Teunisse, B., Goedhart, J., Röttinger, É., & Postma, M. (2015) · Scientific Reports · doi:10.1038/srep12147 · Cited by 8
Haillot, E., Lebedeva, T. S., Steger, J., Genikhovich, G., Montenegro, J. D., Cole, A. G., & Technau, U. (2024) · bioRxiv (Cold Spring Harbor Laboratory) · doi:10.1101/2024.10.29.620801 · Cited by 8
Segregation of endoderm and mesoderm germ layer identities in the diploblast Nematostella vectensis
Haillot, E., Lebedeva, T. S., Steger, J., Genikhovich, G., Montenegro, J. D., Cole, A. G., & Technau, U. (2025) · Nature Communications · doi:10.1038/s41467-025-63287-4 · Cited by 16
Optimized husbandry and targeted gene-editing for the cnidarian Nematostella vectensis
Carvalho, J. E., Burtin, M., Detournay, O., Amiel, A., & Röttinger, É. (2025) · Development · doi:10.1242/dev.204387 · Cited by 7
L’anémone de merNematostella vectensis
Amiel, A., Michel, V., Carvalho, J. E., Shkreli, M., Petit, C., & Röttinger, É. (2021) · médecine/sciences · doi:10.1051/medsci/2020282 · Cited by 7
Making head or tail of cnidarian hox gene function
Rentzsch, F., & Holstein, T. W. (2018) · Nature Communications · doi:10.1038/s41467-018-04585-y · Cited by 7
Botman, D., Jansson, F., Röttinger, É., Martindale, M. Q., de Jong, J., & Kaandorp, J. A. (2015) · BMC Systems Biology · doi:10.1186/s12918-015-0209-4 · Cited by 6
Self-citationThe Molecular Basis of the Gastrula Organizer in Amphibians and Cnidarians
Yasuoka, Y., & Taira, M. (2018) · Diversity and commonality in animals · doi:10.1007/978-4-431-56609-0_31 · Cited by 6
Reengineering the primary body axis by ectopic cWnt signaling
Wijesena, N. M., & Martindale, M. Q. (2018) · Current Biology · doi:10.1016/j.cub.2018.01.042 · Cited by 6
Self-citation
Metadata
- Authors
- Röttinger, E., Dahlin, P., & Martindale, M. Q.
- Affiliations
- University of Hawaiʻi at Mānoa (US)
- Corresponding author
- Martindale, Mark Q.
- Venue
- PLoS Genetics
- Publisher
- Public Library of Science (PLoS)
- Published
- 2012-12-27
- Volume
- 8
- Issue
- 12
- Pages
- e1003164
- ISSN
- 1553-7390 (ISSN-L)
- 1553-7404
- PMC
- PMC3531958
- OpenAlex
- W1989889624
- Cited by
- 140
- References
- 149
- Citations by year
- 2026: 3 · 2025: 14 · 2024: 10 · 2023: 3 · 2022: 10 · 2021: 5 · 2020: 5 · 2019: 12 · 2018: 12 · 2017: 13 · 2016: 16 · 2015: 13 · 2014: 15 · 2013: 9
- FWCI
- 4.75
- Type
- journal article
- Language
- en
- Open access
- gold
- doi.org
- Locations
- PLoS Genetics (publishedVersion, cc-by)
- PubMed Central (publishedVersion, cc-by)
- PubMed (publishedVersion)
- HAL (submittedVersion)
- DOAJ (DOAJ: Directory of Open Access Journals) (submittedVersion, cc-by-sa)
- Figshare (submittedVersion, cc-by)
- Funders
- National Institutes of Health
- National Institute of General Medical Sciences (R01GM093116, #GM093116)
- Topics
- Life Sciences › Biochemistry, Genetics and Molecular Biology › Molecular Biology › Developmental Biology and Gene Regulation
- Life Sciences › Agricultural and Biological Sciences › Animal Science and Zoology › Marine Invertebrate Physiology and Ecology
- Life Sciences › Biochemistry, Genetics and Molecular Biology › Molecular Biology › Wnt/β-catenin signaling in development and cancer
- Keywords
- gene regulatory networks, endomesoderm specification, Wnt/β-catenin signaling, Nematostella vectensis, germ layer specification, BMP signaling, FGF signaling, Notch signaling, transcription factors, zygotic gene expression, morpholino knockdown
- MeSH terms
- Amino Acid Sequence, Animals, Cell Differentiation, Cnidaria, Embryo, Nonmammalian, Endoderm, Mesoderm, Sea Anemones, Transcription Factors, Signal Transduction, Lithium Chloride, Gene Expression Regulation, Developmental, Cell Lineage, Evolution, Molecular, beta Catenin, Gene Regulatory Networks, Wnt Signaling Pathway
About these checks
Registry, retraction, Cites and statistics results are computed, not judged, with one exception: a printed reference that no index lists is read once by a model before it counts as a citation error. Claims are extracted by a model and kept only when their quote appears verbatim in the text; each cited source is then checked, with a model’s help, for whether it says what the claim relies on. Those verdicts can be wrong — read the claim’s quote and the cited source before relying on one.
Statistics and arithmetic are recomputed, not judged.
Confidence bands are shown only for fields calibrated on our annotated test set. None is calibrated yet, so no band is shown.
What counts as a claim ›How we measure confidence ›How we check this ›
Are you an author, or do you see a problem with this page? Request a review
