

The DOI matches its Crossref record; 56 of the 56 references it cites were found in a registry or an index.
Functional IL6R 358Ala Allele Impairs Classical IL-6 Receptor Signaling and Influences Risk of Diverse Inflammatory Diseases
Open accessAbstract
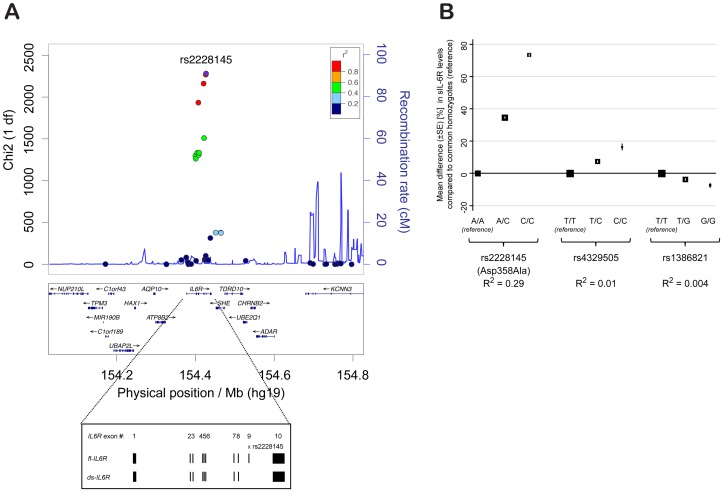
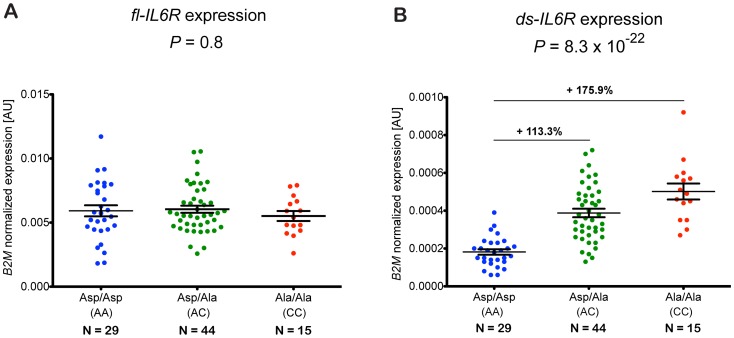
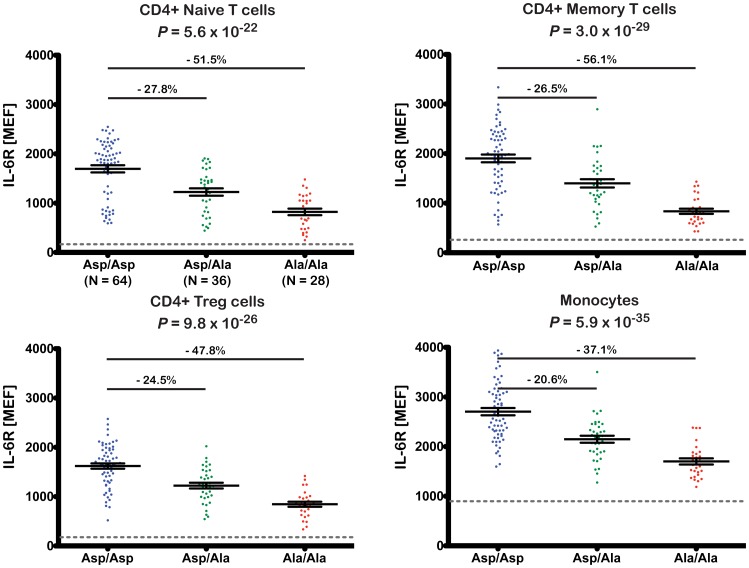
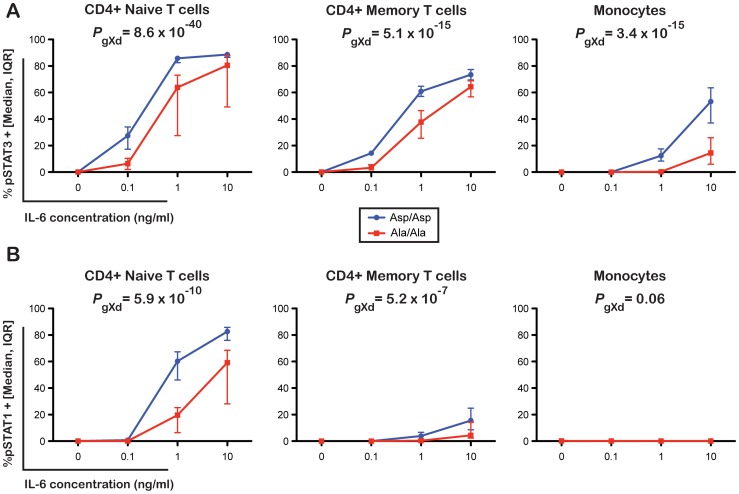
Inflammation, which is directly regulated by interleukin-6 (IL-6) signaling, is implicated in the etiology of several chronic diseases. Although a common, non-synonymous variant in the IL-6 receptor gene (IL6R Asp358Ala; rs2228145 A>C) is associated with the risk of several common diseases, with the 358Ala allele conferring protection from coronary heart disease (CHD), rheumatoid arthritis (RA), atrial fibrillation (AF), abdominal aortic aneurysm (AAA), and increased susceptibility to asthma, the variant's effect on IL-6 signaling is not known. Here we provide evidence for the association of this non-synonymous variant with the risk of type 1 diabetes (T1D) in two independent populations and confirm that rs2228145 is the major determinant of the concentration of circulating soluble IL-6R (sIL-6R) levels (34.6% increase in sIL-6R per copy of the minor allele 358Ala; rs2228145 [C]). To further investigate the molecular mechanism of this variant, we analyzed expression of IL-6R in peripheral blood mononuclear cells (PBMCs) in 128 volunteers from the Cambridge BioResource. We demonstrate that, although 358Ala increases transcription of the soluble IL6R isoform (P = 8.3×10⁻²²) and not the membrane-bound isoform, 358Ala reduces surface expression of IL-6R on CD4+ T cells and monocytes (up to 28% reduction per allele; P≤5.6×10⁻²²). Importantly, reduced expression of membrane-bound IL-6R resulted in impaired IL-6 responsiveness, as measured by decreased phosphorylation of the transcription factors STAT3 and STAT1 following stimulation with IL-6 (P≤5.2×10⁻⁷). Our findings elucidate the regulation of IL-6 signaling by IL-6R, which is causally relevant to several complex diseases, identify mechanisms for new approaches to target the IL-6/IL-6R axis, and anticipate differences in treatment response to IL-6 therapies based on this common IL6R variant.
Overview
The claims and statistics of this paper haven’t been checked yet.
Run the check — free, no account needed. It reads the open-access text and checks the sources it cites.
Integrity signals
Registry
Cites
Statistics
Figures
Verification
Claims the paper makes
The claims and statistics of this paper haven’t been checked yet.
Run the check — free, no account needed. It reads the open-access text and checks the sources it cites.
Claims other papers make about this one
Each is checked against this paper’s own text: does it say what the citing paper says it does?
In the citing paper
“Variants in the IL6R gene have been found to be associated with increased risk of coronary artery disease24, rheumatoid arthritis, atrial fibrillation, and abdominal aortic aneurysm, and with increased susceptibility to asthma, type 1 diabetes, and depression36,37.”
From Inflammageing: chronic inflammation in ageing, cardiovascular disease, and frailty (2018) · cites this paper as [37]
Self-check
Percentages, sums and reported differences re-computed from the paper’s own numbers.
The self-check needs the paper’s full text.
Citations
Cites
A new mathematical model for relative quantification in real-time RT-PCR
Pfaffl, M. W. (2001) · Nucleic Acids Research · doi:10.1093/nar/29.9.e45 · Cited by 34,610
Genome-wide association study of 14,000 cases of seven common diseases and 3,000 shared controls
The Wellcome Trust Case Control Consortium, Management Committee, Burton, P. R., Clayton, D. G., Cardon, L. R., Craddock, N., Deloukas, P., Duncanson, A., Kwiatkowski, D. P., McCarthy, M. I., et al. (2007) · Nature · doi:10.1038/nature05911 · Cited by 9,442
Self-citationKorn, T., Bettelli, E., Oukka, M., & Kuchroo, V. K. (2009) · Annual Review of Immunology · doi:10.1146/annurev.immunol.021908.132710 · Cited by 4,873
LocusZoom: regional visualization of genome-wide association scan results
Pruim, R. J., Welch, R. P., Sanna, S., Teslovich, T. M., Chines, P. S., Gliedt, T. P., Boehnke, M., Abecasis, G. R., & Willer, C. J. (2010) · Bioinformatics · doi:10.1093/bioinformatics/btq419 · Cited by 2,707
Interleukin-6-type cytokine signalling through the gp130/Jak/STAT pathway
HEINRICH, P. C., BEHRMANN, I., MÜLLER-NEWEN, G., SCHAPER, F., & GRAEVE, L. (1998) · Biochemical Journal · doi:10.1042/bj3340297 · Cited by 2,130
Van Snick, J. (1990) · Annual Review of Immunology · doi:10.1146/annurev.iy.08.040190.001345 · Cited by 1,890
Large-scale association analysis identifies new risk loci for coronary artery disease
The CARDIoGRAMplusC4D Consortium, Deloukas, P., DIAGRAM Consortium, CARDIOGENICS Consortium, MuTHER Consortium, Wellcome Trust Case Control Consortium, Kanoni, S., Willenborg, C., Farrall, M., Assimes, T. L., et al. (2013) · Nature Genetics · doi:10.1038/ng.2480 · Cited by 1,614
Association scan of 14,500 nonsynonymous SNPs in four diseases identifies autoimmunity variants
Wellcome Trust Case Control Consortium, & The Australo-Anglo-American Spondylitis Consortium (TASC) (2007) · Nature Genetics · doi:10.1038/ng.2007.17 · Cited by 1,374
(2012) · The Lancet · doi:10.1016/s0140-6736(12)60110-x · Cited by 1,146
Th17 and regulatory T cells in mediating and restraining inflammation
Littman, D. R., & Rudensky, A. Y. (2010) · Cell · doi:10.1016/j.cell.2010.02.021 · Cited by 1,039
Cited by
Sorted by citations
Inflammageing: chronic inflammation in ageing, cardiovascular disease, and frailty
Ferrucci, L., & Fabbri, E. (2018) · Nature Reviews Cardiology · doi:10.1038/s41569-018-0064-2 · Cited by 3,690
Genetics of rheumatoid arthritis contributes to biology and drug discovery
the RACI consortium, Okada, Y., the GARNET consortium, Wu, D., Trynka, G., Raj, T., Terao, C., Ikari, K., Kochi, Y., Ohmura, K., et al. (2014) · Nature · doi:10.1038/nature12873 · Cited by 2,310
Targeting potential drivers of COVID-19: Neutrophil extracellular traps
Barnes, B. J., Adrover, J. M., Baxter-Stoltzfus, A., Borczuk, A., Cools-Lartigue, J., Crawford, J. M., Daßler-Plenker, J., Guerci, P., Huynh, C., Knight, J. S., et al. (2020) · Journal of Experimental Medicine · doi:10.1084/jem.20200652 · Cited by 1,486
The Allelic Landscape of Human Blood Cell Trait Variation and Links to Common Complex Disease
Astle, W. J., Elding, H., Jiang, T., Allen, D., Ruklisa, D., Mann, A. L., Mead, D., Bouman, H., Riveros-Mckay, F., Kostadima, M. A., et al. (2016) · Cell · doi:10.1016/j.cell.2016.10.042 · Cited by 1,224
Self-citationAge and Age-Related Diseases: Role of Inflammation Triggers and Cytokines
Rea, I. M., Gibson, D. S., McGilligan, V., McNerlan, S. E., Alexander, H. D., & Ross, O. A. (2018) · Frontiers in Immunology · doi:10.3389/fimmu.2018.00586 · Cited by 1,267
Metadata
- Authors
- Ferreira, R. C., Freitag, D. F., Cutler, A. J., Howson, J. M. M., Rainbow, D. B., Smyth, D. J., Kaptoge, S., Clarke, P., Boreham, C., Coulson, R. M., Pekalski, M. L., Chen, W.-M., Onengut-Gumuscu, S., Rich, S. S., Butterworth, A. S., Malarstig, A., Danesh, J., & Todd, J. A.
- Affiliations
- University of Cambridge (GB)
- University of Virginia (US)
- Corresponding author
- Todd, John A.
- ORCID
- Venue
- PLoS Genetics
- Publisher
- Public Library of Science (PLoS)
- Published
- 2013-04-04
- Volume
- 9
- Issue
- 4
- Pages
- e1003444
- ISSN
- 1553-7390 (ISSN-L)
- 1553-7404
- PMC
- PMC3617094
- OpenAlex
- W1991747007
- Cited by
- 316
- References
- 56
- Citations by year
- 2026: 23 · 2025: 34 · 2024: 19 · 2023: 32 · 2022: 30 · 2021: 27 · 2020: 26 · 2019: 26 · 2018: 19 · 2017: 26 · 2016: 18 · 2015: 15 · 2014: 13 · 2013: 8
- FWCI
- 9.65
- Type
- journal article
- Language
- en
- Open access
- gold
- doi.org
- Locations
- PLoS Genetics (publishedVersion, cc-by)
- Europe PMC (PubMed Central) (publishedVersion, cc-by)
- PubMed Central (publishedVersion, cc-by)
- PubMed (publishedVersion)
- DOAJ (DOAJ: Directory of Open Access Journals) (submittedVersion)
- Figshare (submittedVersion, cc-by)
- Funders
- Juvenile Diabetes Research Foundation International (9-2011-253, U01 DK062418, 068545/Z/02)
- Pfizer
- GlaxoSmithKline
- Wellcome Trust (068545/Z/02), FP7/2007–2013, 091157, 096388, G0000934, 061858, 100140, 068545, 9-2011-253, 076113, 076113/C/04/Z)
- National Institute for Health and Care Research (NF-SI-0512-10165, FP7/2007–2013, G0000934, NF-SI-0508-10275)
- British Heart Foundation (FS/09/050, RG/08/014, 068545/Z/02, G0000934, RG/08/014/24067)
- Bupa Foundation
- University of Cambridge
- University of Leicester
- European Commission (241447, 2007–2013, FP7 2007-2013, FP7/2007)
- University of Bristol
- Evelyn Trust
- Merck Sharp and Dohme
- Medical Research Council (FP7/20072013, MR/L003120/1, 068545/Z/02, G0000934)
- Cambridge Institute for Medical Research, University of Cambridge (100140)
- NIHR Cambridge Biomedical Research Centre
- National Heart, Lung, and Blood Institute (068545/Z/02, G0000934)
- National Human Genome Research Institute
- National Institute of Allergy and Infectious Diseases
- Fogarty International Center
- National Institute of Diabetes and Digestive and Kidney Diseases (DK062418, U01DK062418)
- National Institute of Child Health and Human Development
- Topics
- Life Sciences › Immunology and Microbiology › Immunology › Cytokine Signaling Pathways and Interactions
- Life Sciences › Biochemistry, Genetics and Molecular Biology › Genetics › Genetic Associations and Epidemiology
- Health Sciences › Medicine › Rheumatology › Rheumatoid Arthritis Research and Therapies
- Keywords
- IL-6 receptor, rs2228145, soluble IL-6 receptor, IL-6 signaling, type 1 diabetes, STAT3 phosphorylation, STAT1 phosphorylation, CD4+ T cells, monocytes, peripheral blood mononuclear cells, coronary artery disease, rheumatoid arthritis, atrial fibrillation, abdominal aortic aneurysm, asthma
- MeSH terms
- Alleles, Diabetes Mellitus, Type 1, Humans, Inflammation, Leukocytes, Mononuclear, Mutation, Phosphorylation, Risk Factors, Signal Transduction, Amino Acid Substitution, Receptors, Interleukin-6, Protein Isoforms, Genetic Association Studies
About these checks
Registry, retraction, Cites and statistics results are computed, not judged, with one exception: a printed reference that no index lists is read once by a model before it counts as a citation error. Claims are extracted by a model and kept only when their quote appears verbatim in the text; each cited source is then checked, with a model’s help, for whether it says what the claim relies on. Those verdicts can be wrong — read the claim’s quote and the cited source before relying on one.
Statistics and arithmetic are recomputed, not judged.
Confidence bands are shown only for fields calibrated on our annotated test set. None is calibrated yet, so no band is shown.
What counts as a claim ›How we measure confidence ›How we check this ›
Are you an author, or do you see a problem with this page? Request a review
