Cited by 58

The DOI matches its Crossref record; 3 of the 3 references it cites were found in a registry or an index.

C-Terminal Tyrosine Residue Modifications Modulate the Protective Phosphorylation of Serine 129 of α-Synuclein in a Yeast Model of Parkinson's Disease

Kleinknecht, Alexandra, Popova, Blagovesta, Lázaro, Diana F., Pinho, Raquel, Valerius, Oliver, Outeiro, Tiago F., Braus, Gerhard H.·2016·PLOS Genetics

Overview

The claims and statistics of this paper haven’t been checked yet.

Run the check — free, no account needed. It reads the open-access text and checks the sources it cites.

A few free checks a day · papers already verified open instantly · results are public

Integrity signals

Registry

Crossref · 10.1371/journal.pgen.1006098

Cites

3 of 3 references verified0 citation errors · 0 not checkable

Statistics

Figures

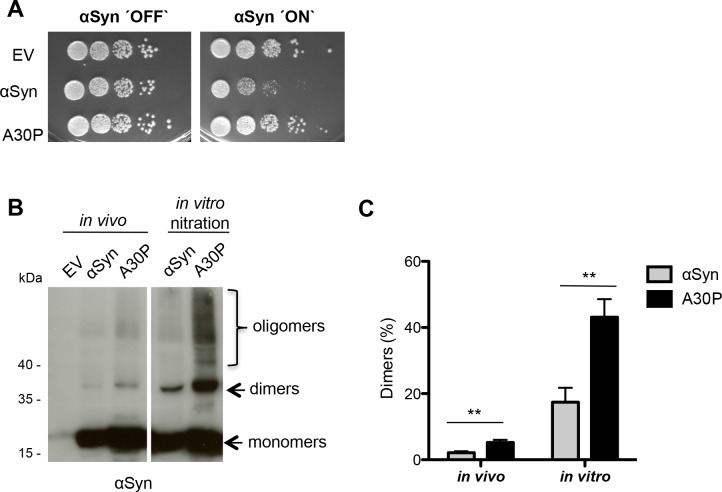
Fig 1 αSyn forms dimers in vivo. (A) Spotting analysis of yeast cells expressing C-terminally HIS6-tagged αSyn and A30P αSyn on a high copy vector (2μ) driven by the inducible GAL1-promoter on non-inducing (´OFF`: glucose) and inducing (´ON`: galactose) SC-Ura medium after 3 days. Control cells expressed only the empty vector pME2795 (EV). (B) Western blotting of αSyn and A30P enriched from cell extracts by Ni2+ pull-down with anti-αSyn antibody. In vitro nitration was carried out with 15 μg of αSyn extracts using 1 μl peroxynitrite (PON) in the presence of 1 μl 0.3 M HCl. (C) Quantification of dimers. Densitometric analysis of the immunodetection of αSyn and A30P αSyn dimers in vivo and in PON-treated samples. The amount of dimers is presented as percent of the total amount of αSyn detected per lane (monomer + dimer). Significance of differences was calculated with t-test (**, p < 0.01, n = 4).
Fig 1 αSyn forms dimers in vivo. (A) Spotting analysis of yeast cells expressing C-terminally HIS6-tagged αSyn and A30P αSyn on a high copy vector (2μ) driven by the inducible GAL1-promoter on non-inducing (´OFF`: glucose) and inducing (´ON`: galactose) SC-Ura medium after 3 days. Control cells expressed only the empty vector pME2795 (EV). (B) Western blotting of αSyn and A30P enriched from cell extracts by Ni2+ pull-down with anti-αSyn antibody. In vitro nitration was carried out with 15 μg of αSyn extracts using 1 μl peroxynitrite (PON) in the presence of 1 μl 0.3 M HCl. (C) Quantification of dimers. Densitometric analysis of the immunodetection of αSyn and A30P αSyn dimers in vivo and in PON-treated samples. The amount of dimers is presented as percent of the total amount of αSyn detected per lane (monomer + dimer). Significance of differences was calculated with t-test (**, p < 0.01, n = 4).CC BY · PubMed Central
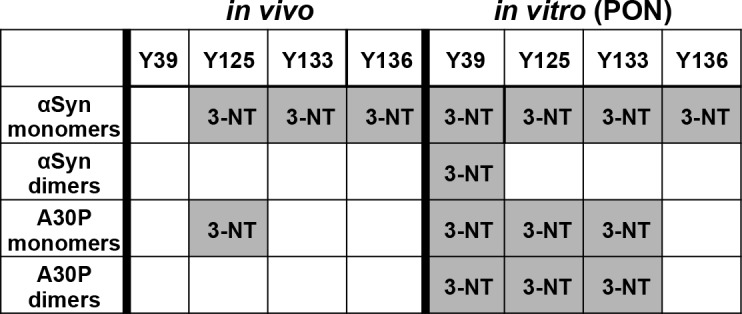
Fig 2 Determination of nitrated peptides from αSyn and A30P. αSyn and A30P were enriched by Ni2+ pull-down from yeast crude extracts and separated by SDS-PAGE. Monomeric and dimeric αSyn stained with Coomassie were excised from the gel and digested with trypsin and AspN. Untreated (in vivo) and subsequent peroxynitrite (PON) treated (in vitro) αSyn and A30P protein samples were analyzed with LC-MS for tyrosine nitration. 3-NT (3-nitrotyrosine) indicates identified nitration sites, supported by at least two peptides and two independent experiments.
Fig 2 Determination of nitrated peptides from αSyn and A30P. αSyn and A30P were enriched by Ni2+ pull-down from yeast crude extracts and separated by SDS-PAGE. Monomeric and dimeric αSyn stained with Coomassie were excised from the gel and digested with trypsin and AspN. Untreated (in vivo) and subsequent peroxynitrite (PON) treated (in vitro) αSyn and A30P protein samples were analyzed with LC-MS for tyrosine nitration. 3-NT (3-nitrotyrosine) indicates identified nitration sites, supported by at least two peptides and two independent experiments.CC BY · PubMed Central
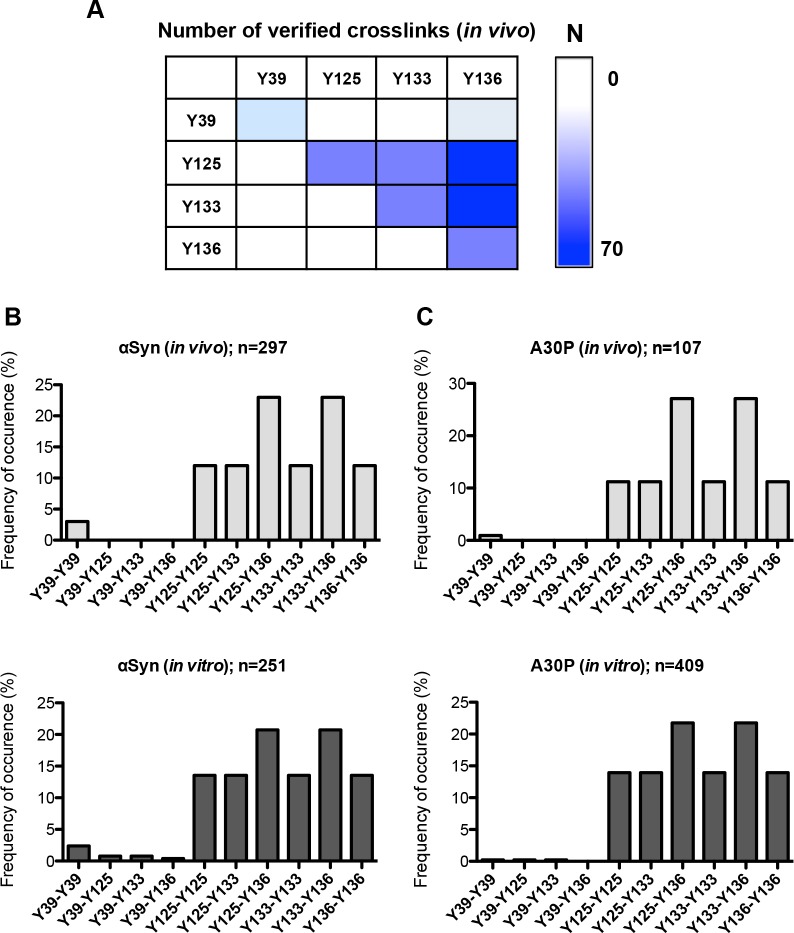
Fig 3 Determination of crosslinked peptides from αSyn and A30P. (A) Analysis of di-tyrosine dimers. Exemplary heat map diagram of the number (N) of identified di-tyrosine crosslinked peptides of the non-treated αSyn samples. (B) Distribution of all identified di-tyrosine peptides for αSyn. Identified combinations of crosslinked peptides are presented as percentage of n (n = total number of MS2 spectra verified as crosslinked peptides). (C) Distribution of all identified di-tyrosine peptides for A30P.
Fig 3 Determination of crosslinked peptides from αSyn and A30P. (A) Analysis of di-tyrosine dimers. Exemplary heat map diagram of the number (N) of identified di-tyrosine crosslinked peptides of the non-treated αSyn samples. (B) Distribution of all identified di-tyrosine peptides for αSyn. Identified combinations of crosslinked peptides are presented as percentage of n (n = total number of MS2 spectra verified as crosslinked peptides). (C) Distribution of all identified di-tyrosine peptides for A30P.CC BY · PubMed Central
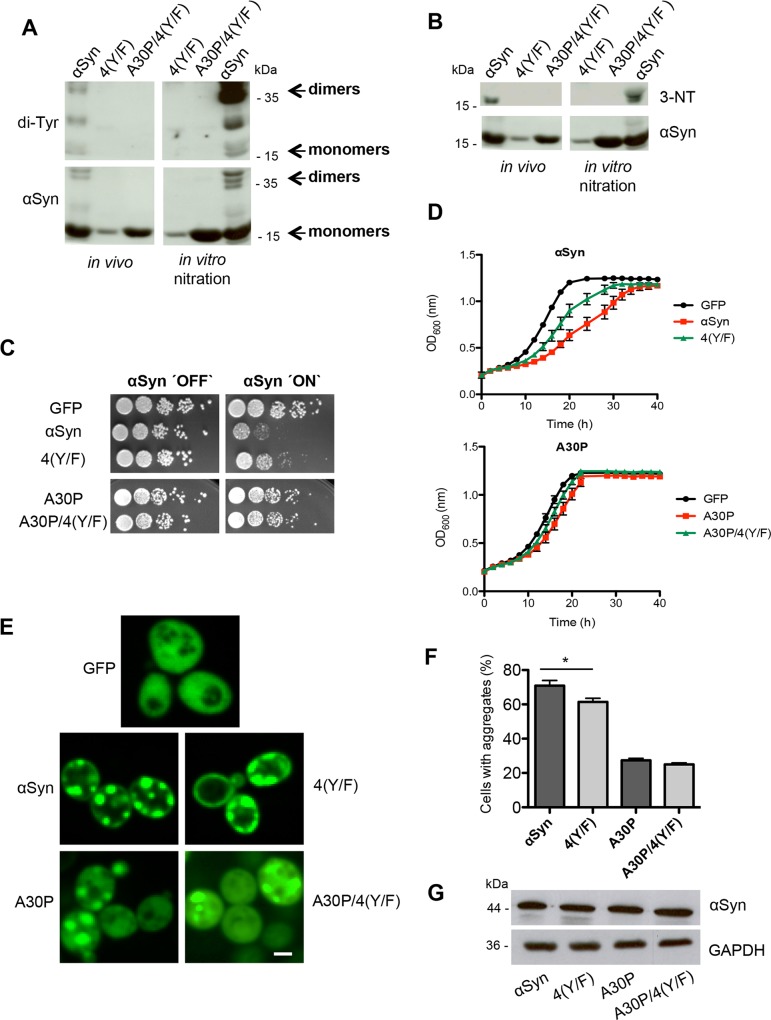
Fig 4 Blocking of αSyn tyrosine nitration decreases aggregation and cytotoxicity. (A) Expression of αSyn, A30P, 4(Y/F) and A30P/4(Y/F) αSyn was induced for 12 h in galactose-containing medium and the proteins were enriched by Ni2+ pull-down from yeast cell extracts. For in vitro nitration, 1 μl peroxynitrite (PON) was mixed with 15 μg of αSyn extracts in the presence of 1 μl 0.3 M HCl. Western blotting with di-tyrosine antibody reveals a major band at about 36 kDa, corresponding to dimers. Additional bands with lower molecular weights are observed, probably due to intramolecular di-tyrosine crosslinking. The same membrane was stripped and re-probed with αSyn antibody. (B) Western blotting using 3-nitro-tyrosine antibody (3-NT). Phenylalanine codon substitutions eliminate immunoreactivity. The same membrane was stripped and re-probed with αSyn antibody. (C) Spotting analysis of yeast cells expressing GAL1-driven αSyn, A30P, 4(Y/F), A30P/4(Y/F) αSyn and GFP (control). Yeast cells were spotted in 10-fold dilutions on SC-Ura plates containing glucose (αSyn ‘OFF’) or galactose (αSyn ‘ON’). (D) Cell growth analysis of yeast cells expressing αSyn, A30P, 4(Y/F), A30P/4(Y/F) αSyn and GFP (control) in galactose-containing SC-Ura medium for 40 h. Error bars represent standard deviations of three independent experiments. (E) Fluorescence microscopy of yeast cells, expressing indicated αSyn-GFP variants after 6 h of induction in galactose-containing medium. Scale bar: 1 μm. (F) Quantification of the percentage of cells displaying aggregates after 6 h induction in galactose-containing medium. Significance of differences was calculated with t-test (*, p < 0.05, n = 6). (G) Western blotting analysis of protein crude extracts of GFP-tagged αSyn, 4(Y/F), A30P and A30P/4(Y/F) after 6 h induction in galactose-containing medium. GAPDH antibody was used as loading control.
Fig 4 Blocking of αSyn tyrosine nitration decreases aggregation and cytotoxicity. (A) Expression of αSyn, A30P, 4(Y/F) and A30P/4(Y/F) αSyn was induced for 12 h in galactose-containing medium and the proteins were enriched by Ni2+ pull-down from yeast cell extracts. For in vitro nitration, 1 μl peroxynitrite (PON) was mixed with 15 μg of αSyn extracts in the presence of 1 μl 0.3 M HCl. Western blotting with di-tyrosine antibody reveals a major band at about 36 kDa, corresponding to dimers. Additional bands with lower molecular weights are observed, probably due to intramolecular di-tyrosine crosslinking. The same membrane was stripped and re-probed with αSyn antibody. (B) Western blotting using 3-nitro-tyrosine antibody (3-NT). Phenylalanine codon substitutions eliminate immunoreactivity. The same membrane was stripped and re-probed with αSyn antibody. (C) Spotting analysis of yeast cells expressing GAL1-driven αSyn, A30P, 4(Y/F), A30P/4(Y/F) αSyn and GFP (control). Yeast cells were spotted in 10-fold dilutions on SC-Ura plates containing glucose (αSyn ‘OFF’) or galactose (αSyn ‘ON’). (D) Cell growth analysis of yeast cells expressing αSyn, A30P, 4(Y/F), A30P/4(Y/F) αSyn and GFP (control) in galactose-containing SC-Ura medium for 40 h. Error bars represent standard deviations of three independent experiments. (E) Fluorescence microscopy of yeast cells, expressing indicated αSyn-GFP variants after 6 h of induction in galactose-containing medium. Scale bar: 1 μm. (F) Quantification of the percentage of cells displaying aggregates after 6 h induction in galactose-containing medium. Significance of differences was calculated with t-test (*, p < 0.05, n = 6). (G) Western blotting analysis of protein crude extracts of GFP-tagged αSyn, 4(Y/F), A30P and A30P/4(Y/F) after 6 h induction in galactose-containing medium. GAPDH antibody was used as loading control.CC BY · PubMed Central
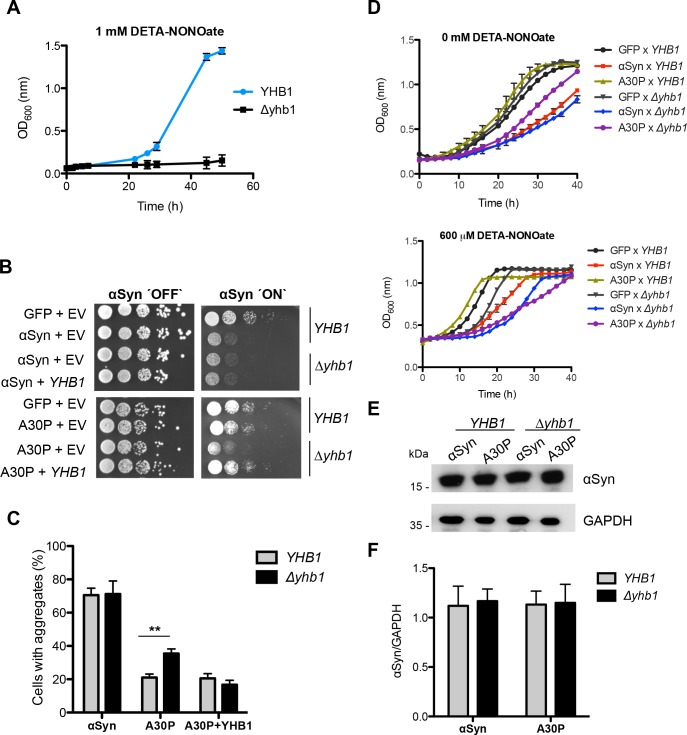
Fig 5 The nitric oxide oxidoreductase Yhb1 reduces A30P aggregation and toxicity. (A) Cell growth comparison of wild-type YHB1 and mutant Δyhb1 yeast cells in the presence of the NO stress-mediating drug DETA-NONOate (1 mM) in liquid galactose-containing SC-Ura medium. Error bars indicate standard deviations of three independent experiments. (B) Spotting analysis of YHB1 and Δyhb1 yeast cells expressing αSyn (upper boxes) or A30P (lower boxes) compared to GFP and empty vector (EV) as control on non-inducing and galactose-inducing SC-Ura medium after 3 days. (C) Quantification of the percentage of cells displaying αSyn aggregates after 6 h induction in galactose-containing medium. Significance of differences was calculated with t-test (**, p < 0.01, n = 6). (D) Cell growth analysis of YHB1 and Δyhb1 yeast cells expressing αSyn, A30P, 4(Y/F), A30P/4(Y/F) and GFP (control) after 40 h induction in galactose-containing SC-Ura medium. (upper panel,—DETA-NONOate; lower panel, + 600 μM DETA-NONOate). Error bars show standard deviations of three independent experiments. (E) Western blotting analysis of protein crude extracts of αSyn and A30P expressed in YHB1 and Δyhb1 yeast after 6 h induction in galactose-containing medium. GAPDH antibody was used as loading control. (F) Quantification of αSyn and A30P levels in YHB1 and Δyhb1 yeast cells. Densitometric analysis of the immunodetection of αSyn and A30P relative to the intensity obtained for GAPDH (n = 3).
Fig 5 The nitric oxide oxidoreductase Yhb1 reduces A30P aggregation and toxicity. (A) Cell growth comparison of wild-type YHB1 and mutant Δyhb1 yeast cells in the presence of the NO stress-mediating drug DETA-NONOate (1 mM) in liquid galactose-containing SC-Ura medium. Error bars indicate standard deviations of three independent experiments. (B) Spotting analysis of YHB1 and Δyhb1 yeast cells expressing αSyn (upper boxes) or A30P (lower boxes) compared to GFP and empty vector (EV) as control on non-inducing and galactose-inducing SC-Ura medium after 3 days. (C) Quantification of the percentage of cells displaying αSyn aggregates after 6 h induction in galactose-containing medium. Significance of differences was calculated with t-test (**, p < 0.01, n = 6). (D) Cell growth analysis of YHB1 and Δyhb1 yeast cells expressing αSyn, A30P, 4(Y/F), A30P/4(Y/F) and GFP (control) after 40 h induction in galactose-containing SC-Ura medium. (upper panel,—DETA-NONOate; lower panel, + 600 μM DETA-NONOate). Error bars show standard deviations of three independent experiments. (E) Western blotting analysis of protein crude extracts of αSyn and A30P expressed in YHB1 and Δyhb1 yeast after 6 h induction in galactose-containing medium. GAPDH antibody was used as loading control. (F) Quantification of αSyn and A30P levels in YHB1 and Δyhb1 yeast cells. Densitometric analysis of the immunodetection of αSyn and A30P relative to the intensity obtained for GAPDH (n = 3).CC BY · PubMed Central
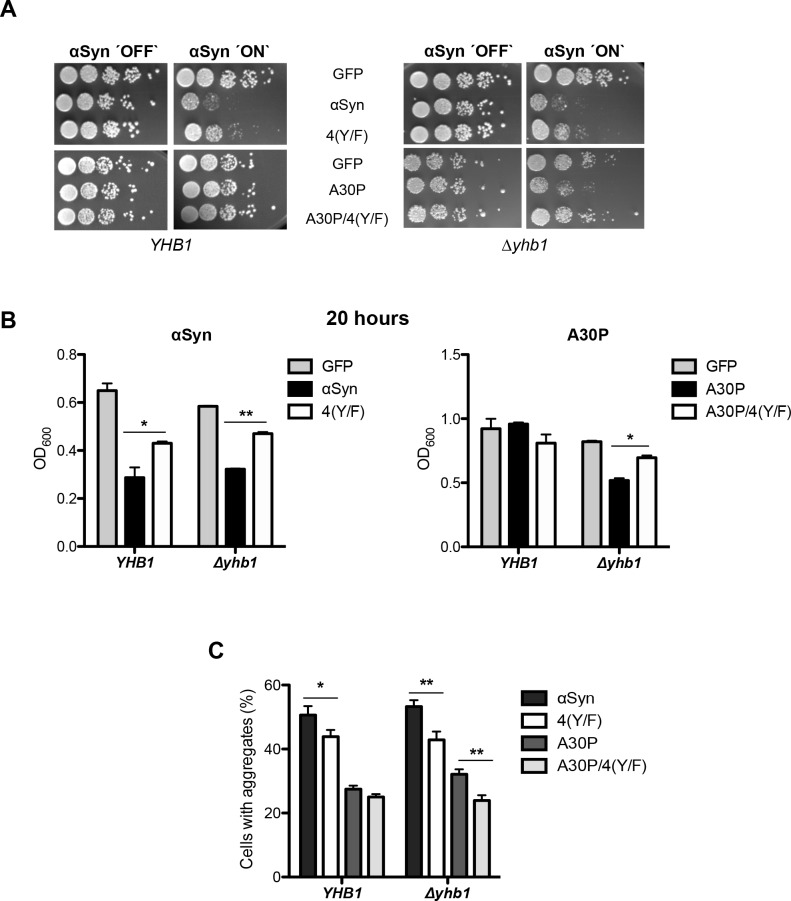
Fig 6 Tyrosine mutation of A30P decreases toxicity in Δyhb1. (A) Spotting analysis of αSyn, A30P, 4(Y/F) αSyn, A30P/4(Y/F) and GFP (control) expressed in YHB1 and Δyhb1 yeast on non-inducing and galactose-inducing SC-Ura plates after 3 days of growth. (B) Cell growth analysis of YHB1 and Δyhb1 yeast expressing αSyn, A30P, 4(Y/F), A30P/4(Y/F) and GFP (control) at time point 20 h. Significance of differences was calculated with t-test (*, p < 0.05; **, p < 0.01, n = 3). (C) Quantification of the percentage of cells displaying αSyn aggregates after 6 h induction in galactose-containing SC-Ura medium. Significance of differences was calculated with t-test (*, p < 0.05, **, p < 0.01, n = 6).
Fig 6 Tyrosine mutation of A30P decreases toxicity in Δyhb1. (A) Spotting analysis of αSyn, A30P, 4(Y/F) αSyn, A30P/4(Y/F) and GFP (control) expressed in YHB1 and Δyhb1 yeast on non-inducing and galactose-inducing SC-Ura plates after 3 days of growth. (B) Cell growth analysis of YHB1 and Δyhb1 yeast expressing αSyn, A30P, 4(Y/F), A30P/4(Y/F) and GFP (control) at time point 20 h. Significance of differences was calculated with t-test (*, p < 0.05; **, p < 0.01, n = 3). (C) Quantification of the percentage of cells displaying αSyn aggregates after 6 h induction in galactose-containing SC-Ura medium. Significance of differences was calculated with t-test (*, p < 0.05, **, p < 0.01, n = 6).CC BY · PubMed Central
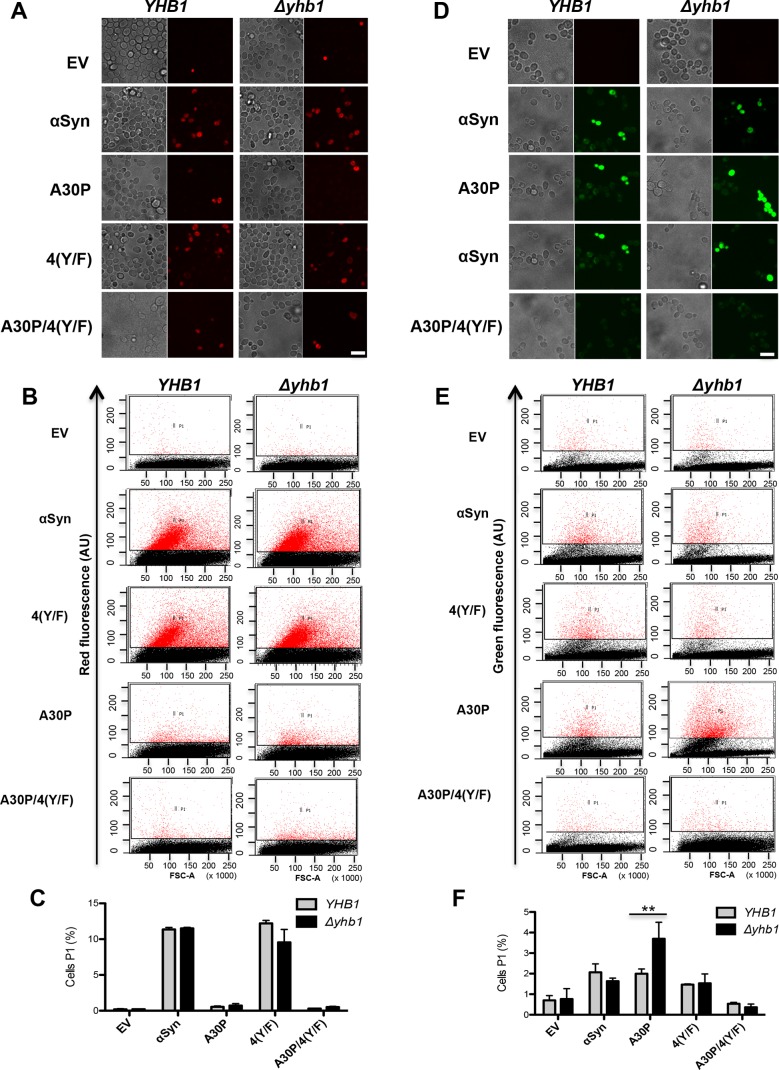
Fig 7 YHB1 deletion increases accumulation of reactive nitrogen species (RNS) in A30P expressing cells. (A) αSyn, A30P, 4(Y/F) and A30P/4(Y/F) were induced in galactose-containing medium for 6 h in YHB1 wild-type or Δyhb1 deletion yeast strains. Cells were incubated with dihydrorhodamine 123 (DHR123) as an indicator of high intracellular ROS accumulation for 1.5 h and analyzed by live-cell fluorescence microscopy. Scale bar = 5 μm. (B) Fluorescent intensity of cells from (A), assessed with flow cytometry analysis. Forward scatter (FSC) and DHR123 fluorescence of cells after 6 h induction of αSyn expression. (C) Quantification of αSyn, A30P, 4(Y/F) and A30P/4(Y/F) expressing cells displaying ROS stained by DHR123 using flow cytometry. The percentage of the sub-population of yeast cells with higher fluorescent intensities (P1) than the background is presented. (D) Microscopy analysis of RNS stained cells. αSyn, A30P, 4(Y/F) and A30P/4(Y/F) were induced in galactose-containing SC-Ura medium for 6 h in YHB1 and Δyhb1 yeast strains. Cells were incubated with DAF-2 DA for 1 h at 30°C for visualization of RNS and analyzed by live-cell fluorescence microscopy. Scale bar = 5 μm. (E) Fluorescent intensity of cells from (D), assessed with flow cytometry analysis. Forward scatter (FSC) and DAF-2 DA fluorescence of cells after 6 h induction of αSyn expression. (F) Quantification of αSyn, A30P, 4(Y/F) and A30P/4(Y/F) expressing cells displaying RNS stained by DAF-2 DA using flow cytometry. The percentage of the sub-population of yeast cells with higher fluorescent intensities (P1) than the background is presented. Significance of differences was calculated with t-test (**, p < 0.01, n = 3).
Fig 7 YHB1 deletion increases accumulation of reactive nitrogen species (RNS) in A30P expressing cells. (A) αSyn, A30P, 4(Y/F) and A30P/4(Y/F) were induced in galactose-containing medium for 6 h in YHB1 wild-type or Δyhb1 deletion yeast strains. Cells were incubated with dihydrorhodamine 123 (DHR123) as an indicator of high intracellular ROS accumulation for 1.5 h and analyzed by live-cell fluorescence microscopy. Scale bar = 5 μm. (B) Fluorescent intensity of cells from (A), assessed with flow cytometry analysis. Forward scatter (FSC) and DHR123 fluorescence of cells after 6 h induction of αSyn expression. (C) Quantification of αSyn, A30P, 4(Y/F) and A30P/4(Y/F) expressing cells displaying ROS stained by DHR123 using flow cytometry. The percentage of the sub-population of yeast cells with higher fluorescent intensities (P1) than the background is presented. (D) Microscopy analysis of RNS stained cells. αSyn, A30P, 4(Y/F) and A30P/4(Y/F) were induced in galactose-containing SC-Ura medium for 6 h in YHB1 and Δyhb1 yeast strains. Cells were incubated with DAF-2 DA for 1 h at 30°C for visualization of RNS and analyzed by live-cell fluorescence microscopy. Scale bar = 5 μm. (E) Fluorescent intensity of cells from (D), assessed with flow cytometry analysis. Forward scatter (FSC) and DAF-2 DA fluorescence of cells after 6 h induction of αSyn expression. (F) Quantification of αSyn, A30P, 4(Y/F) and A30P/4(Y/F) expressing cells displaying RNS stained by DAF-2 DA using flow cytometry. The percentage of the sub-population of yeast cells with higher fluorescent intensities (P1) than the background is presented. Significance of differences was calculated with t-test (**, p < 0.01, n = 3).CC BY · PubMed Central
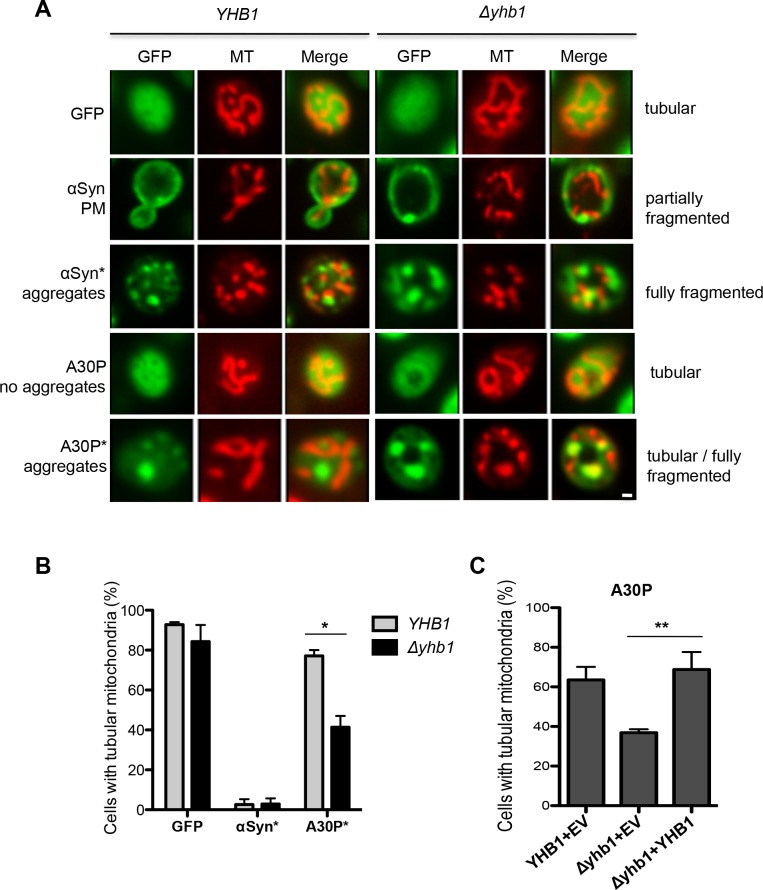
Fig 8 Yhb1 protects mitochondria from A30P toxicity. (A) Live-cell fluorescence microscopy of YHB1 compared to Δyhb1 yeast cells expressing GFP (control), αSyn or A30P after 6 h induction in galactose-containing medium. MitoTracker Red was used to visualize mitochondria in the cells (MT panel). αSyn expressing cells with plasma membrane localization (PM) and with aggregates are visualized. Scale bar = 1 μM. (B) Quantification of yeast cells with tubular mitochondrial network. GFP: percentage of all cells with tubular mitochondria; αSyn* and A30P*: percentage of cells with aggregates, showing tubular mitochondria. At least 50 cells were counted per cell type and experiment. Significance of differences was calculated with t-test (*, p < 0.05, n = 4). (C) Quantification of yeast cells with tubular mitochondrial network for rescue of A30P phenotype. A30P with empty vector (EV) in YHB1 and Δyhb1 strain and A30P co-transformed with YHB1 on low-copy vector in Δyhb1 strain. A30P*: percentage of cells with aggregates, showing tubular mitochondria. Significance of differences was calculated with t-test (**, p < 0.01, n = 3).
Fig 8 Yhb1 protects mitochondria from A30P toxicity. (A) Live-cell fluorescence microscopy of YHB1 compared to Δyhb1 yeast cells expressing GFP (control), αSyn or A30P after 6 h induction in galactose-containing medium. MitoTracker Red was used to visualize mitochondria in the cells (MT panel). αSyn expressing cells with plasma membrane localization (PM) and with aggregates are visualized. Scale bar = 1 μM. (B) Quantification of yeast cells with tubular mitochondrial network. GFP: percentage of all cells with tubular mitochondria; αSyn* and A30P*: percentage of cells with aggregates, showing tubular mitochondria. At least 50 cells were counted per cell type and experiment. Significance of differences was calculated with t-test (*, p < 0.05, n = 4). (C) Quantification of yeast cells with tubular mitochondrial network for rescue of A30P phenotype. A30P with empty vector (EV) in YHB1 and Δyhb1 strain and A30P co-transformed with YHB1 on low-copy vector in Δyhb1 strain. A30P*: percentage of cells with aggregates, showing tubular mitochondria. Significance of differences was calculated with t-test (**, p < 0.01, n = 3).CC BY · PubMed Central
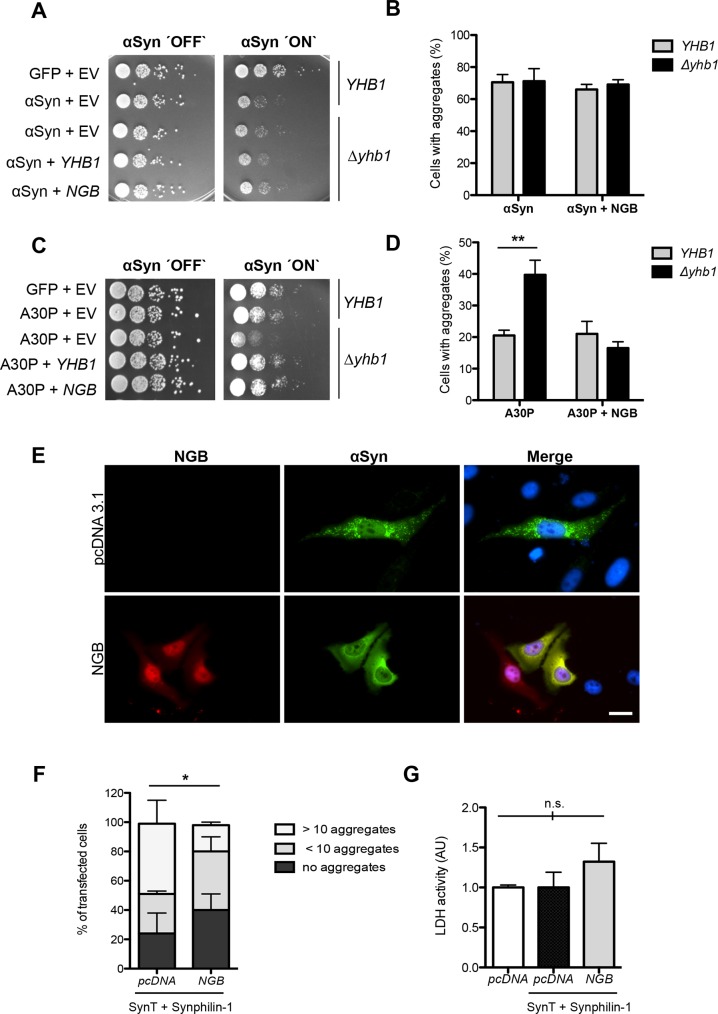
Fig 9 The human NGB gene for neuroglobin alters A30P and αSyn aggregation in yeast and mammalian cells. (A) Spotting analysis of YHB1 and Δyhb1 yeast cells co-expressing αSyn and GFP (control) with either empty vector as control or YHB1 and NGB, respectively, on non-inducing and galactose-inducing SC-Ura medium after 3 days. (B) Quantification of the percentage of cells displaying αSyn aggregates after 6 h induction in galactose-containing medium (n = 3). (C) Spotting analysis of YHB1 and Δyhb1 yeast cells co-expressing A30P and GFP (control) with either empty vector (pME2788) as control or YHB1 and NGB, respectively, on non-inducing and galactose-inducing SC-Ura medium after 3 days. (D) Quantification of the percentage of cells displaying A30P aggregates after 6 h induction in galactose-containing medium. Significance of differences was calculated with t-test (**, p < 0.01, n = 3). (E) Fluorescence microscopy of H4 cells co-expressing SynT, synphilin-1 and pcDNA (control) or NGB-mCherry. Nuclei are stained with Hoechst dye (blue). Scale bar = 30 μm. (F) Quantification of the percentage of H4 cells displaying αSyn inclusions after 48 h after transfection. Cells were classified into three groups according to the number of αSyn-immunoreactive inclusions observed: cells with 10 inclusions, cells with less than 10 inclusions and cells without inclusions. Significance of differences was calculated with t-test (*, p < 0.05, n = 3). (G) Lactate dehydrogenase (LDH) activity measurements support that NGB is non-toxic for H4 cells. H4 cells transfected with empty mammalian expression vector pcDNA3.1, with empty pcDNA3.1 or pcDNA3.1 encoding neuroglobin-mCherry (NGB) together with SynT and synphilin-1 (SynT+Synphilin-1) were analyzed. Media from indicated H4 cells were collected and the secretion of lactate LDH was determined as a measure of cytotoxicity. Significance of differences was calculated with t-test (not significant (n.s.); n = 3).
Fig 9 The human NGB gene for neuroglobin alters A30P and αSyn aggregation in yeast and mammalian cells. (A) Spotting analysis of YHB1 and Δyhb1 yeast cells co-expressing αSyn and GFP (control) with either empty vector as control or YHB1 and NGB, respectively, on non-inducing and galactose-inducing SC-Ura medium after 3 days. (B) Quantification of the percentage of cells displaying αSyn aggregates after 6 h induction in galactose-containing medium (n = 3). (C) Spotting analysis of YHB1 and Δyhb1 yeast cells co-expressing A30P and GFP (control) with either empty vector (pME2788) as control or YHB1 and NGB, respectively, on non-inducing and galactose-inducing SC-Ura medium after 3 days. (D) Quantification of the percentage of cells displaying A30P aggregates after 6 h induction in galactose-containing medium. Significance of differences was calculated with t-test (**, p < 0.01, n = 3). (E) Fluorescence microscopy of H4 cells co-expressing SynT, synphilin-1 and pcDNA (control) or NGB-mCherry. Nuclei are stained with Hoechst dye (blue). Scale bar = 30 μm. (F) Quantification of the percentage of H4 cells displaying αSyn inclusions after 48 h after transfection. Cells were classified into three groups according to the number of αSyn-immunoreactive inclusions observed: cells with 10 inclusions, cells with less than 10 inclusions and cells without inclusions. Significance of differences was calculated with t-test (*, p < 0.05, n = 3). (G) Lactate dehydrogenase (LDH) activity measurements support that NGB is non-toxic for H4 cells. H4 cells transfected with empty mammalian expression vector pcDNA3.1, with empty pcDNA3.1 or pcDNA3.1 encoding neuroglobin-mCherry (NGB) together with SynT and synphilin-1 (SynT+Synphilin-1) were analyzed. Media from indicated H4 cells were collected and the secretion of lactate LDH was determined as a measure of cytotoxicity. Significance of differences was calculated with t-test (not significant (n.s.); n = 3).CC BY · PubMed Central
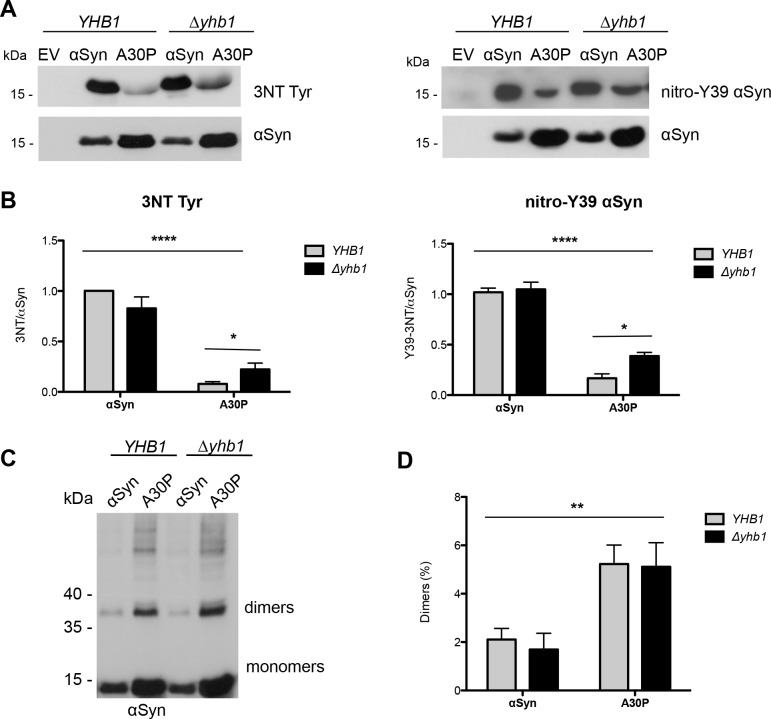
Fig 10 Yhb1 affects nitration but not dimerization of αSyn and A30P. (A) Immunoblotting analysis of 3-nitrotyrosine using 3-nitrotyrosine antibody (left) and nitro-Y39 αSyn antibody (right). Protein expression was induced for 12 h in galactose-containing SC-Ura medium. Concentrated protein extracts of Ni2+ pull down-enriched αSyn and A30P αSyn from YHB1 and Δyhb1 yeast cells were applied. Cells expressing empty vector (EV) served as control. The same membranes were stripped and re-probed with αSyn antibody. (B) Quantification of αSyn and A30P nitration levels in YHB1 and Δyhb1 yeast cells. Densitometric analysis of the immunodetection of nitrated αSyn and A30P relative to the intensity obtained for αSyn. Significance of differences was calculated with one-way ANOVA with Bonferroni’s multiple comparison test (*, p < 0.05; ****, p < 0.0001; n = 3). (C) Western blotting of αSyn enriched by Ni2+ pull-down with αSyn antibody. (D) Ratio of dimers relative to the sum of monomers and dimers. Densitometric analysis of the immunodetection of αSyn and A30P αSyn dimers, presented as percent of the total amount of αSyn detected per lane (monomer + dimer). Significance of differences was calculated with one-way ANOVA (**, p < 0.01; n = 4).
Fig 10 Yhb1 affects nitration but not dimerization of αSyn and A30P. (A) Immunoblotting analysis of 3-nitrotyrosine using 3-nitrotyrosine antibody (left) and nitro-Y39 αSyn antibody (right). Protein expression was induced for 12 h in galactose-containing SC-Ura medium. Concentrated protein extracts of Ni2+ pull down-enriched αSyn and A30P αSyn from YHB1 and Δyhb1 yeast cells were applied. Cells expressing empty vector (EV) served as control. The same membranes were stripped and re-probed with αSyn antibody. (B) Quantification of αSyn and A30P nitration levels in YHB1 and Δyhb1 yeast cells. Densitometric analysis of the immunodetection of nitrated αSyn and A30P relative to the intensity obtained for αSyn. Significance of differences was calculated with one-way ANOVA with Bonferroni’s multiple comparison test (*, p < 0.05; ****, p < 0.0001; n = 3). (C) Western blotting of αSyn enriched by Ni2+ pull-down with αSyn antibody. (D) Ratio of dimers relative to the sum of monomers and dimers. Densitometric analysis of the immunodetection of αSyn and A30P αSyn dimers, presented as percent of the total amount of αSyn detected per lane (monomer + dimer). Significance of differences was calculated with one-way ANOVA (**, p < 0.01; n = 4).CC BY · PubMed Central
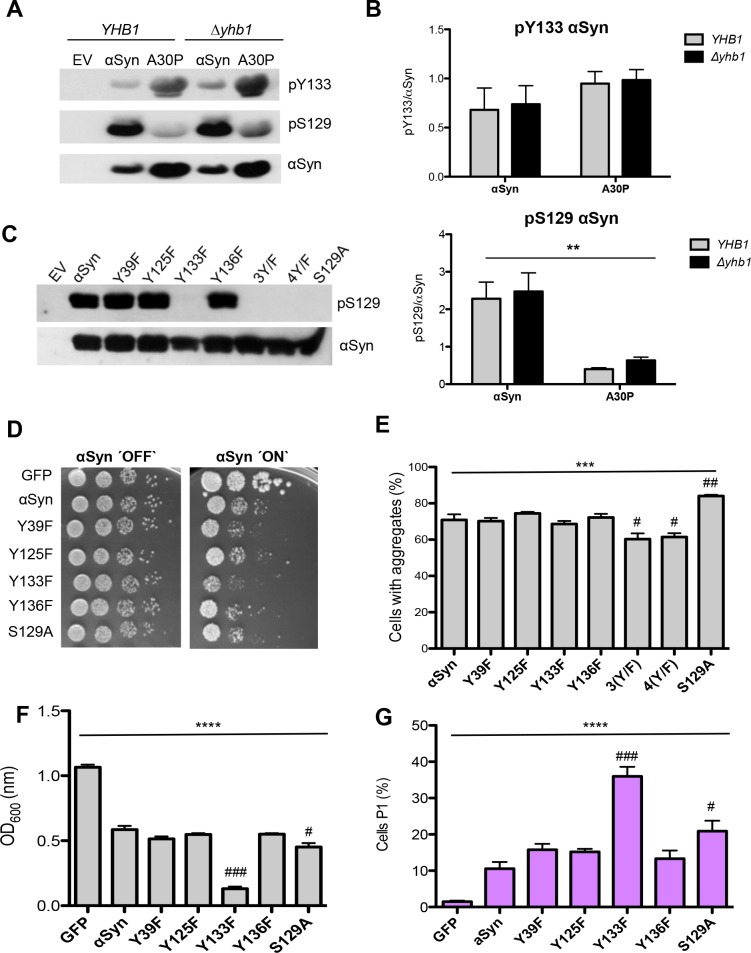
Fig 11 Tyrosine 133 is required for phosphorylation of αSyn at serine 129. (A) Western blotting of αSyn and A30P expressed in YHB1 and Δyhb1 yeast enriched by Ni2+ pull-down, using Y133 phosphorylation-specific αSyn antibody (pY133) and S129 phosphorylation-specific αSyn antibody (pS129). The same membrane was stripped and re-probed with αSyn antibody. (B) Quantification of αSyn and A30P Y133- and S129-phosphorylation levels in YHB1 and Δyhb1 yeast cells. Densitometric analysis of the immunodetection of pY133, pS129 αSyn and A30P relative to the intensity obtained for αSyn. Significance of differences was calculated with one-way ANOVA test (**, p < 0.01; n = 4). (C) Western blotting of crude extracts from yeast cells, expressing different αSyn variants after 6 h induction of protein expression using S129 phosphorylation-specific αSyn antibody (pS129) and αSyn antibody. Cells expressing S129A mutant served as control. (D) Spotting analysis of αSyn and indicated mutant strains, driven by the inducible GAL1-promoter on non-inducing (´OFF`: glucose) and inducing (´ON`: galactose) SC-Ura medium after 3 days. Cells expressing GFP served as control. (E) Quantification of the percentage of cells displaying αSyn aggregates after 6 h induction in galactose-containing SC-Ura medium. Significance of differences was calculated with one-way ANOVA (***, p < 0.001) or Dunnett’s multiple comparison test (#, p < 0.05, ##, p < 0.01 versus αSyn; n = 6). (F) Cell growth analysis of cells expressing different αSyn variants and GFP (control) after 20 h induction of expression. Significance of differences was calculated with one-way ANOVA (****, p < 0.0001) or Dunnett’s multiple comparison test (#, p < 0.05; ###, p < 0.001, n = 4). (G) Quantification of cells expressing different αSyn variants and GFP (control) displaying Propidium Iodide (PI) fluorescence after 20 h induction of αSyn expression, assessed by flow cytometry. The percentage of PI-positive yeast cells with higher fluorescent intensities (P1) than the background is presented. Significance of differences was calculated with one-way ANOVA (****, p < 0.0001) or Dunnett’s multiple comparison test (#, p < 0.05; ###, p < 0.001 versus αSyn; n = 4).
Fig 11 Tyrosine 133 is required for phosphorylation of αSyn at serine 129. (A) Western blotting of αSyn and A30P expressed in YHB1 and Δyhb1 yeast enriched by Ni2+ pull-down, using Y133 phosphorylation-specific αSyn antibody (pY133) and S129 phosphorylation-specific αSyn antibody (pS129). The same membrane was stripped and re-probed with αSyn antibody. (B) Quantification of αSyn and A30P Y133- and S129-phosphorylation levels in YHB1 and Δyhb1 yeast cells. Densitometric analysis of the immunodetection of pY133, pS129 αSyn and A30P relative to the intensity obtained for αSyn. Significance of differences was calculated with one-way ANOVA test (**, p < 0.01; n = 4). (C) Western blotting of crude extracts from yeast cells, expressing different αSyn variants after 6 h induction of protein expression using S129 phosphorylation-specific αSyn antibody (pS129) and αSyn antibody. Cells expressing S129A mutant served as control. (D) Spotting analysis of αSyn and indicated mutant strains, driven by the inducible GAL1-promoter on non-inducing (´OFF`: glucose) and inducing (´ON`: galactose) SC-Ura medium after 3 days. Cells expressing GFP served as control. (E) Quantification of the percentage of cells displaying αSyn aggregates after 6 h induction in galactose-containing SC-Ura medium. Significance of differences was calculated with one-way ANOVA (***, p < 0.001) or Dunnett’s multiple comparison test (#, p < 0.05, ##, p < 0.01 versus αSyn; n = 6). (F) Cell growth analysis of cells expressing different αSyn variants and GFP (control) after 20 h induction of expression. Significance of differences was calculated with one-way ANOVA (****, p < 0.0001) or Dunnett’s multiple comparison test (#, p < 0.05; ###, p < 0.001, n = 4). (G) Quantification of cells expressing different αSyn variants and GFP (control) displaying Propidium Iodide (PI) fluorescence after 20 h induction of αSyn expression, assessed by flow cytometry. The percentage of PI-positive yeast cells with higher fluorescent intensities (P1) than the background is presented. Significance of differences was calculated with one-way ANOVA (****, p < 0.0001) or Dunnett’s multiple comparison test (#, p < 0.05; ###, p < 0.001 versus αSyn; n = 4).CC BY · PubMed Central
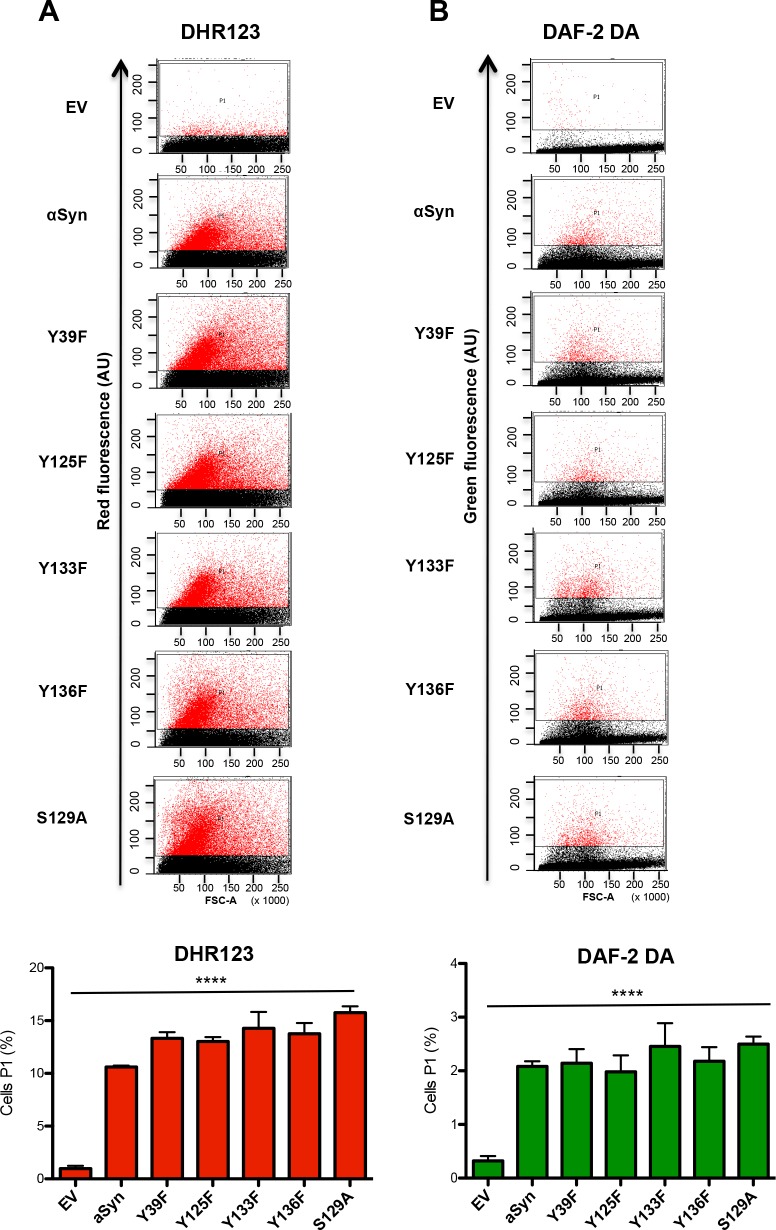
Fig 12 Tyrosine 133 mutation does not alter the accumulation of reactive oxygen and nitrogen species. (A, B) Quantification of cells expressing different αSyn variants displaying ROS and RNS assessed with flow cytometry analysis. αSyn expression was induced for 6 h and the cells were stained for 1.5 h with DHR123 to visualize ROS (A) or with DAF-2 DA to visualize RNS (B). Forward scatter (FSC) and DHR123 (A) or DAF-2 DA (B) fluorescence of the cells, showing one representative result from at least four independent experiments. The percentage of the sub-populations of yeast cells with higher fluorescent intensities (P1) than the background are presented in the lower panels. Significance of differences was calculated with one-way ANOVA (****, p < 0.0001).
Fig 12 Tyrosine 133 mutation does not alter the accumulation of reactive oxygen and nitrogen species. (A, B) Quantification of cells expressing different αSyn variants displaying ROS and RNS assessed with flow cytometry analysis. αSyn expression was induced for 6 h and the cells were stained for 1.5 h with DHR123 to visualize ROS (A) or with DAF-2 DA to visualize RNS (B). Forward scatter (FSC) and DHR123 (A) or DAF-2 DA (B) fluorescence of the cells, showing one representative result from at least four independent experiments. The percentage of the sub-populations of yeast cells with higher fluorescent intensities (P1) than the background are presented in the lower panels. Significance of differences was calculated with one-way ANOVA (****, p < 0.0001).CC BY · PubMed Central
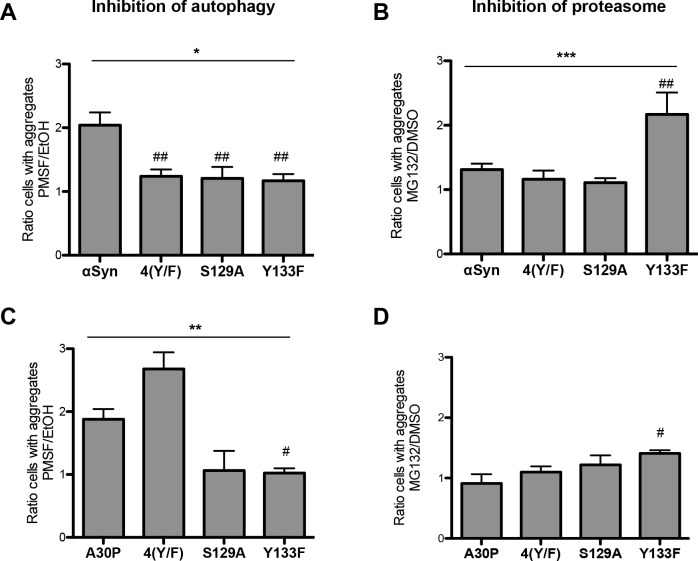
Fig 13 αSyn aggregate clearance after promoter shut-off. (A, C) Quantification of cells displaying aggregates of αSyn (A) and A30P (C) upon inhibition of autophagy by PMSF. Cells expressing αSyn (A) or A30P (C) and its 4(Y/F), S129A and Y133F variants were incubated in 2% galactose-containing media for 4 h and shifted to 2% glucose-containing media supplemented with 1 mM PMSF dissolved in EtOH and only EtOH as a control. Cells with aggregates were counted after 4 h GAL1-promoter shut-off and presented as a ratio to the control (EtOH). Significance of differences was calculated with one-way ANOVA (*, p < 0.05; **, p < 0.01) or Dunnett’s multiple comparison test (#, p < 0.05; ##, p < 0.01 versus αSyn; n = 4). (B, D) Quantification of cells displaying aggregates of αSyn (B) and A30P (D) upon inhibition of the proteasome by MG132. Cells expressing αSyn (B) or A30P (D) and the indicated 4(Y/F), S129A and Y133F variants were incubated in 2% galactose-containing media for 4 h and shifted to glucose medium, supplemented with 75 μM MG132, dissolved in DMSO or only DMSO as a control. Cells with aggregates were counted after 4 h GAL1-promoter shut off and presented as a ratio to the control (DMSO). Significance of differences was calculated with one-way ANOVA (***, p < 0.001) or Dunnett’s multiple comparison test (#, p < 0.05; ##, p < 0.01 versus αSyn; n = 4).
Fig 13 αSyn aggregate clearance after promoter shut-off. (A, C) Quantification of cells displaying aggregates of αSyn (A) and A30P (C) upon inhibition of autophagy by PMSF. Cells expressing αSyn (A) or A30P (C) and its 4(Y/F), S129A and Y133F variants were incubated in 2% galactose-containing media for 4 h and shifted to 2% glucose-containing media supplemented with 1 mM PMSF dissolved in EtOH and only EtOH as a control. Cells with aggregates were counted after 4 h GAL1-promoter shut-off and presented as a ratio to the control (EtOH). Significance of differences was calculated with one-way ANOVA (*, p < 0.05; **, p < 0.01) or Dunnett’s multiple comparison test (#, p < 0.05; ##, p < 0.01 versus αSyn; n = 4). (B, D) Quantification of cells displaying aggregates of αSyn (B) and A30P (D) upon inhibition of the proteasome by MG132. Cells expressing αSyn (B) or A30P (D) and the indicated 4(Y/F), S129A and Y133F variants were incubated in 2% galactose-containing media for 4 h and shifted to glucose medium, supplemented with 75 μM MG132, dissolved in DMSO or only DMSO as a control. Cells with aggregates were counted after 4 h GAL1-promoter shut off and presented as a ratio to the control (DMSO). Significance of differences was calculated with one-way ANOVA (***, p < 0.001) or Dunnett’s multiple comparison test (#, p < 0.05; ##, p < 0.01 versus αSyn; n = 4).CC BY · PubMed Central
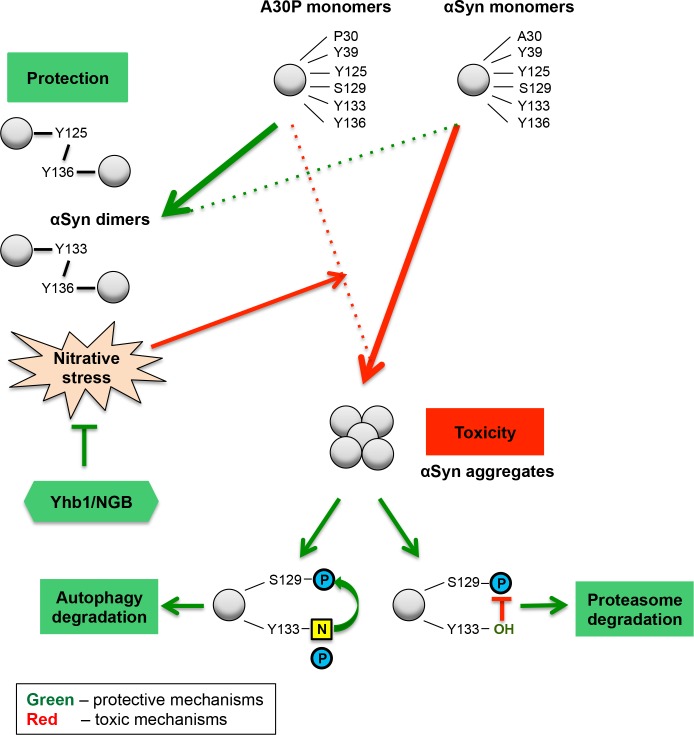
Fig 14 αSyn posttranslational modifications and nitrative stress in yeast. Enhanced intracellular nitrative stress increases the protein nitration level and influences yeast growth and aggregation. The nitration of tyrosine residues acts as trigger for αSyn and A30P toxicity. Wild-type αSyn, which is highly nitrated, inhibits growth and shows a high aggregation rate. A30P is weakly nitrated and therefore, does not inhibit yeast growth and has a low aggregation propensity. Yhb1 and its human homolog NGB protect the cells against accumulation of nitrative species and diminish the aggregate formation. Di-tyrosine crosslinked dimers are formed in reverse correlation to cytotoxicity and do not depend on Yhb1. A30P forms twice as many dimers as the toxic αSyn variant, suggesting that the di-tyrosine crosslinked dimers are not toxic species and are presumably part of a cellular detoxification pathway, sequestering the protein off-pathway of αSyn nucleation. The C-terminal tyrosine modifications have dual effect on the toxicity of the protein. Y133, which is nitrated and phosphorylated, is required for the protective phosphorylation at S129 and for the autophagy degradation of αSyn aggregates. Non-modified Y133 promotes the proteasomal degradation of αSyn aggregates. N: nitration; P: phosphorylation.
Fig 14 αSyn posttranslational modifications and nitrative stress in yeast. Enhanced intracellular nitrative stress increases the protein nitration level and influences yeast growth and aggregation. The nitration of tyrosine residues acts as trigger for αSyn and A30P toxicity. Wild-type αSyn, which is highly nitrated, inhibits growth and shows a high aggregation rate. A30P is weakly nitrated and therefore, does not inhibit yeast growth and has a low aggregation propensity. Yhb1 and its human homolog NGB protect the cells against accumulation of nitrative species and diminish the aggregate formation. Di-tyrosine crosslinked dimers are formed in reverse correlation to cytotoxicity and do not depend on Yhb1. A30P forms twice as many dimers as the toxic αSyn variant, suggesting that the di-tyrosine crosslinked dimers are not toxic species and are presumably part of a cellular detoxification pathway, sequestering the protein off-pathway of αSyn nucleation. The C-terminal tyrosine modifications have dual effect on the toxicity of the protein. Y133, which is nitrated and phosphorylated, is required for the protective phosphorylation at S129 and for the autophagy degradation of αSyn aggregates. Non-modified Y133 promotes the proteasomal degradation of αSyn aggregates. N: nitration; P: phosphorylation.CC BY · PubMed Central

Verification

Claims the paper makes

The claims and statistics of this paper haven’t been checked yet.

Run the check — free, no account needed. It reads the open-access text and checks the sources it cites.

A few free checks a day · papers already verified open instantly · results are public

Claims other papers make about this one

Each is checked against this paper’s own text: does it say what the citing paper says it does?

Self-check

Percentages, sums and reported differences re-computed from the paper’s own numbers.

The self-check needs the paper’s full text.

Citations

Cites

Show all 3 references

Research works printed but not linked: 105

  1. MC de Rijk, 2000, Prevalence of Parkinson's disease in Europe: A collaborative study of population-based cohorts. Neurologic Diseases in the Elderly Research Group, Neurology, 54, S21, 10.1212/WNL.54.11.21A · DOI
  2. DC German, 1989, Midbrain dopaminergic cell loss in Parkinson's disease: computer visualization, Ann Neurol, 26, 507, 10.1002/ana.410260403 · DOI
  3. DC German, 1992, Midbrain dopaminergic cell loss in Parkinson's disease and MPTP-induced parkinsonism: sparing of calbindin-D28k-containing cells, Ann N Y Acad Sci, 648, 42, 10.1111/j.1749-6632.1992.tb24523.x · DOI
  4. WR Gibb, 1991, Anatomy, pigmentation, ventral and dorsal subpopulations of the substantia nigra, and differential cell death in Parkinson's disease, Journal of neurology, neurosurgery, and psychiatry, 54, 388, 10.1136/jnnp.54.5.388 · DOI
  5. H Fedorow, 2005, Neuromelanin in human dopamine neurons: comparison with peripheral melanins and relevance to Parkinson's disease, Progress in neurobiology, 75, 109, 10.1016/j.pneurobio.2005.02.001 · DOI
  6. A Bellucci, 2016, Review: Parkinson's disease: from synaptic loss to connectome dysfunction, Neuropathology and applied neurobiology, 42, 77, 10.1111/nan.12297 · DOI
  7. VW Sung, 2013, Nonmotor symptoms in Parkinson's disease: expanding the view of Parkinson's disease beyond a pure motor, pure dopaminergic problem, Neurologic clinics, 31, S1
  8. MG Spillantini, 1997, Alpha-synuclein in Lewy bodies, Nature, 388, 839, 10.1038/42166 · DOI · Paper page
  9. MG Spillantini, 1998, alpha-Synuclein in filamentous inclusions of Lewy bodies from Parkinson's disease and dementia with lewy bodies, Proc Natl Acad Sci U S A, 95, 6469, 10.1073/pnas.95.11.6469 · DOI · Paper page
  10. M Baba, 1998, Aggregation of alpha-synuclein in Lewy bodies of sporadic Parkinson's disease and dementia with Lewy bodies, Am J Pathol, 152, 879
  11. JJ Zarranz, 2004, The new mutation, E46K, of alpha-synuclein causes Parkinson and Lewy body dementia, Ann Neurol, 55, 164, 10.1002/ana.10795 · DOI · Paper page
  12. AB Singleton, 2003, alpha-Synuclein locus triplication causes Parkinson's disease, Science, 302, 841, 10.1126/science.1090278 · DOI · Paper page
  13. A Athanassiadou, 1999, Genetic analysis of families with Parkinson disease that carry the Ala53Thr mutation in the gene encoding alpha-synuclein, Am J Hum Genet, 65, 555, 10.1086/302486 · DOI
  14. S Lesage, 2013, G51D alpha-synuclein mutation causes a novel parkinsonian-pyramidal syndrome, Ann Neurol, 73, 459, 10.1002/ana.23894 · DOI
  15. S Appel-Cresswell, 2013, Alpha-synuclein p.H50Q, a novel pathogenic mutation for Parkinson's disease, Movement disorders: official journal of the Movement Disorder Society, 28, 811, 10.1002/mds.25421 · DOI
  16. R Kruger, 1998, Ala30Pro mutation in the gene encoding alpha-synuclein in Parkinson's disease, Nat Genet, 18, 106, 10.1038/ng0298-106 · DOI · Paper page
  17. MH Polymeropoulos, 1997, Mutation in the alpha-synuclein gene identified in families with Parkinson's disease, Science, 276, 2045, 10.1126/science.276.5321.2045 · DOI · Paper page
  18. J Li, 2002, Differential localization of alpha-, beta- and gamma-synucleins in the rat CNS, Neuroscience, 113, 463, 10.1016/S0306-4522(02)00143-4 · DOI
  19. S Yu, 2007, Extensive nuclear localization of alpha-synuclein in normal rat brain neurons revealed by a novel monoclonal antibody, Neuroscience, 145, 539, 10.1016/j.neuroscience.2006.12.028 · DOI
  20. JE Galvin, 2001, Differential expression and distribution of alpha-, beta-, and gamma-synuclein in the developing human substantia nigra, Exp Neurol, 168, 347, 10.1006/exnr.2000.7615 · DOI
  21. L Zhang, 2008, Semi-quantitative analysis of alpha-synuclein in subcellular pools of rat brain neurons: an immunogold electron microscopic study using a C-terminal specific monoclonal antibody, Brain Res, 1244, 40, 10.1016/j.brainres.2008.08.067 · DOI
  22. Z Huang, 2011, Determining nuclear localization of alpha-synuclein in mouse brains, Neuroscience, 199, 318, 10.1016/j.neuroscience.2011.10.016 · DOI
  23. E Kontopoulos, 2006, Alpha-synuclein acts in the nucleus to inhibit histone acetylation and promote neurotoxicity, Hum Mol Genet, 15, 3012, 10.1093/hmg/ddl243 · DOI
  24. J Goers, 2003, Nuclear localization of alpha-synuclein and its interaction with histones, Biochemistry, 42, 8465, 10.1021/bi0341152 · DOI
  25. LM Oliveira, 2015, Elevated alpha-synuclein caused by SNCA gene triplication impairs neuronal differentiation and maturation in Parkinson's patient-derived induced pluripotent stem cells, Cell Death Dis, 6, e1994, 10.1038/cddis.2015.318 · DOI
  26. JT Bendor, 2013, The function of alpha-synuclein, Neuron, 79, 1044, 10.1016/j.neuron.2013.09.004 · DOI · Paper page
  27. JB Watson, 2009, Alterations in corticostriatal synaptic plasticity in mice overexpressing human alpha-synuclein, Neuroscience, 159, 501, 10.1016/j.neuroscience.2009.01.021 · DOI
  28. M Bottner, 2015, Alpha-synuclein is associated with the synaptic vesicle apparatus in the human and rat enteric nervous system, Brain Res, 1614, 51, 10.1016/j.brainres.2015.04.015 · DOI
  29. MY Golovko, 2009, The role of alpha-synuclein in brain lipid metabolism: a downstream impact on brain inflammatory response, Molecular and cellular biochemistry, 326, 55, 10.1007/s11010-008-0008-y · DOI
  30. J Burre, 2010, Alpha-synuclein promotes SNARE-complex assembly in vivo and in vitro, Science, 329, 1663, 10.1126/science.1195227 · DOI
  31. JE Duda, 2000, Widespread nitration of pathological inclusions in neurodegenerative synucleinopathies, Am J Pathol, 157, 1439, 10.1016/S0002-9440(10)64781-5 · DOI
  32. BI Giasson, 2000, Oxidative damage linked to neurodegeneration by selective alpha-synuclein nitration in synucleinopathy lesions, Science, 290, 985, 10.1126/science.290.5493.985 · DOI
  33. H Fujiwara, 2002, alpha-Synuclein is phosphorylated in synucleinopathy lesions, Nat Cell Biol, 4, 160, 10.1038/ncb748 · DOI
  34. A Oueslati, 2010, Role of post-translational modifications in modulating the structure, function and toxicity of alpha-synuclein: implications for Parkinson's disease pathogenesis and therapies, Progress in brain research, 183, 115, 10.1016/S0079-6123(10)83007-9 · DOI
  35. JP Anderson, 2006, Phosphorylation of Ser-129 is the dominant pathological modification of alpha-synuclein in familial and sporadic Lewy body disease, J Biol Chem, 281, 29739, 10.1074/jbc.M600933200 · DOI
  36. S Tenreiro, 2014, Protein phosphorylation in neurodegeneration: friend or foe?, Frontiers in molecular neuroscience, 7, 42, 10.3389/fnmol.2014.00042 · DOI · Paper page
  37. S Tenreiro, 2014, Phosphorylation modulates clearance of alpha-synuclein inclusions in a yeast model of Parkinson's disease, PLoS Genet, 10, e1004302, 10.1371/journal.pgen.1004302 · DOI
  38. B Popova, 2015, Posttranslational Modifications and Clearing of alpha-Synuclein Aggregates in Yeast, Biomolecules, 5, 617, 10.3390/biom5020617 · DOI
  39. H Shahpasandzadeh, 2014, Interplay between sumoylation and phosphorylation for protection against alpha-synuclein inclusions, J Biol Chem, 289, 31224, 10.1074/jbc.M114.559237 · DOI
  40. JM Souza, 2000, Dityrosine cross-linking promotes formation of stable alpha -synuclein polymers. Implication of nitrative and oxidative stress in the pathogenesis of neurodegenerative synucleinopathies, J Biol Chem, 275, 18344, 10.1074/jbc.M000206200 · DOI
  41. P Jenner, 1996, Oxidative stress and the pathogenesis of Parkinson's disease, Neurology, 47, S161, 10.1212/WNL.47.6_Suppl_3.161S · DOI · Paper page
  42. D Yao, 2004, Nitrosative stress linked to sporadic Parkinson's disease: S-nitrosylation of parkin regulates its E3 ubiquitin ligase activity, Proc Natl Acad Sci U S A, 101, 10810, 10.1073/pnas.0404161101 · DOI
  43. CW Olanow, 1990, Oxidation reactions in Parkinson's disease, Neurology, 40, 32
  44. HM Gao, 2008, Neuroinflammation and oxidation/nitration of alpha-synuclein linked to dopaminergic neurodegeneration, J Neurosci, 28, 7687, 10.1523/JNEUROSCI.0143-07.2008 · DOI
  45. EJ Benner, 2008, Nitrated alpha-synuclein immunity accelerates degeneration of nigral dopaminergic neurons, PLoS One, 3, e1376, 10.1371/journal.pone.0001376 · DOI
  46. A Prigione, 2010, Alpha-synuclein nitration and autophagy response are induced in peripheral blood cells from patients with Parkinson disease, Neurosci Lett, 477, 6, 10.1016/j.neulet.2010.04.022 · DOI
  47. T Takahashi, 2002, Tyrosine 125 of alpha-synuclein plays a critical role for dimerization following nitrative stress, Brain Res, 938, 73, 10.1016/S0006-8993(02)02498-8 · DOI
  48. E Paxinou, 2001, Induction of alpha-synuclein aggregation by intracellular nitrative insult, J Neurosci, 21, 8053, 10.1523/JNEUROSCI.21-20-08053.2001 · DOI
  49. G Yamin, 2003, Nitration inhibits fibrillation of human alpha-synuclein in vitro by formation of soluble oligomers, FEBS Lett, 542, 147, 10.1016/S0014-5793(03)00367-3 · DOI
  50. VN Uversky, 2005, Effects of nitration on the structure and aggregation of alpha-synuclein, Brain Res Mol Brain Res, 134, 84, 10.1016/j.molbrainres.2004.11.014 · DOI
  51. EH Norris, 2003, Effects of oxidative and nitrative challenges on alpha-synuclein fibrillogenesis involve distinct mechanisms of protein modifications, J Biol Chem, 278, 27230, 10.1074/jbc.M212436200 · DOI
  52. S Pfeiffer, 2000, Dityrosine formation outcompetes tyrosine nitration at low steady-state concentrations of peroxynitrite. Implications for tyrosine modification by nitric oxide/superoxide in vivo, J Biol Chem, 275, 6346, 10.1074/jbc.275.9.6346 · DOI
  53. R Hodara, 2004, Functional consequences of alpha-synuclein tyrosine nitration: diminished binding to lipid vesicles and increased fibril formation, J Biol Chem, 279, 47746, 10.1074/jbc.M408906200 · DOI
  54. R Menezes, 2015, From the baker to the bedside: yeast models of Parkinson’s disease, Microbial cell, 2, 262, 10.15698/mic2015.08.219 · DOI
  55. V Franssens, 2010, Yeast unfolds the road map toward alpha-synuclein-induced cell death, Cell Death Differ, 17, 746, 10.1038/cdd.2009.203 · DOI
  56. TR Hughes, 2002, Yeast and drug discovery, Funct Integr Genomics, 2, 199, 10.1007/s10142-002-0059-1 · DOI
  57. TF Outeiro, 2003, Yeast cells provide insight into alpha-synuclein biology and pathobiology, Science, 302, 1772, 10.1126/science.1090439 · DOI
  58. DF Lazaro, 2014, Systematic comparison of the effects of alpha-synuclein mutations on its oligomerization and aggregation, PLoS Genet, 10, e1004741, 10.1371/journal.pgen.1004741 · DOI
  59. C Dixon, 2005, Alpha-synuclein targets the plasma membrane via the secretory pathway and induces toxicity in yeast, Genetics, 170, 47, 10.1534/genetics.104.035493 · DOI
  60. D Petroi, 2012, Aggregate clearance of alpha-synuclein in Saccharomyces cerevisiae depends more on autophagosome and vacuole function than on the proteasome, J Biol Chem, 287, 27567, 10.1074/jbc.M112.361865 · DOI · Paper page
  61. LJ Hsu, 2000, alpha-synuclein promotes mitochondrial deficit and oxidative stress, Am J Pathol, 157, 401, 10.1016/S0002-9440(10)64553-1 · DOI
  62. LJ Su, 2010, Compounds from an unbiased chemical screen reverse both ER-to-Golgi trafficking defects and mitochondrial dysfunction in Parkinson's disease models, Dis Model Mech, 3, 194
  63. TR Flower, 2005, Heat shock prevents alpha-synuclein-induced apoptosis in a yeast model of Parkinson's disease, J Mol Biol, 351, 1081, 10.1016/j.jmb.2005.06.060 · DOI
  64. E Junn, 2002, Human alpha-synuclein over-expression increases intracellular reactive oxygen species levels and susceptibility to dopamine, Neurosci Lett, 320, 146, 10.1016/S0304-3940(02)00016-2 · DOI
  65. MS Parihar, 2009, Alpha-synuclein overexpression and aggregation exacerbates impairment of mitochondrial functions by augmenting oxidative stress in human neuroblastoma cells, Int J Biochem Cell Biol, 41, 2015, 10.1016/j.biocel.2009.05.008 · DOI
  66. MS Parihar, 2008, Mitochondrial association of alpha-synuclein causes oxidative stress, Cell Mol Life Sci, 65, 1272, 10.1007/s00018-008-7589-1 · DOI
  67. JS Beckman, 1991, The double-edged role of nitric oxide in brain function and superoxide-mediated injury, Journal of developmental physiology, 15, 53
  68. JS Beckman, 1993, Pathological implications of nitric oxide, superoxide and peroxynitrite formation, Biochem Soc Trans, 21, 330, 10.1042/bst0210330 · DOI
  69. T Taus, 2011, Universal and confident phosphorylation site localization using phosphoRS, Journal of proteome research, 10, 5354, 10.1021/pr200611n · DOI
  70. M Gotze, 2012, StavroX—a software for analyzing crosslinked products in protein interaction studies, Journal of the American Society for Mass Spectrometry, 23, 76, 10.1007/s13361-011-0261-2 · DOI
  71. L Liu, 2000, Protection from nitrosative stress by yeast flavohemoglobin, Proc Natl Acad Sci U S A, 97, 4672, 10.1073/pnas.090083597 · DOI
  72. V Dias, 2013, The role of oxidative stress in Parkinson's disease, Journal of Parkinson's disease, 3, 461, 10.3233/JPD-130230 · DOI · Paper page
  73. SR Danielson, 2008, Oxidative and nitrative protein modifications in Parkinson's disease, Free Radic Biol Med, 44, 1787, 10.1016/j.freeradbiomed.2008.03.005 · DOI
  74. N Cassanova, 2005, Yeast flavohemoglobin, a nitric oxide oxidoreductase, is located in both the cytosol and the mitochondrial matrix: effects of respiration, anoxia, and the mitochondrial genome on its intracellular level and distribution, J Biol Chem, 280, 7645, 10.1074/jbc.M411478200 · DOI
  75. K Nakamura, 2011, Direct membrane association drives mitochondrial fission by the Parkinson disease-associated protein alpha-synuclein, J Biol Chem, 286, 20710, 10.1074/jbc.M110.213538 · DOI
  76. DA Greenberg, 2008, Neuroglobin: an endogenous neuroprotectant, Current opinion in pharmacology, 8, 20, 10.1016/j.coph.2007.09.003 · DOI
  77. AA Khan, 2007, Neuroglobin attenuates beta-amyloid neurotoxicity in vitro and transgenic Alzheimer phenotype in vivo, Proc Natl Acad Sci U S A, 104, 19114, 10.1073/pnas.0706167104 · DOI
  78. S Watanabe, 2012, Human neuroglobin functions as an oxidative stress-responsive sensor for neuroprotection, J Biol Chem, 287, 30128, 10.1074/jbc.M112.373381 · DOI
  79. S Engelender, 1999, Synphilin-1 associates with alpha-synuclein and promotes the formation of cytosolic inclusions, Nat Genet, 22, 110, 10.1038/8820 · DOI
  80. J Kosten, 2014, Efficient modification of alpha-synuclein serine 129 by protein kinase CK1 requires phosphorylation of tyrosine 125 as a priming event, ACS chemical neuroscience, 5, 1203, 10.1021/cn5002254 · DOI
  81. EW Jones, 2002, Vacuolar proteases and proteolytic artifacts in Saccharomyces cerevisiae, Methods Enzymol, 351, 127, 10.1016/S0076-6879(02)51844-9 · DOI
  82. W Dubiel, 1992, Subunit 4 of the 26 S protease is a member of a novel eukaryotic ATPase family, J Biol Chem, 267, 22699, 10.1016/S0021-9258(18)50002-8 · DOI
  83. DH Lee, 1998, Proteasome inhibitors: valuable new tools for cell biologists, Trends Cell Biol, 8, 397, 10.1016/S0962-8924(98)01346-4 · DOI · Paper page
  84. E Sevcsik, 2011, Allostery in a disordered protein: oxidative modifications to alpha-synuclein act distally to regulate membrane binding, J Am Chem Soc, 133, 7152, 10.1021/ja2009554 · DOI
  85. Z Yu, 2010, Nitrated alpha-synuclein induces the loss of dopaminergic neurons in the substantia nigra of rats, PLoS One, 5, e9956, 10.1371/journal.pone.0009956 · DOI
  86. NP Ulrih, 2008, Impact of Tyr to Ala mutations on alpha-synuclein fibrillation and structural properties, Biochim Biophys Acta, 1782, 581, 10.1016/j.bbadis.2008.07.004 · DOI
  87. Y Liu, 2011, A novel molecular mechanism for nitrated {alpha}-synuclein-induced cell death, J Mol Cell Biol, 3, 239, 10.1093/jmcb/mjr011 · DOI
  88. S Wang, 2012, alpha-Synuclein disrupts stress signaling by inhibiting polo-like kinase Cdc5/Plk2, Proc Natl Acad Sci U S A, 109, 16119, 10.1073/pnas.1206286109 · DOI
  89. T Nakamura, 2002, Activation of Pyk2/RAFTK induces tyrosine phosphorylation of alpha-synuclein via Src-family kinases, FEBS Lett, 521, 190, 10.1016/S0014-5793(02)02861-2 · DOI
  90. CE Ellis, 2001, alpha-synuclein is phosphorylated by members of the Src family of protein-tyrosine kinases, J Biol Chem, 276, 3879, 10.1074/jbc.M010316200 · DOI
  91. T Nakamura, 2001, Activated Fyn phosphorylates alpha-synuclein at tyrosine residue 125, Biochem Biophys Res Commun, 280, 1085, 10.1006/bbrc.2000.4253 · DOI
  92. R Papay, 2002, Mice expressing the alpha(1B)-adrenergic receptor induces a synucleinopathy with excessive tyrosine nitration but decreased phosphorylation, J Neurochem, 83, 623, 10.1046/j.1471-4159.2002.01170.x · DOI
  93. L Chen, 2009, Tyrosine and serine phosphorylation of alpha-synuclein have opposing effects on neurotoxicity and soluble oligomer formation, J Clin Invest, 119, 3257
  94. A Negro, 2002, Multiple phosphorylation of alpha-synuclein by protein tyrosine kinase Syk prevents eosin-induced aggregation, FASEB J, 16, 210, 10.1096/fj.01-0517fje · DOI
  95. R Burai, 2015, Elucidating the Role of Site-Specific Nitration of alpha-Synuclein in the Pathogenesis of Parkinson's Disease via Protein Semisynthesis and Mutagenesis, J Am Chem Soc, 137, 5041, 10.1021/ja5131726 · DOI
  96. SR Danielson, 2009, Preferentially increased nitration of alpha-synuclein at tyrosine-39 in a cellular oxidative model of Parkinson's disease, Anal Chem, 81, 7823, 10.1021/ac901176t · DOI
  97. S Schildknecht, 2011, Neuroprotection by minocycline caused by direct and specific scavenging of peroxynitrite, J Biol Chem, 286, 4991, 10.1074/jbc.M110.169565 · DOI
  98. X Wang, 2008, Effects of neuroglobin overexpression on acute brain injury and long-term outcomes after focal cerebral ischemia, Stroke; a journal of cerebral circulation, 39, 1869, 10.1161/STROKEAHA.107.506022 · DOI
  99. LM Chen, 2012, Neuroglobin attenuates Alzheimer-like tau hyperphosphorylation by activating Akt signaling, J Neurochem, 120, 157, 10.1111/j.1471-4159.2011.07275.x · DOI
  100. D Gietz, 1992, Improved method for high efficiency transformation of intact yeast cells, Nucleic Acids Res, 20, 1425, 10.1093/nar/20.6.1425 · DOI
  101. D Mumberg, 1994, Regulatable promoters of Saccharomyces cerevisiae: comparison of transcriptional activity and their use for heterologous expression, Nucleic Acids Res, 22, 5767, 10.1093/nar/22.25.5767 · DOI
  102. DH Lee, 1996, Selective inhibitors of the proteasome-dependent and vacuolar pathways of protein degradation in Saccharomyces cerevisiae, J Biol Chem, 271, 27280, 10.1074/jbc.271.44.27280 · DOI
  103. C Liu, 2007, Proteasome inhibition in wild-type yeast Saccharomyces cerevisiae cells, BioTechniques, 42, 158, 10.2144/000112389 · DOI
  104. A Shevchenko, 1996, Mass spectrometric sequencing of proteins silver-stained polyacrylamide gels, Anal Chem, 68, 850, 10.1021/ac950914h · DOI
  105. PJ McLean, 2001, Alpha-synuclein-enhanced green fluorescent protein fusion proteins form proteasome sensitive inclusions in primary neurons, Neuroscience, 104, 901, 10.1016/S0306-4522(01)00113-0 · DOI

Cited by

Sorted by citations

Metadata

Authors
Kleinknecht, A., Popova, B., Lázaro, D. F., Pinho, R., Valerius, O., Outeiro, T. F., & Braus, G. H.
Venue
PLOS Genetics
Published
2016-06-24
Volume
12
Issue
6
Pages
e1006098
ISSN
1553-7404
Cited by
58
References
3
Language
en
Funders
FCT Portugal (SFRH/BD/80884/2011)

About these checks

Registry, retraction, Cites and statistics results are computed, not judged, with one exception: a printed reference that no index lists is read once by a model before it counts as a citation error. Claims are extracted by a model and kept only when their quote appears verbatim in the text; each cited source is then checked, with a model’s help, for whether it says what the claim relies on. Those verdicts can be wrong — read the claim’s quote and the cited source before relying on one.

Statistics and arithmetic are recomputed, not judged.

Confidence bands are shown only for fields calibrated on our annotated test set. None is calibrated yet, so no band is shown.

What counts as a claim ›How we measure confidence ›How we check this ›

Are you an author, or do you see a problem with this page? Request a review