

The DOI matches its Crossref record; 82 of the 82 references it cites were found in a registry or an index.
Genetic-Background Modulation of Core and Variable Autistic-Like Symptoms in Fmr1 Knock-Out Mice
Open accessAbstract
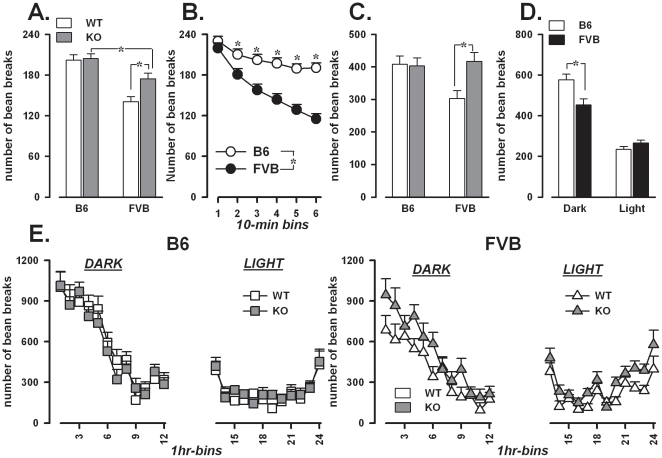
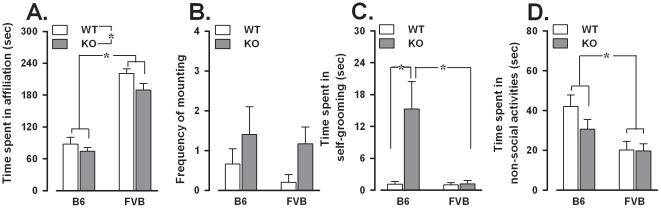
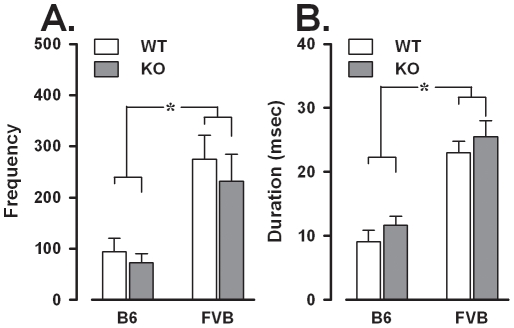
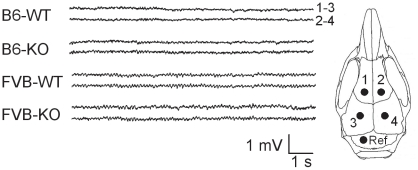
BACKGROUND: No animal models of autism spectrum disorders (ASD) with good construct validity are currently available; using genetic models of pathologies characterized by ASD-like deficits, but with known causes, may be therefore a promising strategy. The Fmr1-KO mouse is an example of this approach, modeling Fragile X syndrome, a well-known genetic disorder presenting ASD symptoms. The Fmr1-KO is available on different genetic backgrounds (FVB versus C57BL/6), which may explain some of the conflicting results that have been obtained with these mutants up till now. METHODS: Fmr1 KO and their wild-type littermates on both the FVB and C57BL/6 genetic backgrounds were examined on a battery of tests modeling the clinical symptoms of ASD, including the triad of core symptoms (alterations in social interaction and communication, presence of repetitive behaviors), as well as the secondary symptoms (disturbances in sensori-motor reactivity and in circadian patterns of activity, epileptic events). RESULTS: Fmr1-KO mice displayed autistic-like core symptoms of altered social interaction and occurrence of repetitive behaviors with additional hyperactivity. The genetic background modulated the effects of the Fmr1 deletion and it appears that the C57BL/6 background may be more suitable for further research on core autistic-like symptoms. CONCLUSIONS: The Fmr1-mouse line does not recapitulate all of the main core and secondary ASD symptoms, but still can be useful to elucidate the neurobiological mechanisms underlying specific ASD-like endophenotypes.
Overview
The claims and statistics of this paper haven’t been checked yet.
Run the check — free, no account needed. It reads the open-access text and checks the sources it cites.
Integrity signals
Registry
Cites
Statistics
Figures
Verification
Claims the paper makes
The claims and statistics of this paper haven’t been checked yet.
Run the check — free, no account needed. It reads the open-access text and checks the sources it cites.
Claims other papers make about this one
Each is checked against this paper’s own text: does it say what the citing paper says it does?
In the citing paper
“Fmr1 KO, in comparison to the wild-type (WT) strain, are described as having lower than normal levels of initial social interactions (Mineur et al., 2006), fail to show a preference for social novelty, and display inappropriate social responses (Pietropaolo et al., 2011).”
From Oxytocin and vasopressin systems in genetic syndromes and neurodevelopmental disorders (2014) · cites this paper as Pietropaolo et al., 2011
In the citing paper
“They found the Fmr1 KO on the B6 background to be a good model for FXS and a suitable model for ASD (Pietropaolo et al., 2011; Yan et al., 2004).”
From Oxytocin and vasopressin systems in genetic syndromes and neurodevelopmental disorders (2014) · cites this paper as Pietropaolo et al., 2011
Self-check
Percentages, sums and reported differences re-computed from the paper’s own numbers.
The self-check needs the paper’s full text.
Citations
Cites
Diagnostic and Statistical Manual of Mental Disorders (DSM-IV)
Hu, R. J. (2003) · Elsevier eBooks · doi:10.1016/b0-12-226870-9/01070-4 · Cited by 9,168
Verkerk, A. J. M. H., Pieretti, M., Sutcliffe, J. S., Fu, Y.-H., Kuhl, D. P. A., Pizzuti, A., Reiner, O., Richards, S., Victoria, M. F., Zhang, F., et al. (1991) · Cell · doi:10.1016/0092-8674(91)90397-h · Cited by 3,481
Moy, S. S., Nadler, J. J., Perez, A., Barbaro, R. P., Johns, J. M., Magnuson, T. R., Piven, J., & Crawley, J. N. (2004) · Genes, Brain and Behavior · doi:10.1111/j.1601-1848.2004.00076.x · Cited by 1,522
Fmr1 knockout mice: A model to study fragile X mental retardation
THEDUTCHBELGIANFRAGILEXCONSOR (1994) · Cell · doi:10.1016/0092-8674(94)90569-x · Cited by 1,108
Time to give up on a single explanation for autism
Happé, F., Ronald, A., & Plomin, R. (2006) · Nature Neuroscience · doi:10.1038/nn1770 · Cited by 987
Autism‐like behavioral phenotypes in BTBR T+tf/J mice
McFarlane, H. G., Kusek, G. K., Yang, M., Phoenix, J. L., Bolivar, V. J., & Crawley, J. N. (2008) · Genes, Brain and Behavior · doi:10.1111/j.1601-183x.2007.00330.x · Cited by 812
Automated apparatus for quantitation of social approach behaviors in mice
Nadler, J. J., Moy, S. S., Dold, G., Trang, D., Simmons, N., Perez, A., Young, N. B., Barbaro, R. P., Piven, J., Magnuson, T. R., et al. (2004) · Genes, Brain and Behavior · doi:10.1111/j.1601-183x.2004.00071.x · Cited by 775
Tuchman, R. F., & Rapin, I. (2002) · The Lancet Neurology · doi:10.1016/s1474-4422(02)00160-6 · Cited by 727
Hughes, R. N. (2004) · Neuroscience & Biobehavioral Reviews · doi:10.1016/j.neubiorev.2004.06.006 · Cited by 641 · cited 1×
“Spontaneous alternation, expressed as a percentage, refers to that proportion of arm choices differing from the previous two [58,59].”
BackgroundEfficacy of sensory and motor interventions for children with autism
Baranek, G. T. (2002) · Journal of Autism and Developmental Disorders · doi:10.1023/a:1020541906063 · Cited by 601
Research works printed but not linked: 1
- BK Yee, 2005, The expression of prepulse inhibition of the acoustic startle reflex as a function of three pulse stimulus intensities, three prepulse stimulus intensities, and three levels of startle responsiveness in C57BL6/J mice., Behav Brain Res, 163, 265, 10.1016/j.bbr.2005.05.013 · DOI
Cited by
Sorted by citations
Modeling fragile X syndrome in the Fmr1 knockout mouse
Kazdoba, T. M., Leach, P. T., Silverman, J. L., & Crawley, J. N. (2014) · Intractable & Rare Diseases Research · doi:10.5582/irdr.2014.01024 · Cited by 241
Dissecting the contribution of host genetics and the microbiome in complex behaviors
Buffington, S. A., Dooling, S. W., Sgritta, M., Noecker, C. A., Murillo, O. D., Felice, D., Turnbaugh, P. J., & Costa‐Mattioli, M. (2021) · Cell · doi:10.1016/j.cell.2021.02.009 · Cited by 214
Host microbiota modulates development of social preference in mice
Arentsen, T., Raith, H., Qian, Y., Forssberg, H., & Heijtz, R. D. (2015) · Microbial Ecology in Health and Disease · doi:10.3402/mehd.v26.29719 · Cited by 207
The neurobiological basis of human aggression: A review on genetic and epigenetic mechanisms
Waltes, R., Chiocchetti, A. G., & Freitag, C. M. (2016) · American Journal of Medical Genetics Part B: Neuropsychiatric Genetics · doi:10.1002/ajmg.b.32388 · Cited by 182
Arbogast, T., Ouagazzal, A.-M., Chevalier, C., Kopanitsa, M., Afinowi, N., Migliavacca, E., Cowling, B. S., Birling, M.-C., Champy, M.-F., Reymond, A., et al. (2016) · PLOS Genetics · doi:10.1371/journal.pgen.1005709 · Cited by 151
Behavioral phenotypes of genetic mouse models of autism
Kazdoba, T. M., Leach, P. T., & Crawley, J. N. (2015) · Genes Brain & Behavior · doi:10.1111/gbb.12256 · Cited by 187
Wen, T. H., Afroz, S., Reinhard, S. M., Palacios, A. R., Tapia, K., Binder, D. K., Razak, K. A., & Ethell, I. M. (2018) · Cerebral Cortex · doi:10.1093/cercor/bhx258 · Cited by 165
Developing zebrafish models of autism spectrum disorder (ASD)
Stewart, A., Nguyen, M., Wong, K., Poudel, M. K., & Kalueff, A. V. (2013) · Progress in Neuro-Psychopharmacology and Biological Psychiatry · doi:10.1016/j.pnpbp.2013.11.014 · Cited by 160
Ontogenesis of oxytocin pathways in the mammalian brain: late maturation and psychosocial disorders
Grinevich, V., Desarménien, M. G., Chini, B., Tauber, M., & Muscatelli, F. (2015) · Frontiers in Neuroanatomy · doi:10.3389/fnana.2014.00164 · Cited by 133
Behavioral analysis of male and female Fmr1 knockout mice on C57BL/6 background
Ding, Q., Sethna, F., & Wang, H. (2014) · Behavioural Brain Research · doi:10.1016/j.bbr.2014.05.046 · Cited by 131
Genetic and non-genetic animal models for autism spectrum disorders (ASD)
Ergaz, Z., Weinstein‐Fudim, L., & Ornoy, A. (2016) · Reproductive Toxicology · doi:10.1016/j.reprotox.2016.04.024 · Cited by 121
The Parvalbumin Hypothesis of Autism Spectrum Disorder
Filice, F., Janickova, L., Henzi, T., Bilella, A., & Schwaller, B. (2020) · Frontiers in Cellular Neuroscience · doi:10.3389/fncel.2020.577525 · Cited by 118
mTOR, a Potential Target to Treat Autism Spectrum Disorder
Sato, A. (2016) · CNS & Neurological Disorders - Drug Targets · doi:10.2174/1871527315666160413120638 · Cited by 117
Genetic manipulation of STEP reverses behavioral abnormalities in a fragile X syndrome mouse model
Goebel‐Goody, S. M., Wilson‐Wallis, E. D., Royston, S., Tagliatela, S. M., Naegele, J. R., & Lombroso, P. J. (2012) · Genes, Brain and Behavior · doi:10.1111/j.1601-183x.2012.00781.x · Cited by 108
Low sociability in BTBR T+tf/J mice is independent of partner strain
Yang, M., Abrams, D. N., Zhang, J. Y., Weber, M. D., Katz, A. M., Clarke, A. M., Silverman, J. L., & Crawley, J. N. (2012) · Physiology & Behavior · doi:10.1016/j.physbeh.2011.12.025 · Cited by 112
Brunner, D., Kabitzke, P., He, D., Cox, K., Thiede, L., Hanania, T., Sabath, E., Alexandrov, V., Saxe, M., Peles, E., et al. (2015) · PLOS ONE · doi:10.1371/journal.pone.0134572 · Cited by 111
Ciranna, L., & Catania, M. V. (2014) · Frontiers in Cellular Neuroscience · doi:10.3389/fncel.2014.00250 · Cited by 109
Oddi, D., Subashi, E., Middei, S., Bellocchio, L., Lemaire, V., Guzmán, M., Crusio, W. E., D'Amato, F. R., & Pietropaolo, S. (2014) · Neuropsychopharmacology · doi:10.1038/npp.2014.291 · Cited by 107
Self-citationRescue of fragile X syndrome phenotypes in Fmr1KO mice by a BKCa channel opener molecule
Hébert, B., Pietropaolo, S., Même, S., Laudier, B., Laugeray, A., Doisne, N., Quartier, A., Lefeuvre, S., Got, L., Cahard, D., et al. (2014) · Orphanet Journal of Rare Diseases · doi:10.1186/s13023-014-0124-6 · Cited by 100
Self-citationFragile X Mental Retardation Protein (FMRP) controls diacylglycerol kinase activity in neurons
Tabet, R., Moutin, E., Becker, J. A. J., Heintz, D., Fouillen, L., Flatter, E., Krężel, W., Alunni, V., Koebel, P., Dembélé, D., et al. (2016) · Proceedings of the National Academy of Sciences · doi:10.1073/pnas.1522631113 · Cited by 112
Fragile X syndrome: From protein function to therapy
Bagni, C., & Oostra, B. A. (2013) · American Journal of Medical Genetics Part A · doi:10.1002/ajmg.a.36241 · Cited by 110
Oxytocin and vasopressin systems in genetic syndromes and neurodevelopmental disorders
Francis, S. M., Sagar, A., Levin-Decanini, T., Liu, W., Carter, C. S., & Jacob, S. (2014) · Brain Research · doi:10.1016/j.brainres.2014.01.021 · Cited by 101
Chronic administration of AFQ056/Mavoglurant restores social behaviour in Fmr1 knockout mice
Gantois, I., Pop, A. S., de Esch, C. E. F., Buijsen, R. A. M., Pooters, T., Gomez-Mancilla, B., Gasparini, F., Oostra, B. A., D’Hooge, R., & Willemsen, R. (2013) · Behavioural Brain Research · doi:10.1016/j.bbr.2012.10.059 · Cited by 100
Pop, A. S., Gomez‐Mancilla, B., Neri, G., Willemsen, R., & Gasparini, F. (2013) · Psychopharmacology · doi:10.1007/s00213-013-3330-3 · Cited by 101
Neural Mechanisms Underlying Repetitive Behaviors in Rodent Models of Autism Spectrum Disorders
Gandhi, T., & Lee, C. C. (2021) · Frontiers in Cellular Neuroscience · doi:10.3389/fncel.2020.592710 · Cited by 97
Sociability Deficits and Altered Amygdala Circuits in Mice Lacking Pcdh10, an Autism Associated Gene
Schoch, H., Kreibich, A. S., Ferri, S. L., White, R. S., Bohorquez, D., Banerjee, A., Port, R. G., Dow, H. C., Cordero, L., Pallathra, A. A., et al. (2017) · Biological Psychiatry · doi:10.1016/j.biopsych.2016.06.008 · Cited by 92
Premoli, M., Pietropaolo, S., Wöhr, M., Simola, N., & Bonini, S. A. (2023) · European Journal of Neuroscience · doi:10.1111/ejn.15957 · Cited by 83
Self-citationParallel social information processing circuits are differentially impacted in autism
Lewis, E. M., Stein-O’Brien, G. L., Patino, A. V., Nardou, R., Grossman, C. D., Brown, M., Bangamwabo, B., Ndiaye, N., Giovinazzo, D., Dardani, I., et al. (2020) · Neuron · doi:10.1016/j.neuron.2020.10.002 · Cited by 72
Yang, Y., Arsenault, J., Bah, A., Krzeminski, M., Fekete, Á., Chao, O. Y.-H., Pacey, L. K. K., Wang, A. B., Forman-Kay, J. D., Hampson, D. R., et al. (2018) · Molecular Psychiatry · doi:10.1038/s41380-018-0240-0 · Cited by 72
Cellular distribution of the fragile X mental retardation protein in the mouse brain
Zorio, D. A. R., Jackson, C. M., Liu, Y., Rubel, E. W., & Wang, Y. (2016) · The Journal of Comparative Neurology · doi:10.1002/cne.24100 · Cited by 67
Yin, J., & Schaaf, C. P. (2016) · Prenatal Diagnosis · doi:10.1002/pd.4942 · Cited by 78
Verma, V., Paul, A., Vishwanath, A. A., Vaidya, B., & Clement, J. P. (2019) · Open Biology · doi:10.1098/rsob.180265 · Cited by 68
Wilkes, B. J., & Lewis, M. H. (2018) · Neuroscience & Biobehavioral Reviews · doi:10.1016/j.neubiorev.2018.05.022 · Cited by 64
Gaudissard, J., Ginger, M. R., Premoli, M., Memo, M., Frick, A., & Pietropaolo, S. (2017) · Autism Research · doi:10.1002/aur.1814 · Cited by 64
Self-citationMonogenic mouse models of social dysfunction: Implications for autism
Oddi, D., Crusio, W. E., D'Amato, F. R., & Pietropaolo, S. (2013) · Behavioural Brain Research · doi:10.1016/j.bbr.2013.01.002 · Cited by 66
Self-citationDietary supplementation of omega-3 fatty acids rescues fragile X phenotypes in Fmr1-Ko mice
Pietropaolo, S., Goubran, M., Joffre, C., Aubert, A., Lemaire-Mayo, V., Crusio, W. E., & Layé, S. (2014) · Psychoneuroendocrinology · doi:10.1016/j.psyneuen.2014.07.002 · Cited by 63
Self-citationSociability and brain development in BALB/cJ and C57BL/6J mice
Fairless, A. H., Dow, H. C., Kreibich, A. S., Torre, M., Kuruvilla, M., Gordon, E., Morton, E. A., Tan, J., Berrettini, W. H., Li, H., et al. (2011) · Behavioural Brain Research · doi:10.1016/j.bbr.2011.12.001 · Cited by 64
What we can learn from a genetic rodent model about autism
Möhrle, D., Fernández, M. C., Peñagarikano, O., Frick, A., Allman, B. L., & Schmid, S. (2019) · Neuroscience & Biobehavioral Reviews · doi:10.1016/j.neubiorev.2019.12.015 · Cited by 60
Tauber, J., Vanlandingham, P. A., & Zhang, B. (2011) · PLoS ONE · doi:10.1371/journal.pone.0027100 · Cited by 63
Cinque, C., Pondiki, S., Oddi, D., Certo, M. G. D., Marinelli, S., Troisi, A., Moles, A., & D'Amato, F. R. (2012) · Translational Psychiatry · doi:10.1038/tp.2012.83 · Cited by 59
Self-citationWei, H., Dobkin, C., Sheikh, A. M., Malik, M. N., Brown, W. T., & Li, X. (2012) · PLoS ONE · doi:10.1371/journal.pone.0036981 · Cited by 56
Mutant Mouse Models of Autism Spectrum Disorders
Provenzano, G., Zunino, G., Genovesi, S., Sgadó, P., & Bozzi, Y. (2012) · Disease Markers · doi:10.1155/2012/916082 · Cited by 53
Absence of strong strain effects in behavioral analyses ofShank3-deficient mice
Drapeau, E., Dorr, N. P., Elder, G. A., & Buxbaum, J. D. (2014) · Disease Models & Mechanisms · doi:10.1242/dmm.013821 · Cited by 55
Deletion of Fmr1 results in sex‐specific changes in behavior
Nolan, S. O., Reynolds, C. D., Smith, G. D., Holley, A. J., Escobar, B., Chandler, M. A., Volquardsen, M., Jefferson, T. S., Pandian, A., Smith, T., et al. (2017) · Brain and Behavior · doi:10.1002/brb3.800 · Cited by 56
The sodium-activated potassium channel Slack is required for optimal cognitive flexibility in micePreprint
Bausch, A. E., Dieter, R., Nann, Y., Hausmann, M., Meyerdierks, N., Kaczmarek, L. K., Ruth, P., & Łukowski, R. (2015) · Learning & Memory · doi:10.1101/lm.037820.114 · Cited by 51
Metabotropic Glutamate Receptors in Central Nervous System Diseases
Golubeva, A. V., Moloney, R. D., O’Connor, R. M., Dinan, T. G., & Cryan, J. F. (2016) · Current Drug Targets · doi:10.2174/1389450116666150316224011 · Cited by 51
Gaboxadol Normalizes Behavioral Abnormalities in a Mouse Model of Fragile X Syndrome
Cogram, P., Deacon, R. M. J., Warner‐Schmidt, J. L., von Schimmelmann, M. J., Abrahams, B. S., & During, M. J. (2019) · Frontiers in Behavioral Neuroscience · doi:10.3389/fnbeh.2019.00141 · Cited by 53
Development of home cage social behaviors in BALB/cJ vs. C57BL/6J mice
Fairless, A. H., Katz, J. M., Safi, N., Dow, H. C., Kreibich, A. S., Berrettini, W. H., Abel, T. G., & Brodkin, E. S. (2012) · Behavioural Brain Research · doi:10.1016/j.bbr.2012.08.051 · Cited by 47
From FMRP Function to Potential Therapies for Fragile X Syndrome
Sethna, F., Moon, C., & Wang, H. (2013) · Neurochemical Research · doi:10.1007/s11064-013-1229-3 · Cited by 49
Weiser, M. J., Mucha, B., Denheyer, H., Atkinson, D., Schanz, N., Vassiliou, E. K., & Benno, R. H. (2015) · Prostaglandins Leukotrienes and Essential Fatty Acids · doi:10.1016/j.plefa.2015.10.005 · Cited by 49
Current state of evidence of cannabis utilization for treatment of autism spectrum disorders
Agarwal, R., Burke, S. L., & Maddux, M. (2019) · BMC Psychiatry · doi:10.1186/s12888-019-2259-4 · Cited by 46
de Esch, C. E. F., van den Berg, W. E., Buijsen, R. A. M., Jaafar, I. A., Nieuwenhuizen-Bakker, I. M., Gasparini, F., Kushner, S. A., & Willemsen, R. (2015) · Neurobiology of Disease · doi:10.1016/j.nbd.2014.12.021 · Cited by 45
Regional brain volumes changes in adult male FMR1-KO mouse on the FVB strain
Lai, J., Lerch, J. P., Doering, L. C., Foster, J. A., & Ellegood, J. (2016) · Neuroscience · doi:10.1016/j.neuroscience.2016.01.021 · Cited by 46
Fyke, W., Premoli, M., Echeverry‐Alzate, V., López‐Moreno, J. A., Lemaire, V., Crusio, W. E., Marsicano, G., Wöhr, M., & Pietropaolo, S. (2021) · Autism Research · doi:10.1002/aur.2562 · Cited by 43
Self-citationAge‐specific autistic‐like behaviors in heterozygous Fmr1‐KO female mice
Gauducheau, M., Lemaire, V., D'Amato, F. R., Oddi, D., Crusio, W. E., & Pietropaolo, S. (2017) · Autism Research · doi:10.1002/aur.1743 · Cited by 40
Self-citationSex-Dependent Changes in Social Behaviors in Motor Pre-Symptomatic R6/1 Mice
Pietropaolo, S., Delage, P., Cayzac, S., Crusio, W. E., & Cho, Y. H. (2011) · PLoS ONE · doi:10.1371/journal.pone.0019965 · Cited by 43
Self-citationCarreño-Muñoz, M. I., Martins, F., Medrano, M., Aloisi, E., Pietropaolo, S., Dechaud, C., Subashi, E., Bony, G., Ginger, M. R., Moujahid, A., et al. (2017) · Neuropsychopharmacology · doi:10.1038/npp.2017.149 · Cited by 44
Self-citationChen, H., Chen, C., Mandhani, N., Short-Miller, J. C., Smucker, M. R., Sun, Y., & Kuan, C.-Y. (2020) · Journal of Neuroscience · doi:10.1523/jneurosci.1171-20.2020 · Cited by 40
Bertelli, M. O., Azeem, M. W., Underwood, L., Scattoni, M. L., Persico, A. M., Ricciardello, A., Sappok, T., Bergmann, T. J., Keller, R., Bianco, A., et al. (2022) · Springer eBooks · doi:10.1007/978-3-319-95720-3_16 · Cited by 43
Mapping the landscape of social behavior
Klibaite, U., Li, T., Aldarondo, D. E., Akoad, J. F., Ölveczky, B. P., & Dunn, T. (2025) · Cell · doi:10.1016/j.cell.2025.01.044 · Cited by 39
Silverman, J. L., & Ellegood, J. (2018) · Current Opinion in Neurology · doi:10.1097/wco.0000000000000537 · Cited by 35
Early development of social deficits in APP and APP-PS1 mice
Pietropaolo, S., Delage, P., Lebreton, F., Crusio, W. E., & Cho, Y. H. (2011) · Neurobiology of Aging · doi:10.1016/j.neurobiolaging.2011.09.012 · Cited by 36
Self-citationFu, S., Bury, L. A. D., Eum, J., & Wynshaw-Boris, A. J. (2023) · The American Journal of Human Genetics · doi:10.1016/j.ajhg.2023.03.015 · Cited by 36
EEG as a translational biomarker and outcome measure in fragile X syndrome
Kenny, A., Wright, D., & Stanfield, A. C. (2022) · Translational Psychiatry · doi:10.1038/s41398-022-01796-2 · Cited by 36
Nebel, R. A., Zhao, D., Pedrosa, E., Kirschen, J., Lachman, H. M., Zheng, D., & Abrahams, B. S. (2016) · PLoS ONE · doi:10.1371/journal.pone.0148039 · Cited by 34
Pietropaolo, S., Bellocchio, L., Ruiz-Calvo, A., Cabanas, M., Du, Z., Guzmán, M., Garret, M., & Cho, Y. H. (2014) · Neuropharmacology · doi:10.1016/j.neuropharm.2014.07.021 · Cited by 34
Self-citationThe role of ARID1B, a BAF chromatin remodeling complex subunit, in neural development and behavior
Moffat, J. J., Jung, E., Ka, M., Smith, A. L., Jeon, B. T., Santen, G. W. E., & Kim, W.-Y. (2018) · Progress in Neuro-Psychopharmacology and Biological Psychiatry · doi:10.1016/j.pnpbp.2018.08.021 · Cited by 31
Decreased home cage movement and oromotor impairments in adult Fmr1‐ KO mice
Bonasera, S. J., Chaudoin, T. R., Goulding, E. H., Mittek, M., & Dunaevsky, A. (2017) · Genes Brain & Behavior · doi:10.1111/gbb.12374 · Cited by 31
Felgerolle, C., Hébert, B., Ardourel, M., Meyer-Dilhet, G., Menuet, A., Pinto-Morais, K., Bizot, J., Pichon, J., Briault, S., & Perche, O. (2019) · Frontiers in Behavioral Neuroscience · doi:10.3389/fnbeh.2019.00228 · Cited by 30
Genome-wide association study and genomic prediction of tolerance to acute hypoxia in rainbow trout
Prchal, M., D’Ambrosio, J., Lagarde, H., Lallias, D., Patrice, P., François, Y., Poncet, C., Desgranges, A., Haffray, P., Dupont‐Nivet, M., et al. (2022) · Aquaculture · doi:10.1016/j.aquaculture.2022.739068 · Cited by 29
Modelling fragile X syndrome in the laboratory setting: A behavioral perspective
Melancia, F., & Trezza, V. (2018) · Behavioural Brain Research · doi:10.1016/j.bbr.2018.04.042 · Cited by 31
Gunn, R. K., Huentelman, M. J., & Brown, R. E. (2011) · Behavioural Brain Research · doi:10.1016/j.bbr.2011.07.008 · Cited by 31
Mild expression differences of MECP2 influencing aggressive social behavior
Tantra, M., Hammer, C., Kästner, A., Dahm, L., Begemann, M., Bodda, C., Hammerschmidt, K., Giegling, I., Stepniak, B., Castillo-Venzor, A., et al. (2014) · EMBO Molecular Medicine · doi:10.1002/emmm.201303744 · Cited by 28
LF-rTMS ameliorates social dysfunction of FMR1 mice via modulating Akt/GSK-3β signaling
Hou, Y., Zhao, J., Yang, D., Xuan, R., Xie, R., Wang, M., Mo, H., Liang, L., Wang, W., Wu, S., et al. (2021) · Biochemical and Biophysical Research Communications · doi:10.1016/j.bbrc.2021.02.086 · Cited by 24
Ultrasonic Vocalizations in Adult C57BL/6J Mice: The Role of Sex Differences and Repeated Testing
Premoli, M., Petroni, V., Bulthuis, R., Bonini, S. A., & Pietropaolo, S. (2022) · Frontiers in Behavioral Neuroscience · doi:10.3389/fnbeh.2022.883353 · Cited by 24
Self-citationHulbert, S. W., Bey, A. L., & Jiang, Y. (2018) · Brain and Behavior · doi:10.1002/brb3.1107 · Cited by 22
Brunssen, S., Moy, S. S., Toews, A. D., McPherson, C. A., & Harry, G. J. (2012) · Brain Behavior and Immunity · doi:10.1016/j.bbi.2012.08.017 · Cited by 23
Fyke, W., Alarcón, J. M., Velinov, M. T., & Chadman, K. K. (2021) · Autism Research · doi:10.1002/aur.2520 · Cited by 19
Hodges, S. L., Nolan, S. O., Tomac, L. A., Muhammad, I. D. A., Binder, M. S., Taube, J. H., & Lugo, J. N. (2019) · Physiology & Behavior · doi:10.1016/j.physbeh.2019.112776 · Cited by 20
Mejías, R., Chiu, S., Han, M., Rose, R., Gil-Infante, A., Zhao, Y., Huganir, R. L., & Wang, T. (2019) · Neurobiology of Disease · doi:10.1016/j.nbd.2019.104602 · Cited by 20
Bausch, A. E., Ehinger, R., Straubinger, J., Zerfass, P., Nann, Y., & Łukowski, R. (2018) · Neuroscience · doi:10.1016/j.neuroscience.2018.05.040 · Cited by 19
Hardiman, R. L., & Bratt, A. M. (2016) · Physiology & Behavior · doi:10.1016/j.physbeh.2016.09.030 · Cited by 17
Paradoxical effect of baclofen on social behavior in the fragile X syndrome mouse model
Zeidler, S., Pop, A. S., Jaafar, I. A., de Boer, H., Buijsen, R. A. M., de Esch, C. E. F., Nieuwenhuizen‐Bakker, I., Hukema, R. K., & Willemsen, R. (2018) · Brain and Behavior · doi:10.1002/brb3.991 · Cited by 17
Śledziowska, M., Galloway, J., & Baudouin, S. J. (2019) · Neuroscience · doi:10.1016/j.neuroscience.2019.10.011 · Cited by 16
Translational endpoints in fragile X syndrome
de Esch, C. E. F., Zeidler, S., & Willemsen, R. (2013) · Neuroscience & Biobehavioral Reviews · doi:10.1016/j.neubiorev.2013.10.012 · Cited by 16
Weisz, E. D., Monyak, R. E., & Jongens, T. A. (2015) · Experimental Neurology · doi:10.1016/j.expneurol.2015.05.015 · Cited by 16
Ferraguto, C., Bouleau, Y., Peineau, T., Dulon, D., & Pietropaolo, S. (2023) · International Journal of Molecular Sciences · doi:10.3390/ijms241411863 · Cited by 12
Self-citationAutistic traits in epilepsy models: Why, when and how?
Velı́šková, J., Silverman, J. L., Benson, M. J., & Lenck‐Santini, P. (2018) · Epilepsy Research · doi:10.1016/j.eplepsyres.2018.05.009 · Cited by 15
Kratovac, S., & Corbin, J. G. (2013) · Brain Research · doi:10.1016/j.brainres.2013.08.052 · Cited by 14
Loss of CC2D1A in Glutamatergic Neurons Results in Autistic-Like Features in Mice
Yang, C.-Y., Hung, Y.-C., Cheng, K., Ling, P., & Hsu, K. (2021) · Neurotherapeutics · doi:10.1007/s13311-021-01072-z · Cited by 14
Rodent Vocalization Studies in Animal Models of the Autism Spectrum Disorder
Scattoni, M. L., Michetti, C., & Ricceri, L. (2018) · Handbook of behavioral neuroscience · doi:10.1016/b978-0-12-809600-0.00042-1 · Cited by 13
Murta, V., Seiffe, A., & Depino, A. M. (2023) · Sexes · doi:10.3390/sexes4030024 · Cited by 13
Omics analysis of mouse brain models of human diseases
Paban, V., Loriod, B., Villard, C., Buée, L., Blum, D. L., Pietropaolo, S., Cho, Y. H., Gory‐Fauré, S., Mansour, E., Gharbi, A., et al. (2016) · Gene · doi:10.1016/j.gene.2016.11.022 · Cited by 11
Self-citationSharghi, S., Flunkert, S., Daurer, M., Rabl, R., Chagnaud, B. P., Leopoldo, M., Lacivita, E., Hutter‐Paier, B., & Prokesch, M. (2023) · Frontiers in Neuroscience · doi:10.3389/fnins.2023.1087788 · Cited by 12
Pietropaolo, S., & Subashi, E. (2014) · Cambridge University Press eBooks · doi:10.1017/cbo9781107360556.014 · Cited by 12
Self-citationNeuromotor Development in the Shank3 Mouse Model of Autism Spectrum Disorder
Pillerová, M., Drobná, D., Szabó, J., Renczés, E., Borbélyová, V., Ostatníková, D., Celec, P., & Tóthová, Ľ. (2022) · Brain Sciences · doi:10.3390/brainsci12070872 · Cited by 13
Janz, P., Bainier, M., Marashli, S., Gross, S., & Redondo, R. L. (2025) · Neuropharmacology · doi:10.1016/j.neuropharm.2024.110182 · Cited by 11
Choroid plexus apocrine secretion shapes CSF proteome during mouse brain development
Courtney, Y., Head, J. P., Dani, N., Chechneva, O. V., Shipley, F. B., Zhang, Y., Holtzman, M. J., Sadegh, C., Libermann, T. A., & Lehtinen, M. K. (2025) · Nature Neuroscience · doi:10.1038/s41593-025-01972-9 · Cited by 24
Petroni, V., Subashi, E., Premoli, M., Memo, M., Lemaire, V., & Pietropaolo, S. (2022) · Frontiers in Cellular Neuroscience · doi:10.3389/fncel.2022.917183 · Cited by 11
Self-citationPremoli, M., Fyke, W., Bellocchio, L., Lemaire, V., Woolley-Roberts, M., Bontempi, B., & Pietropaolo, S. (2023) · Cells · doi:10.3390/cells12151927 · Cited by 10
Self-citation
Metadata
- Authors
- Pietropaolo, S., Guilleminot, A., Martin, B., D'Amato, F. R., & Crusio, W. E.
- Affiliations
- Centre National de la Recherche Scientifique (FR)
- Inserm (FR)
- National Research Council (IT)
- Corresponding author
- Crusio, Wim E.
- Venue
- PLoS ONE
- Publisher
- Public Library of Science (PLoS)
- Published
- 2011-02-22
- Volume
- 6
- Issue
- 2
- Pages
- e17073
- ISSN
- 1932-6203 (ISSN-L)
- PMC
- PMC3043074
- OpenAlex
- W2002465714
- Cited by
- 178
- References
- 82
- Citations by year
- 2026: 7 · 2025: 7 · 2024: 15 · 2023: 11 · 2022: 13 · 2021: 12 · 2020: 10 · 2019: 12 · 2018: 10 · 2017: 10 · 2016: 15 · 2015: 15 · 2014: 15 · 2013: 9 · 2012: 11
- FWCI
- 8.18
- Type
- journal article
- Language
- en
- Open access
- gold
- doi.org
- Locations
- PLoS ONE (publishedVersion, cc-by)
- PubMed Central (publishedVersion, cc-by)
- PubMed (publishedVersion)
- HAL (submittedVersion, other-oa)
- DOAJ (DOAJ: Directory of Open Access Journals) (submittedVersion, cc-by-sa)
- Funders
- March of Dimes Foundation (12-FY05-1198)
- Institut National de la Santé et de la Recherche Médicale
- Centre National de la Recherche Scientifique (12-FY05-1198)
- Université de Bordeaux (12-FY05-1198)
- Topics
- Life Sciences › Biochemistry, Genetics and Molecular Biology › Genetics › Genetics and Neurodevelopmental Disorders
- Life Sciences › Neuroscience › Cognitive Neuroscience › Autism Spectrum Disorder Research
- Life Sciences › Neuroscience › Developmental Neuroscience › Williams Syndrome Research
- Keywords
- autism spectrum disorder, Fmr1 knockout mice, fragile X syndrome, genetic background, FVB mice, C57BL/6 mice, social interaction deficits, repetitive behavior, hyperactivity, circadian activity, animal models of autism, endophenotypes
- MeSH terms
- Animals, Autistic Disorder, Behavior, Animal, Disease Models, Animal, Learning, Male, Mice, Inbred C57BL, Motor Activity, Phenotype, Mice, Knockout, Genetic Heterogeneity, Genetic Predisposition to Disease, Mice, Fragile X Messenger Ribonucleoprotein 1, Endophenotypes
About these checks
Registry, retraction, Cites and statistics results are computed, not judged, with one exception: a printed reference that no index lists is read once by a model before it counts as a citation error. Claims are extracted by a model and kept only when their quote appears verbatim in the text; each cited source is then checked, with a model’s help, for whether it says what the claim relies on. Those verdicts can be wrong — read the claim’s quote and the cited source before relying on one.
Statistics and arithmetic are recomputed, not judged.
Confidence bands are shown only for fields calibrated on our annotated test set. None is calibrated yet, so no band is shown.
What counts as a claim ›How we measure confidence ›How we check this ›
Are you an author, or do you see a problem with this page? Request a review
