Student or educator? Sign up with your school email and get 6 months of Pro free.
CoChat

The DOI matches its Crossref record; 45 of the 45 references it cites were found in a registry or an index.

ApoE Receptor 2 Regulates Synapse and Dendritic Spine Formation

Open access

Abstract

BACKGROUND: Apolipoprotein E receptor 2 (ApoEr2) is a postsynaptic protein involved in long-term potentiation (LTP), learning, and memory through unknown mechanisms. We examined the biological effects of ApoEr2 on synapse and dendritic spine formation-processes critical for learning and memory. METHODOLOGY/PRINCIPAL FINDINGS: In a heterologous co-culture synapse assay, overexpression of ApoEr2 in COS7 cells significantly increased colocalization with synaptophysin in primary hippocampal neurons, suggesting that ApoEr2 promotes interaction with presynaptic structures. In primary neuronal cultures, overexpression of ApoEr2 increased dendritic spine density. Consistent with our in vitro findings, ApoEr2 knockout mice had decreased dendritic spine density in cortical layers II/III at 1 month of age. We also tested whether the interaction between ApoEr2 and its cytoplasmic adaptor proteins, specifically X11α and PSD-95, affected synapse and dendritic spine formation. X11α decreased cell surface levels of ApoEr2 along with synapse and dendritic spine density. In contrast, PSD-95 increased cell surface levels of ApoEr2 as well as synapse and dendritic spine density. CONCLUSIONS/SIGNIFICANCE: These results suggest that ApoEr2 plays important roles in structure and function of CNS synapses and dendritic spines, and that these roles are modulated by cytoplasmic adaptor proteins X11α and PSD-95.

Overview

The claims and statistics of this paper haven’t been checked yet.

Free: it reads the open-access text and checks the first 5 claims that cite a source we can check. Create a free account to check every claim.

A few free checks a day · papers already verified open instantly · results are public

Integrity signals

Registry

Crossref · 10.1371/journal.pone.0017203

Cites

45 of 45 references verified0 citation errors · 0 not checkable

Statistics

Figures

Figure 1 ApoEr2 is expressed at synapses. A. Primary hippocampal neurons at DIV 14 were immunostained for ApoEr2 and PSD-95. Primary antibodies were detected with Alexa Fluor 488 anti-rabbit (in green; left panel) and Alexa Fluor 594 anti-mouse (in red; middle panel). Immnolabeled neurons were imaged by confocal microscopy (63X). Colocalization of ApoEr2 and PSD-95 appears as yellow in the right panel. White bar represents 10 micrometers. B. We performed immunoblot analysis on ApoEr2, X11α, PSD-95, and synaptophysin in presynaptic vesicles (SV) and postsynaptic density (PSD) fractions. X11α is present in both pre- and postsynaptic fractions; synaptophysin is present in presynaptic fractions and PSD-95 is present in post-synaptic fractions. ApoEr2 is predominantly found in the postsynaptic fraction. C. Levels of ApoEr2, X11α, PSD-95, and β-actin (used as protein loading control), were examined by immunoblot at developmental stages (n = 3 per timepoint). ApoEr2 levels increased at E17-P6, a critical period for synaptogenesis.
Figure 1 ApoEr2 is expressed at synapses. A. Primary hippocampal neurons at DIV 14 were immunostained for ApoEr2 and PSD-95. Primary antibodies were detected with Alexa Fluor 488 anti-rabbit (in green; left panel) and Alexa Fluor 594 anti-mouse (in red; middle panel). Immnolabeled neurons were imaged by confocal microscopy (63X). Colocalization of ApoEr2 and PSD-95 appears as yellow in the right panel. White bar represents 10 micrometers. B. We performed immunoblot analysis on ApoEr2, X11α, PSD-95, and synaptophysin in presynaptic vesicles (SV) and postsynaptic density (PSD) fractions. X11α is present in both pre- and postsynaptic fractions; synaptophysin is present in presynaptic fractions and PSD-95 is present in post-synaptic fractions. ApoEr2 is predominantly found in the postsynaptic fraction. C. Levels of ApoEr2, X11α, PSD-95, and β-actin (used as protein loading control), were examined by immunoblot at developmental stages (n = 3 per timepoint). ApoEr2 levels increased at E17-P6, a critical period for synaptogenesis.CC BY · PubMed Central
Figure 2 ApoEr2 promotes synapse formation in heterologous co-cultures and dendritic spine formation in primary hippocampal neurons. A. COS7 cells were transfected with GFP (upper panels) or ApoEr2-HA (lower panels) and then cultured with primary hippocampal neurons. ApoEr2 is expressed in clusters (lower panel left), in contrast to diffuse GFP distribution (upper left panel). Synaptophysin puncta in neuronal processes (middle panels) identified presynaptic sites (arrow heads, right panel). COS7 cells expressing ApoEr2 induced clustering of synaptophysin (arrows) compared to GFP alone. B. Quantification of average synaptophysin cluster intensity from the data in A (n = 10, *p<0.05). C. Cultured hippocampal neurons were transfected with GFP and empty vector or GFP and ApoEr2-HA as indicated. Morphology of neurons and dendritic spines were visualized by GFP fluorescence. Magnified examples of representative dendritic segments are shown in bottom panels. D. Quantification of spine density from C, with asterisks defining statistically significant differences from GFP-transfected cells (n = 15, *p<0.05). Error bars are represented as S.E.M. White bar represents 10 micrometers.
Figure 2 ApoEr2 promotes synapse formation in heterologous co-cultures and dendritic spine formation in primary hippocampal neurons. A. COS7 cells were transfected with GFP (upper panels) or ApoEr2-HA (lower panels) and then cultured with primary hippocampal neurons. ApoEr2 is expressed in clusters (lower panel left), in contrast to diffuse GFP distribution (upper left panel). Synaptophysin puncta in neuronal processes (middle panels) identified presynaptic sites (arrow heads, right panel). COS7 cells expressing ApoEr2 induced clustering of synaptophysin (arrows) compared to GFP alone. B. Quantification of average synaptophysin cluster intensity from the data in A (n = 10, *p<0.05). C. Cultured hippocampal neurons were transfected with GFP and empty vector or GFP and ApoEr2-HA as indicated. Morphology of neurons and dendritic spines were visualized by GFP fluorescence. Magnified examples of representative dendritic segments are shown in bottom panels. D. Quantification of spine density from C, with asterisks defining statistically significant differences from GFP-transfected cells (n = 15, *p<0.05). Error bars are represented as S.E.M. White bar represents 10 micrometers.CC BY · PubMed Central
Figure 3 Extracellular and intracellular domains of ApoEr2 are essential for dendritic spine formation. A. Deletion constructs of ApoEr2 with a c-terminal myc tag. B. Primary hippocampal neurons (DIV 14) were transfected with GFP and empty vector (#1), GFP and ApoEr2 lacking a ligand binding domain (#2), GFP and ApoEr2 lacking ligand binding and EGF binding domains (#3), GFP and ApoEr2 lacking ligand binding, EGF binding and O-linked domains (#4) and GFP and full-length ApoEr2 (#5). After 48 hours, neurons were fixed and stained for GFP. Morphology of neurons and dendritic spines was visualized by GFP fluorescence. Magnified examples of representative dendritic segments are shown in bottom panels. C. Quantification of data shown in B (n = 15/per groups, ***, p<0.001). Error bars are represented as S.E.M. White bar represents 10 micrometers. D. Deletion constructs of ApoEr2 with a c-terminal HA tag. Primary hippocampal neurons (DIV 14) were transfected with GFP and empty vector (#1), GFP and full-length ApoEr2 (#6), or GFP and extracellular domain of ApoEr2 (#7). After 48 hours, neurons were fixed and stained for GFP. Morphology of neurons and dendritic spines was visualized by GFP fluorescence. Magnified examples of representative dendritic segments are shown in bottom panels. F. Quantification of data shown in C (n = 10/per group, **, p<0.005). Error bars are represented as S.E.M. White bar represents 10 micrometers.
Figure 3 Extracellular and intracellular domains of ApoEr2 are essential for dendritic spine formation. A. Deletion constructs of ApoEr2 with a c-terminal myc tag. B. Primary hippocampal neurons (DIV 14) were transfected with GFP and empty vector (#1), GFP and ApoEr2 lacking a ligand binding domain (#2), GFP and ApoEr2 lacking ligand binding and EGF binding domains (#3), GFP and ApoEr2 lacking ligand binding, EGF binding and O-linked domains (#4) and GFP and full-length ApoEr2 (#5). After 48 hours, neurons were fixed and stained for GFP. Morphology of neurons and dendritic spines was visualized by GFP fluorescence. Magnified examples of representative dendritic segments are shown in bottom panels. C. Quantification of data shown in B (n = 15/per groups, ***, p<0.001). Error bars are represented as S.E.M. White bar represents 10 micrometers. D. Deletion constructs of ApoEr2 with a c-terminal HA tag. Primary hippocampal neurons (DIV 14) were transfected with GFP and empty vector (#1), GFP and full-length ApoEr2 (#6), or GFP and extracellular domain of ApoEr2 (#7). After 48 hours, neurons were fixed and stained for GFP. Morphology of neurons and dendritic spines was visualized by GFP fluorescence. Magnified examples of representative dendritic segments are shown in bottom panels. F. Quantification of data shown in C (n = 10/per group, **, p<0.005). Error bars are represented as S.E.M. White bar represents 10 micrometers.CC BY · PubMed Central
Figure 4 ApoEr2 deficient mice have reduced dendrite spine density in pyramidal neurons in cortical layers II/III at 1 month of age. Mouse brains were Golgi stained and cortical layers II/III imaged (n = 4 mice/genotype). A. Representative Golgi-impregnated pyramidal neurons in cortical layer II/III of a wild-type (left panel) and ApoEr2 knockout mice (right panel). B. Representative AO and BS dendrites per genotype. C–E. Averaged spine densities for each genotype. Black bar indicates 20 micrometer scale. C. Averaged spine density for AO spines (28 neurons/group). D. Averaged spine density for BS spines (28 neurons/group). E. Averaged total spine density, combining AO + BS dendrites (56 dendritic segments/group). Error bars are represented as S.E.M. *, p<0.05. F-H. The cumulative distribution percentage of spine width. There were no significant shifts in distribution between ApoEr2 knockout and wild-type littermates. I-K. The cumulative distribution percentage of spine length. ApoEr2 knockout mice had a significant shift to smaller spines compared to wild-type mice in the AO (I) and Total (K) but not BS (J). (p<0.05, Kolmogorov–Smirnov test).
Figure 4 ApoEr2 deficient mice have reduced dendrite spine density in pyramidal neurons in cortical layers II/III at 1 month of age. Mouse brains were Golgi stained and cortical layers II/III imaged (n = 4 mice/genotype). A. Representative Golgi-impregnated pyramidal neurons in cortical layer II/III of a wild-type (left panel) and ApoEr2 knockout mice (right panel). B. Representative AO and BS dendrites per genotype. C–E. Averaged spine densities for each genotype. Black bar indicates 20 micrometer scale. C. Averaged spine density for AO spines (28 neurons/group). D. Averaged spine density for BS spines (28 neurons/group). E. Averaged total spine density, combining AO + BS dendrites (56 dendritic segments/group). Error bars are represented as S.E.M. *, p<0.05. F-H. The cumulative distribution percentage of spine width. There were no significant shifts in distribution between ApoEr2 knockout and wild-type littermates. I-K. The cumulative distribution percentage of spine length. ApoEr2 knockout mice had a significant shift to smaller spines compared to wild-type mice in the AO (I) and Total (K) but not BS (J). (p<0.05, Kolmogorov–Smirnov test).CC BY · PubMed Central
Figure 5 ApoEr2 deficient mice have no change in spine density in pyramidal neurons in cortical layers II/III at 1 year of age. Mouse brains were Golgi stained and neurons in cortical layers II/III imaged (n = 4 mice/genotype). A. Representative Golgi-impregnated pyramidal neuron in cortical layer II/III of a wild-type (left panel) and ApoEr2 knockout mice (right panel). B. Representative AO and BS dendrites per genotype. Black bar indicates 20 micrometer scale. C–E. Averaged spine densities for each genotype. C. Averaged total spine density, combining AO + BS dendrites (56 dendritic segments/group). D. Averaged spine density for AO spines (28 neurons/group). E. Averaged spine density for BS spines (28 neurons/group). Error bars are represented as S.E.M.
Figure 5 ApoEr2 deficient mice have no change in spine density in pyramidal neurons in cortical layers II/III at 1 year of age. Mouse brains were Golgi stained and neurons in cortical layers II/III imaged (n = 4 mice/genotype). A. Representative Golgi-impregnated pyramidal neuron in cortical layer II/III of a wild-type (left panel) and ApoEr2 knockout mice (right panel). B. Representative AO and BS dendrites per genotype. Black bar indicates 20 micrometer scale. C–E. Averaged spine densities for each genotype. C. Averaged total spine density, combining AO + BS dendrites (56 dendritic segments/group). D. Averaged spine density for AO spines (28 neurons/group). E. Averaged spine density for BS spines (28 neurons/group). Error bars are represented as S.E.M.CC BY · PubMed Central
Figure 6 ApoEr2 regulates synaptic protein levels. A. Cultured hippocampal neurons (DIV 14) were infected with ApoEr2 or GFP sindbis virus for 20 hours and stained for PSD-95. B. Quantification of average puncta intensity in (A) (10 neurons/group, *** p<0.001). C. Cultured hippocampal neurons (DIV 14) were infected with ApoEr2 or GFP sindbis virus for 20 hours, and stained for synaptophysin. D. Quantification of average intensity (left panel) and puncta number (right panel) in (C) (10 neurons/group, ** p<0.005). E. Cultured hippocampal neurons (DIV 14) were infected with ApoEr2 or GFP sindbis virus for 20 hours and stained for GluA1. F. Quantification of average intensity in (E) (10 neurons/group, ** p<0.005). G. Cultured hippocampal neurons (DIV 14) were infected with ApoEr2 or GFP sindbis virus for 20 hours and stained for GluA2. H. Quantification of average intensity in (G) (10 neurons/group, ** p<0.005). Error bars are represented as S.E.M. White bar represents 10 micrometers.
Figure 6 ApoEr2 regulates synaptic protein levels. A. Cultured hippocampal neurons (DIV 14) were infected with ApoEr2 or GFP sindbis virus for 20 hours and stained for PSD-95. B. Quantification of average puncta intensity in (A) (10 neurons/group, *** p<0.001). C. Cultured hippocampal neurons (DIV 14) were infected with ApoEr2 or GFP sindbis virus for 20 hours, and stained for synaptophysin. D. Quantification of average intensity (left panel) and puncta number (right panel) in (C) (10 neurons/group, ** p<0.005). E. Cultured hippocampal neurons (DIV 14) were infected with ApoEr2 or GFP sindbis virus for 20 hours and stained for GluA1. F. Quantification of average intensity in (E) (10 neurons/group, ** p<0.005). G. Cultured hippocampal neurons (DIV 14) were infected with ApoEr2 or GFP sindbis virus for 20 hours and stained for GluA2. H. Quantification of average intensity in (G) (10 neurons/group, ** p<0.005). Error bars are represented as S.E.M. White bar represents 10 micrometers.CC BY · PubMed Central
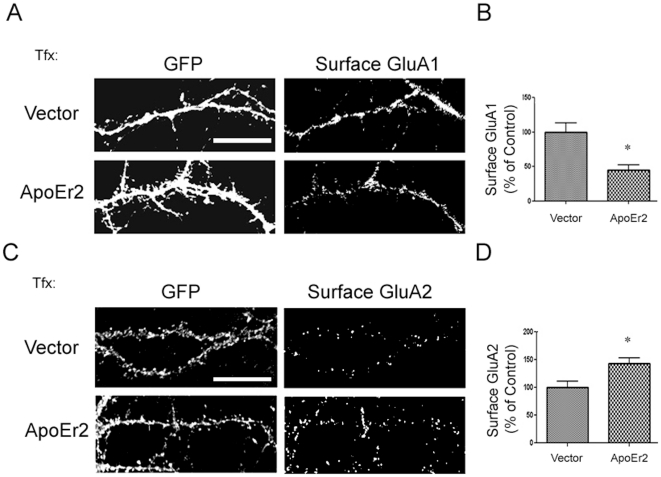
Figure 7 ApoEr2 decreases cell surface GluA1 and increases surface level of GluA2. A. Cultured hippocampal neurons (DIV 14) were transfected with GFP and empty vector or GFP and ApoEr2-myc for 48 hours and stained with an antibody recognizing the N terminus of GluA1 under impermeable conditions. B. Quantification of cell surface GluA1 levels in (A) (n = 15 neurons/group, * p<0.05). C. Cultured hippocampal neurons (DIV 14) were transfected with GFP and empty vector or GFP and ApoEr2-myc for 48 hours and stained with an antibody recognizing the N terminus of GluA2 under impermeable conditions D. Quantification of cell surface GluA2 levels in (C) (n = 15 neurons/group, * p<0.05). Error bars are represented as S.E.M. White bar represents 10 micrometers.
Figure 7 ApoEr2 decreases cell surface GluA1 and increases surface level of GluA2. A. Cultured hippocampal neurons (DIV 14) were transfected with GFP and empty vector or GFP and ApoEr2-myc for 48 hours and stained with an antibody recognizing the N terminus of GluA1 under impermeable conditions. B. Quantification of cell surface GluA1 levels in (A) (n = 15 neurons/group, * p<0.05). C. Cultured hippocampal neurons (DIV 14) were transfected with GFP and empty vector or GFP and ApoEr2-myc for 48 hours and stained with an antibody recognizing the N terminus of GluA2 under impermeable conditions D. Quantification of cell surface GluA2 levels in (C) (n = 15 neurons/group, * p<0.05). Error bars are represented as S.E.M. White bar represents 10 micrometers.CC BY · PubMed Central
Figure 8 X11α decreases cell surface ApoEr2 and inhibits ApoEr2- induced synapse and dendritic spine formation. A. COS7 cells were transfected with GFP-ApoEr2 and vector (lane 1,3) or X11α (lane 2,4). Cell surface proteins were biotin-labeled, isolated with avidin-beads, and immunoblotted with GFP for ApoEr2. Full length X11α decreased surface levels of ApoEr2 (upper blot). Cell lysates showed similar levels of total ApoEr2 (lower blot). B. Cultured hippocampal neurons were transfected at DIV12 with either GFP-ApoEr2 and empty vector (upper panel) or GFP-ApoEr2 and X11α (lower panel). Surface ApoEr2 was measured with GFP at DIV14 by immunofluorescence of live cells. Left panels, GFP-ApoEr2; right panels, surface ApoEr2. C. Quantification of cell surface ApoEr2 intensity in neuronal processes in (B). The cell surface staining in neuronal processes showed a 54% decrease in ApoEr2 by X11α (n = 13, *p<0.05). D. COS7 cells were transfected with GFP and empty-vector (n = 10), ApoEr2-HA and empty vector (n = 15), ApoEr2-HA and X11α (n = 8), or X11α and empty vector (n = 14) and then cultured with primary hippocampal neurons. COS7 cells were stained for GFP in the GFP and empty vector condition, HA for the ApoEr2-HA and vector or ApoEr2-HA and X11 condition or X11 for the X11 and vector condition to identify transfected COS7 cells (left panel). Synaptophysin puncta in neuronal processes (middle panels) identified presynaptic sites. E. Quantification of average synaptophysin cluster intensity from data in D (*p<0.05). F. Cultured hippocampal neurons (DIV 14) were transfected with GFP and empty vector, GFP and empty vector and ApoEr2-HA, GFP and empty vector and X11α, or GFP and ApoEr2-HA and X11α as indicated. After 48 hours, morphology of neurons and dendritic spines were visualized by GFP fluorescence. Magnified examples of representative dendritic segments are shown in lower panels. G. Quantification of spine density from F, with asterisks defining statistically significant differences from GFP-transfected cells (n = 10, p<0.05). Error bars are represented as S.E.M. White bar represents 10 micrometers.
Figure 8 X11α decreases cell surface ApoEr2 and inhibits ApoEr2- induced synapse and dendritic spine formation. A. COS7 cells were transfected with GFP-ApoEr2 and vector (lane 1,3) or X11α (lane 2,4). Cell surface proteins were biotin-labeled, isolated with avidin-beads, and immunoblotted with GFP for ApoEr2. Full length X11α decreased surface levels of ApoEr2 (upper blot). Cell lysates showed similar levels of total ApoEr2 (lower blot). B. Cultured hippocampal neurons were transfected at DIV12 with either GFP-ApoEr2 and empty vector (upper panel) or GFP-ApoEr2 and X11α (lower panel). Surface ApoEr2 was measured with GFP at DIV14 by immunofluorescence of live cells. Left panels, GFP-ApoEr2; right panels, surface ApoEr2. C. Quantification of cell surface ApoEr2 intensity in neuronal processes in (B). The cell surface staining in neuronal processes showed a 54% decrease in ApoEr2 by X11α (n = 13, *p<0.05). D. COS7 cells were transfected with GFP and empty-vector (n = 10), ApoEr2-HA and empty vector (n = 15), ApoEr2-HA and X11α (n = 8), or X11α and empty vector (n = 14) and then cultured with primary hippocampal neurons. COS7 cells were stained for GFP in the GFP and empty vector condition, HA for the ApoEr2-HA and vector or ApoEr2-HA and X11 condition or X11 for the X11 and vector condition to identify transfected COS7 cells (left panel). Synaptophysin puncta in neuronal processes (middle panels) identified presynaptic sites. E. Quantification of average synaptophysin cluster intensity from data in D (*p<0.05). F. Cultured hippocampal neurons (DIV 14) were transfected with GFP and empty vector, GFP and empty vector and ApoEr2-HA, GFP and empty vector and X11α, or GFP and ApoEr2-HA and X11α as indicated. After 48 hours, morphology of neurons and dendritic spines were visualized by GFP fluorescence. Magnified examples of representative dendritic segments are shown in lower panels. G. Quantification of spine density from F, with asterisks defining statistically significant differences from GFP-transfected cells (n = 10, p<0.05). Error bars are represented as S.E.M. White bar represents 10 micrometers.CC BY · PubMed Central
Figure 9 PSD-95 increases cell surface ApoEr2 and increases ApoEr2- induced synapse and dendrite spine formation. A. Cultured hippocampal neurons were transfected at DIV12 with either GFP-ApoEr2 and empty vector (upper panel) or GFP-ApoEr2 and PSD-95 (lower panel). Surface ApoEr2 was measured with GFP at DIV14 by immunofluorescence of live cells. Left panels, GFP-ApoEr2; right panels, surface ApoEr2. B. Quantification of surface ApoEr2 intensity in neuronal processes in (A). The cell surface staining in neuronal processes showed a 49% increase in ApoEr2 by PSD-95 (n = 10, *p<0.05). C. COS7 cells were transfected with GFP and empty vector, ApoEr2-HA and empty vector, ApoEr2-HA and PSD-95, or PSD-95 and empty vector and then cultured with primary hippocampal neurons. COS7 cells were stained for GFP in the GFP and empty vector condition, HA for the ApoEr2-HA and vector or ApoEr2-HA and PSD-95 condition or PSD-95 for the PSD-95 and vector condition to identify transfected COS7 cells (left panel). Synaptophysin puncta in neuronal processes (middle panels) identifies presynaptic sites. D. Quantification of average synaptophysin cluster intensity from data in (C) (n = 9/condition, *p<0.05). E. Cultured hippocampal neurons were transfected at DIV 14 with GFP and empty vector, GFP and ApoEr2 and empty vector, GFP and ApoEr2 and PSD-95, or GFP and empty vector and PSD-95 as indicated. 48 hours later, morphology of neurons and dendritic spines were visualized by GFP fluorescence. Magnified examples of representative dendritic segments are shown in lower panels. F. Quantification of spine density from (E), with asterisks defining statistically significant differences from GFP-transfected cells (n = 12, p<0.05). Error bars are represented as S.E.M. White bar represents 10 micrometers.
Figure 9 PSD-95 increases cell surface ApoEr2 and increases ApoEr2- induced synapse and dendrite spine formation. A. Cultured hippocampal neurons were transfected at DIV12 with either GFP-ApoEr2 and empty vector (upper panel) or GFP-ApoEr2 and PSD-95 (lower panel). Surface ApoEr2 was measured with GFP at DIV14 by immunofluorescence of live cells. Left panels, GFP-ApoEr2; right panels, surface ApoEr2. B. Quantification of surface ApoEr2 intensity in neuronal processes in (A). The cell surface staining in neuronal processes showed a 49% increase in ApoEr2 by PSD-95 (n = 10, *p<0.05). C. COS7 cells were transfected with GFP and empty vector, ApoEr2-HA and empty vector, ApoEr2-HA and PSD-95, or PSD-95 and empty vector and then cultured with primary hippocampal neurons. COS7 cells were stained for GFP in the GFP and empty vector condition, HA for the ApoEr2-HA and vector or ApoEr2-HA and PSD-95 condition or PSD-95 for the PSD-95 and vector condition to identify transfected COS7 cells (left panel). Synaptophysin puncta in neuronal processes (middle panels) identifies presynaptic sites. D. Quantification of average synaptophysin cluster intensity from data in (C) (n = 9/condition, *p<0.05). E. Cultured hippocampal neurons were transfected at DIV 14 with GFP and empty vector, GFP and ApoEr2 and empty vector, GFP and ApoEr2 and PSD-95, or GFP and empty vector and PSD-95 as indicated. 48 hours later, morphology of neurons and dendritic spines were visualized by GFP fluorescence. Magnified examples of representative dendritic segments are shown in lower panels. F. Quantification of spine density from (E), with asterisks defining statistically significant differences from GFP-transfected cells (n = 12, p<0.05). Error bars are represented as S.E.M. White bar represents 10 micrometers.CC BY · PubMed Central

Verification

Claims the paper makes

The claims and statistics of this paper haven’t been checked yet.

Free: it reads the open-access text and checks the first 5 claims that cite a source we can check. Create a free account to check every claim.

A few free checks a day · papers already verified open instantly · results are public

Claims other papers make about this one

Each is checked against this paper’s own text: does it say what the citing paper says it does?

Self-check

Percentages, sums and reported differences re-computed from the paper’s own numbers.

The self-check needs the paper’s full text.

Citations

Cites

Show all 45 references

Research works printed but not linked: 2

  1. HS Hoe, 2006, Apolipoprotein E Receptor 2 Interactions with the N-Methyl-D-aspartate Receptor., J Biol Chem, 281, 3425, 10.1074/jbc.M509380200 · DOI
  2. DT Pak, 2001, Regulation of dendritic spine morphology by SPAR, a PSD-95-associated RapGAP., Neuron, 31, 289, 10.1016/S0896-6273(01)00355-5 · DOI · Paper page

Cited by

See all 45

Metadata

Authors
Dumanis, S. B., Cha, H.-J., Song, J. M., Trotter, J. H., Spitzer, M., Lee, J.-Y., Weeber, E. J., Turner, R. S., Pak, D. T. S., Rebeck, G. W., & Hoe, H.-S.
Affiliations
  • Georgetown University Medical Center (US)
  • University of South Florida (US)
Corresponding author
Hoe, Hyang-Sook
Venue
PLoS ONE
Published
2011-02-15
Volume
6
Issue
2
Pages
e17203
ISSN
1932-6203 (ISSN-L)
OpenAlex
W2045877537
Cited by
45
References
45
Citations by year
2026: 1 · 2025: 1 · 2024: 1 · 2023: 3 · 2022: 3 · 2021: 1 · 2020: 2 · 2019: 4 · 2018: 2 · 2017: 5 · 2016: 4 · 2015: 3 · 2014: 6 · 2013: 5 · 2012: 3
FWCI
1.99
Type
journal article
Language
en
Open access
Locations
  • PLoS ONE (publishedVersion, cc-by)
  • PubMed Central (publishedVersion, cc-by)
  • PubMed (publishedVersion)
  • DOAJ (DOAJ: Directory of Open Access Journals) (submittedVersion, cc-by-sa)
  • Figshare (submittedVersion, cc-by)
Funders
  • National Science Foundation
  • Department of Transportation of Sichuan Province
  • National Institutes of Health
  • National Institute on Aging (R01AG026478, P01AG030128, AG032330-02S1, R03AG034253, R03AG032330, AG032330, AG034253, AG026478)
  • National Institute of Neurological Disorders and Stroke (R01NS048085, NS048085)
Topics
  • Life Sciences › Neuroscience › Cellular and Molecular Neuroscience › Neuroscience and Neuropharmacology Research
  • Life Sciences › Biochemistry, Genetics and Molecular Biology › Genetics › Genetics and Neurodevelopmental Disorders
  • Life Sciences › Neuroscience › Cellular and Molecular Neuroscience › Alzheimer's disease research and treatments
Keywords
synaptogenesis, dendritic spine formation, PSD-95, synaptophysin, hippocampal neurons, ApoE-deficient mice, learning and memory, long-term potentiation
MeSH terms
Disks Large Homolog 4 Protein, Animals, Chlorocebus aethiops, Cytoplasm, Extracellular Space, Hippocampus, Humans, Membrane Proteins, Nerve Tissue Proteins, Synapses, Protein Structure, Tertiary, Receptors, AMPA, Coculture Techniques, COS Cells, LDL-Receptor Related Proteins, Adaptor Proteins, Signal Transducing, Dendritic Spines, Mice, Guanylate Kinases

About these checks

Registry, retraction, Cites and statistics results are computed, not judged, with one exception: a printed reference that no index lists is read once by a model before it counts as a citation error. Claims are extracted by a model and kept only when their quote appears verbatim in the text; each cited source is then checked, with a model’s help, for whether it says what the claim relies on. Those verdicts can be wrong — read the claim’s quote and the cited source before relying on one.

Statistics and arithmetic are recomputed, not judged.

Confidence bands are shown only for fields calibrated on our annotated test set. None is calibrated yet, so no band is shown.

What counts as a claim ›How we measure confidence ›How we check this ›

Are you an author, or do you see a problem with this page? Request a review

How to cite

Cite CoChat for the checks on this page, and the paper for its own findings.

This page
CoChat. (2026). Citation check: ApoE Receptor 2 Regulates Synapse and Dendritic Spine Formation. https://app.cochat.ai/papers/10.1371/journal.pone.0017203
The paper
Dumanis, S. B., Cha, H.-J., Song, J. M., Trotter, J. H., Spitzer, M., Lee, J.-Y., Weeber, E. J., Turner, R. S., Pak, D. T. S., Rebeck, G. W., & Hoe, H.-S. (2011). ApoE Receptor 2 Regulates Synapse and Dendritic Spine Formation. PLoS ONE. https://doi.org/10.1371/journal.pone.0017203

Data sources

Bibliographic data: Semantic Scholar, OpenAlex, Crossref.

Contains information from the Semantic Scholar Academic Graph Datasets, made available under the ODC Attribution License (ODC-BY 1.0).

Semantic Scholar’s data is described in: Kinney, R., et al. (2023). The Semantic Scholar Open Data Platform. arXiv:2301.10140.