Cited by 65

The DOI matches its Crossref record; 8 of the 8 references it cites were found in a registry or an index.

Abrogated Inflammatory Response Promotes Neurogenesis in a Murine Model of Japanese Encephalitis

Das, Sulagna, Dutta, Kallol, Kumawat, Kanhaiya Lal, Ghoshal, Ayan, Adhya, Dwaipayan, Basu, Anirban·2011·PLoS ONE

Overview

The claims and statistics of this paper haven’t been checked yet.

Run the check — free, no account needed. It reads the open-access text and checks the sources it cites.

A few free checks a day · papers already verified open instantly · results are public

Integrity signals

Registry

Crossref · 10.1371/journal.pone.0017225

Cites

8 of 8 references verified0 citation errors · 0 not checkable

Statistics

Figures

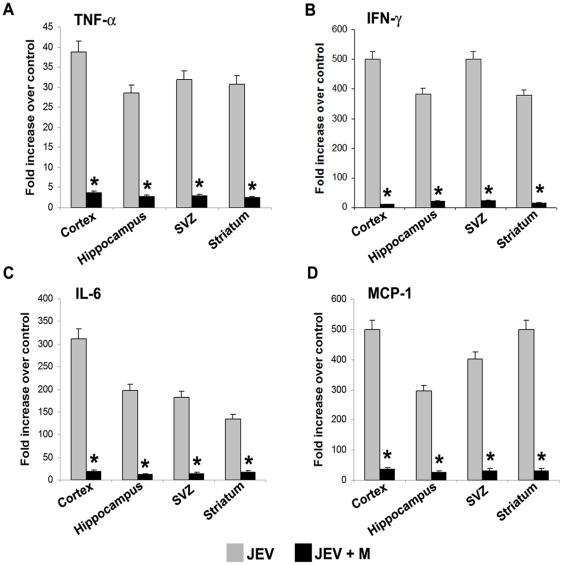
Figure 1 Decreased production of proinflammatory cyto/chemokines across various regions of the adult JEV-infected brain by minocycline administration. Protein isolated from cortex, hippocampus, SVZ and striatum of Control, JEV-infected and JEV+M animals were analyzed using CBA. The graphs depict the fold increase in TNF-α (A), IFN-γ (B), IL-6 (C) and MCP-1 (D) levels in the JEV-infected and JEV+M treated brain areas compared to those from control brain. A profound increase in the cytokine level of TNF-α (A), IFN-γ (B), IL-6 (C), and MCP-1 (D) was observed in all the areas of JEV-infected brain, which was dramatically reduced upon minocycline administration in JEV+M animals. (Values represent means ± SEM from five animals in each group; * significant change from JEV, p<0.01).
Figure 1 Decreased production of proinflammatory cyto/chemokines across various regions of the adult JEV-infected brain by minocycline administration. Protein isolated from cortex, hippocampus, SVZ and striatum of Control, JEV-infected and JEV+M animals were analyzed using CBA. The graphs depict the fold increase in TNF-α (A), IFN-γ (B), IL-6 (C) and MCP-1 (D) levels in the JEV-infected and JEV+M treated brain areas compared to those from control brain. A profound increase in the cytokine level of TNF-α (A), IFN-γ (B), IL-6 (C), and MCP-1 (D) was observed in all the areas of JEV-infected brain, which was dramatically reduced upon minocycline administration in JEV+M animals. (Values represent means ± SEM from five animals in each group; * significant change from JEV, p<0.01).CC BY · PubMed Central
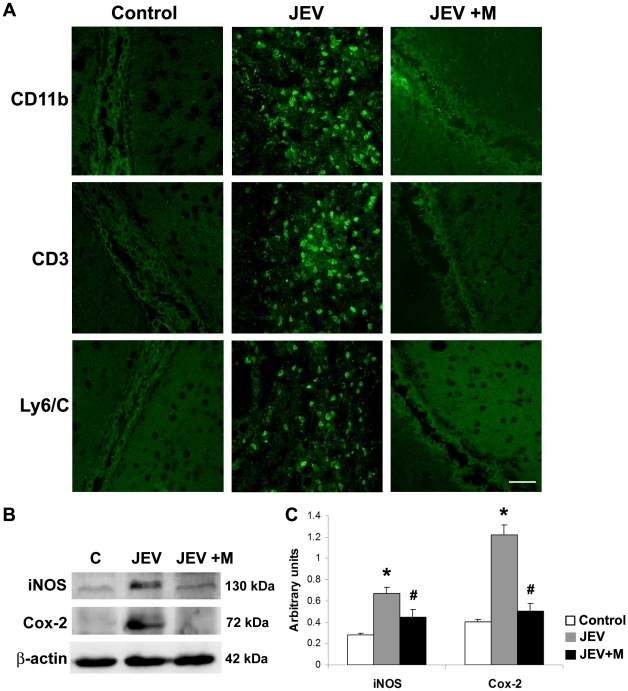
Figure 2 Attenuation of inflammatory milieu in the infected adult SVZ by minocycline administration. Cryostat sections of brains from control, JEV and JEV+M animal groups were stained for cells of monocyte/macrophage lineage (CD11b), T-cells (CD3) and neutrophils (Ly6/C), (FITC, green) (A). Images were acquired using oil immersion lens of confocal microscope. These peripheral immune cells were completely absent in the SVZ of control and JEV+M brains. In SVZ of JEV-infected animals, a large number of these cells were observed; scale bar is 50 µ. Protein isolated from SVZ of control, JEV and JEV+M animals were analyzed by immunoblot (B). Increased expression of iNOS and Cox-2 in JEV-infected SVZ was reduced significantly in JEV+M SVZ. The graphs represent densitometric quantification of proteins bands of iNOS and Cox-2 normalised to β-actin (C). Values represent the means ± SEM from five animals in each group (* significant change from control p<0.01; # significant change from JEV-infected samples p<0.01).
Figure 2 Attenuation of inflammatory milieu in the infected adult SVZ by minocycline administration. Cryostat sections of brains from control, JEV and JEV+M animal groups were stained for cells of monocyte/macrophage lineage (CD11b), T-cells (CD3) and neutrophils (Ly6/C), (FITC, green) (A). Images were acquired using oil immersion lens of confocal microscope. These peripheral immune cells were completely absent in the SVZ of control and JEV+M brains. In SVZ of JEV-infected animals, a large number of these cells were observed; scale bar is 50 µ. Protein isolated from SVZ of control, JEV and JEV+M animals were analyzed by immunoblot (B). Increased expression of iNOS and Cox-2 in JEV-infected SVZ was reduced significantly in JEV+M SVZ. The graphs represent densitometric quantification of proteins bands of iNOS and Cox-2 normalised to β-actin (C). Values represent the means ± SEM from five animals in each group (* significant change from control p<0.01; # significant change from JEV-infected samples p<0.01).CC BY · PubMed Central
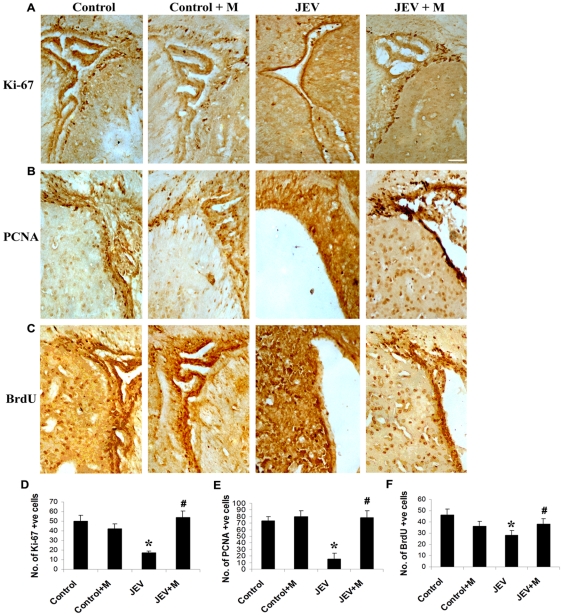
Figure 3 Replenishment of proliferating cells in the infected adult SVZ by minocycline administration. Cryostat sections of brains from control, control+M, JEV and JEV+M animal groups were stained for markers of proliferation- Ki-67 (A) and PCNA (B) and developed using DAB substrate. BrdU was also administered to animals for 5 days at 50 mg/kg body weight and then animals were sacrificed 6 h after the last BrdU injection. Cryostat sections from BrdU administered animals from all groups were stained using anti-BrdU antibody (C). Discrete population of cells in control SVZ show localisation of all the antigens. While reduced population of all three cell types were observed in JEV-infected SVZ, however, they were replenished in the SVZ from JEV+M animals. The graphs represent the number of Ki-67 (D), PCNA (E) and BrdU (F) positive cells in the SVZ from the different treatment groups. Cell counting was done using5 serial sections from 3 animals with Leica IM50 software. Values represent means ± SEM from three animals in each group (* significant change from control, p<0.05; #significant change from JEV-infected animals, p<0.05); scale bar is 50 µ.
Figure 3 Replenishment of proliferating cells in the infected adult SVZ by minocycline administration. Cryostat sections of brains from control, control+M, JEV and JEV+M animal groups were stained for markers of proliferation- Ki-67 (A) and PCNA (B) and developed using DAB substrate. BrdU was also administered to animals for 5 days at 50 mg/kg body weight and then animals were sacrificed 6 h after the last BrdU injection. Cryostat sections from BrdU administered animals from all groups were stained using anti-BrdU antibody (C). Discrete population of cells in control SVZ show localisation of all the antigens. While reduced population of all three cell types were observed in JEV-infected SVZ, however, they were replenished in the SVZ from JEV+M animals. The graphs represent the number of Ki-67 (D), PCNA (E) and BrdU (F) positive cells in the SVZ from the different treatment groups. Cell counting was done using5 serial sections from 3 animals with Leica IM50 software. Values represent means ± SEM from three animals in each group (* significant change from control, p<0.05; #significant change from JEV-infected animals, p<0.05); scale bar is 50 µ.CC BY · PubMed Central
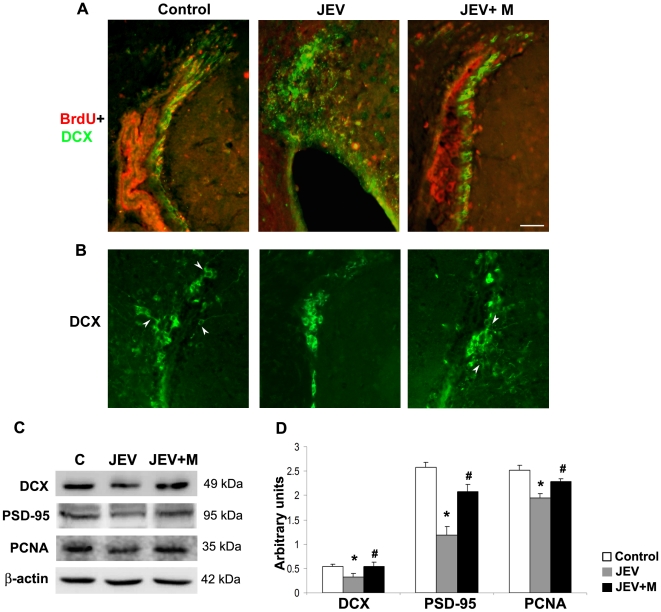
Figure 4 Population of migrating neuroblasts restored in adult infected SVZ by minocycline administration. Cryostat sections of brains from control, JEV and JEV+M animal groups were labelled for proliferating cells of neuronal lineage (BrdU+DCX double staining) (A) or for migrating neuroblasts (DCX positive cells) (B). Control SVZ show marked co-localization of BrdU (Alexa Fluor, red) and DCX (FITC, green). These double positive cells were distinctly lesser in the JEV-infected SVZ compared to control SVZ, which was however restored in JEV+M SVZ (A). DCX staining (FITC, green) show migrating neuroblasts in control SVZ and in SVZ from JEV+M animals with neurite extending outwards (shown by arrowheads), was completely absent in JEV-infected SVZ (B); scale bar is 50 µ. Protein isolated from SVZ of control, JEV and JEV+M animals were analyzed by immunoblot (C). Expression of DCX, PSD-95 and PCNA declined in JEV-infected SVZ, which in JEV+M SVZ was elevated almost to control levels. The graph represents densitometric quantification of proteins bands of DCX, PSD-95 and PCNA, normalised to β-actin (D). Values represent the means ± SEM from five animals in each group (* significant change from control p<0.05; # significant change from JEV samples p<0.05).
Figure 4 Population of migrating neuroblasts restored in adult infected SVZ by minocycline administration. Cryostat sections of brains from control, JEV and JEV+M animal groups were labelled for proliferating cells of neuronal lineage (BrdU+DCX double staining) (A) or for migrating neuroblasts (DCX positive cells) (B). Control SVZ show marked co-localization of BrdU (Alexa Fluor, red) and DCX (FITC, green). These double positive cells were distinctly lesser in the JEV-infected SVZ compared to control SVZ, which was however restored in JEV+M SVZ (A). DCX staining (FITC, green) show migrating neuroblasts in control SVZ and in SVZ from JEV+M animals with neurite extending outwards (shown by arrowheads), was completely absent in JEV-infected SVZ (B); scale bar is 50 µ. Protein isolated from SVZ of control, JEV and JEV+M animals were analyzed by immunoblot (C). Expression of DCX, PSD-95 and PCNA declined in JEV-infected SVZ, which in JEV+M SVZ was elevated almost to control levels. The graph represents densitometric quantification of proteins bands of DCX, PSD-95 and PCNA, normalised to β-actin (D). Values represent the means ± SEM from five animals in each group (* significant change from control p<0.05; # significant change from JEV samples p<0.05).CC BY · PubMed Central
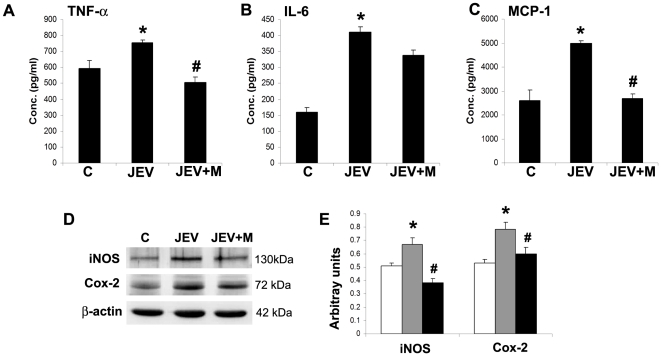
Figure 5 Expression of inflammatory molecules in JEV activated BV2 is attenuated by minocycline treatment. Mouse microglia BV2 were either control (C), JEV-infected (JEV) or JEV-infected and treated with minocycline (JEV+M). After 6 h of minocycline treatment p.i., fresh DMEM-F12 media was added to all conditions. After additional 6 h, CM from BV2 cells from all conditions was collected for CBA and protein extracted for immunoblot. The graphs depict the concentration in pg/ml of cyto/chemokines TNF-α (A), IL-6 (B) and MCP-1 (C) in Control, JEV-infected and JEV+M treated BV2 cells. Values represent means ± SEM from 3 independent experiments performed in duplicate (* significant change from control, p<0.05; # significant change from JEV, p<0.05). Protein isolated from BV2 cells from C, JEV and JEV+M conditions were analyzed by immunoblot (D). The graphs represent the densitometric quantification of protein bands- iNOS and Cox-2 normalised to β-actin (E). Values represent mean ± SEM from 3 independent experiments performed in duplicate (* significant change from control, p<0.05; # significant change from JEV, p<0.05).
Figure 5 Expression of inflammatory molecules in JEV activated BV2 is attenuated by minocycline treatment. Mouse microglia BV2 were either control (C), JEV-infected (JEV) or JEV-infected and treated with minocycline (JEV+M). After 6 h of minocycline treatment p.i., fresh DMEM-F12 media was added to all conditions. After additional 6 h, CM from BV2 cells from all conditions was collected for CBA and protein extracted for immunoblot. The graphs depict the concentration in pg/ml of cyto/chemokines TNF-α (A), IL-6 (B) and MCP-1 (C) in Control, JEV-infected and JEV+M treated BV2 cells. Values represent means ± SEM from 3 independent experiments performed in duplicate (* significant change from control, p<0.05; # significant change from JEV, p<0.05). Protein isolated from BV2 cells from C, JEV and JEV+M conditions were analyzed by immunoblot (D). The graphs represent the densitometric quantification of protein bands- iNOS and Cox-2 normalised to β-actin (E). Values represent mean ± SEM from 3 independent experiments performed in duplicate (* significant change from control, p<0.05; # significant change from JEV, p<0.05).CC BY · PubMed Central
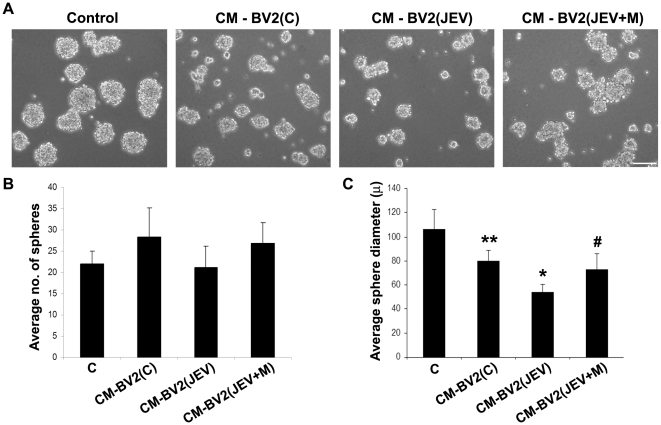
Figure 6 Impaired neurosphere formation by soluble mediators from JEV activated microglia is reversed by minocycline treatment. Single cell suspensions of NSPCs were cultured alone (C) or in presence of BV2-derived CM under 3 conditions- BV2(C), BV2(JEV), BV2(JEV+M) for 3 days. Phase-contrast micrographs of neurospheres were acquired under 10× magnification (A). Scale bar is 100 µ. The number of neurospheres was counted from 10 different fields for each condition and the average diameter of the spheres was measured using Leica IM50 software. The graphs represent the average number of spheres (B) and their average diameter in microns (C). The numbers of colony forming neurospheres do not show any significant difference between groups (B). The reduction in size of neurospheres grown in CM from BV2(JEV) was prominent compared to CM-BV2(C) or CM-BV2(JEV+M) conditions (C). Values represent mean ± SEM from 3 independent experiments performed in duplicate (** significant change from control, p<0.05; * significant change from CM-BV2(C), p<0.01; # significant change from CM-BV2(JEV), p<0.01).
Figure 6 Impaired neurosphere formation by soluble mediators from JEV activated microglia is reversed by minocycline treatment. Single cell suspensions of NSPCs were cultured alone (C) or in presence of BV2-derived CM under 3 conditions- BV2(C), BV2(JEV), BV2(JEV+M) for 3 days. Phase-contrast micrographs of neurospheres were acquired under 10× magnification (A). Scale bar is 100 µ. The number of neurospheres was counted from 10 different fields for each condition and the average diameter of the spheres was measured using Leica IM50 software. The graphs represent the average number of spheres (B) and their average diameter in microns (C). The numbers of colony forming neurospheres do not show any significant difference between groups (B). The reduction in size of neurospheres grown in CM from BV2(JEV) was prominent compared to CM-BV2(C) or CM-BV2(JEV+M) conditions (C). Values represent mean ± SEM from 3 independent experiments performed in duplicate (** significant change from control, p<0.05; * significant change from CM-BV2(C), p<0.01; # significant change from CM-BV2(JEV), p<0.01).CC BY · PubMed Central
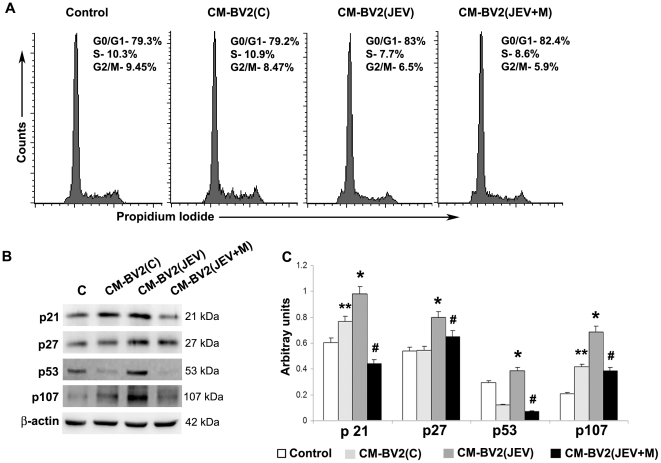
Figure 7 Induction of cell cycle arrest by soluble mediators from JEV activated microglia is reversed by minocycline treatment. Cell cycle analysis of single cell suspensions of neurospheres grown alone or in presence of BV2-CM was performed using RNase/PI buffer and detected by FACS. Gates were set to assess the percentages of G0/G1 (2n DNA), S (>2n DNA) and G2/M (4n DNA) cells using Cell Quest Pro Software, and the representative histograms have been shown (A). Data is representative of 3 independent experiments. Protein isolated from control and BV2-CM treated neurospheres were immunoblotted for checkpoint proteins p21, p27, p53 and p107 (B). The expression of all these proteins increased in neurospheres grown in CM from BV2(JEV) compared to that from BV2(C) or from BV2(JEV+M) (C). Densitometric analysis of immunoblot normalised to β-actin was plotted as a bar graph. Values represent mean ± SEM from three independent experiments. (** significant change from control, p<0.05; * significant change from CM-BV2(C), p<0.05; # significant change from CM-BV2(JEV), p<0.05).
Figure 7 Induction of cell cycle arrest by soluble mediators from JEV activated microglia is reversed by minocycline treatment. Cell cycle analysis of single cell suspensions of neurospheres grown alone or in presence of BV2-CM was performed using RNase/PI buffer and detected by FACS. Gates were set to assess the percentages of G0/G1 (2n DNA), S (>2n DNA) and G2/M (4n DNA) cells using Cell Quest Pro Software, and the representative histograms have been shown (A). Data is representative of 3 independent experiments. Protein isolated from control and BV2-CM treated neurospheres were immunoblotted for checkpoint proteins p21, p27, p53 and p107 (B). The expression of all these proteins increased in neurospheres grown in CM from BV2(JEV) compared to that from BV2(C) or from BV2(JEV+M) (C). Densitometric analysis of immunoblot normalised to β-actin was plotted as a bar graph. Values represent mean ± SEM from three independent experiments. (** significant change from control, p<0.05; * significant change from CM-BV2(C), p<0.05; # significant change from CM-BV2(JEV), p<0.05).CC BY · PubMed Central
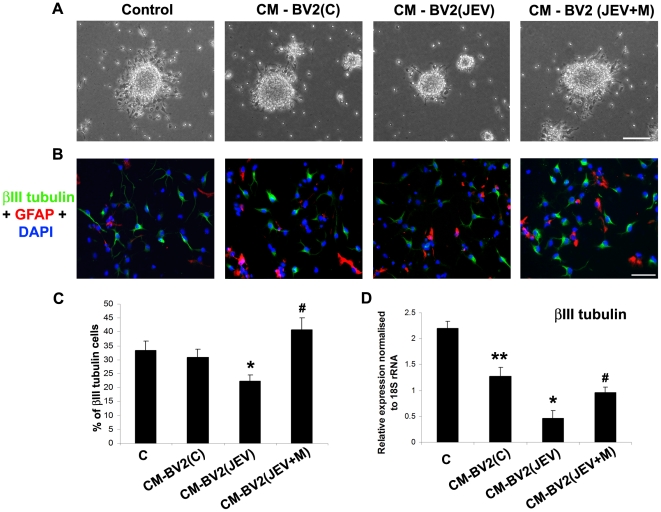
Figure 8 Decreased neuronal differentiation of NSPCs by soluble mediators from JEV activated microglia is reversed by minocycline treatment. Phase contrast micrographs of differentiating neurospheres from control and BV2 derived CM treated NSPCs 2 days after induction of differentiation on PDL-coated plates (A). Impaired migration and differentiation of cells from the periphery of the spheres is observed in CM-BV2(JEV) conditions. Control and BV2-Cm treated neurospheres were dissociated and single cell suspensions of NSPCs were differentiated for 2 days. The cells were fixed and double immunocytochemistry for β-III tubulin (neuronal phenotype) and GFAP (astrocytic phenotype) was performed and mounted with Vectashield containing DAPI. Distinct β-III tubulin positive cells (FITC, green) and GFAP positive cells (Alexa 594, red) were observed, indicating NSPCs undergoing differentiation (B). The percentage of β-III tubulin positive cells were calculated from 5 different fields and plotted as a representative graph (C). RNA was isolated from these NSPCs after 2 days of differentiation and qRT-PCR was performed for β-III tubulin expression. The graph represents relative mRNA expression of β-III tubulin normalised to the expression of constitutive 18S rRNA (D). Values represent mean ± SEM from three independent experiments performed in duplicate. (** significant change from control, p<0.05; * significant change from CM-BV2(C), p<0.01; # significant change from CM-BV2(JEV), p<0.01). Scale bar corresponds to 50 microns.
Figure 8 Decreased neuronal differentiation of NSPCs by soluble mediators from JEV activated microglia is reversed by minocycline treatment. Phase contrast micrographs of differentiating neurospheres from control and BV2 derived CM treated NSPCs 2 days after induction of differentiation on PDL-coated plates (A). Impaired migration and differentiation of cells from the periphery of the spheres is observed in CM-BV2(JEV) conditions. Control and BV2-Cm treated neurospheres were dissociated and single cell suspensions of NSPCs were differentiated for 2 days. The cells were fixed and double immunocytochemistry for β-III tubulin (neuronal phenotype) and GFAP (astrocytic phenotype) was performed and mounted with Vectashield containing DAPI. Distinct β-III tubulin positive cells (FITC, green) and GFAP positive cells (Alexa 594, red) were observed, indicating NSPCs undergoing differentiation (B). The percentage of β-III tubulin positive cells were calculated from 5 different fields and plotted as a representative graph (C). RNA was isolated from these NSPCs after 2 days of differentiation and qRT-PCR was performed for β-III tubulin expression. The graph represents relative mRNA expression of β-III tubulin normalised to the expression of constitutive 18S rRNA (D). Values represent mean ± SEM from three independent experiments performed in duplicate. (** significant change from control, p<0.05; * significant change from CM-BV2(C), p<0.01; # significant change from CM-BV2(JEV), p<0.01). Scale bar corresponds to 50 microns.CC BY · PubMed Central

Verification

Claims the paper makes

The claims and statistics of this paper haven’t been checked yet.

Run the check — free, no account needed. It reads the open-access text and checks the sources it cites.

A few free checks a day · papers already verified open instantly · results are public

Claims other papers make about this one

Each is checked against this paper’s own text: does it say what the citing paper says it does?

Self-check

Percentages, sums and reported differences re-computed from the paper’s own numbers.

The self-check needs the paper’s full text.

Citations

Cites

Research works printed but not linked: 57

  1. JK Olson, 2004, Microglia initiate central nervous system innate and adaptive immune responses through multiple TLRs., J Immunol, 173, 3916, 10.4049/jimmunol.173.6.3916 · DOI · Paper page
  2. A Ghoshal, 2007, Proinflammatory mediators released by activated microglia induces neuronal death in Japanese encephalitis., Glia, 55, 483, 10.1002/glia.20474 · DOI
  3. M Kaul, 2005, HIV-1 infection and AIDS: consequences for the central nervous system., Cell Death Differ, 12, 878, 10.1038/sj.cdd.4401623 · DOI
  4. M Kaul, 2006, Mechanisms of neuronal injury and death in HIV-1 associated dementia., Curr HIV Res, 4, 307, 10.2174/157016206777709384 · DOI
  5. D Ghosh, 2009, Japanese encephalitis-a pathological and clinical perspective., PLoS Negl Trop Dis, 3, e437, 10.1371/journal.pntd.0000437 · DOI
  6. UK Misra, Overview: Japanese encephalitis., Prog Neurobiol, 91, 108, 10.1016/j.pneurobio.2010.01.008 · DOI
  7. RW Richter, 1961, Neurologic sequelae of Japanese B encephalitis., Neurology, 11, 553, 10.1212/WNL.11.7.553 · DOI
  8. FP Monnet, 2003, Behavioural disturbances following Japanese B encephalitis., Eur Psychiatry, 18, 269, 10.1016/j.eurpsy.2003.09.001 · DOI
  9. V Swarup, 2007, Tumor necrosis factor receptor-1-induced neuronal death by TRADD contributes to the pathogenesis of Japanese encephalitis., J Neurochem, 103, 771, 10.1111/j.1471-4159.2007.04790.x · DOI
  10. S Das, 2008, Inflammation: A New Candidate in Modulating Adult Neurogenesis., J Neurosci Res, 86, 1199, 10.1002/jnr.21585 · DOI
  11. GL Ming, 2005, Adult neurogenesis in the mammalian central nervous system., Annu Rev Neurosci, 28, 223, 10.1146/annurev.neuro.28.051804.101459 · DOI
  12. DK Ma, 2009, Adult neural stem cells in the mammalian central nervous system., Cell Res, 19, 672, 10.1038/cr.2009.56 · DOI
  13. T Ben-Hur, 2003, Effects of proinflammatory cytokines on the growth, fate, and motility of multipotential neural precursor cells., Mol Cell Neurosci, 24, 623, 10.1016/S1044-7431(03)00218-5 · DOI
  14. YP Liu, 2005, Tumor necrosis factor-alpha and interleukin-18 modulate neuronal cell fate in embryonic neural progenitor culture., Brain Res, 1054, 152, 10.1016/j.brainres.2005.06.085 · DOI
  15. BZ Barkho, 2006, Identification of astrocyte-expressed factors that modulate neural stem/progenitor cell differentiation., Stem Cells Dev, 15, 407, 10.1089/scd.2006.15.407 · DOI
  16. N Kuzumaki, 2010, Enhanced IL-1beta production in response to the activation of hippocampal glial cells impairs neurogenesis in aged mice., Synapse, 64, 721, 10.1002/syn.20800 · DOI
  17. RE Iosif, 2006, Tumor necrosis factor receptor 1 is a negative regulator of progenitor proliferation in adult hippocampal neurogenesis., J Neurosci, 26, 9703, 10.1523/JNEUROSCI.2723-06.2006 · DOI
  18. CT Ekdahl, 2009, Brain inflammation and adult neurogenesis: the dual role of microglia., Neuroscience, 158, 1021, 10.1016/j.neuroscience.2008.06.052 · DOI · Paper page
  19. MD Krathwohl, 2004, Chemokines promote quiescence and survival of human neural progenitor cells., Stem Cells, 22, 109, 10.1634/stemcells.22-1-109 · DOI
  20. PB Tran, 2005, HIV-1, chemokines and neurogenesis., Neurotox Res, 8, 149, 10.1007/BF03033826 · DOI
  21. H Peng, 2008, HIV-1-infected and/or immune-activated macrophage-secreted TNF-alpha affects human fetal cortical neural progenitor cell proliferation and differentiation., Glia, 56, 903, 10.1002/glia.20665 · DOI
  22. L Poluektova, 2005, Macrophage-induced inflammation affects hippocampal plasticity and neuronal development in a murine model of HIV-1 encephalitis., Glia, 52, 344, 10.1002/glia.20253 · DOI
  23. BD Hoehn, 2005, Neurogenesis in rats after focal cerebral ischemia is enhanced by indomethacin., Stroke, 36, 2718, 10.1161/01.STR.0000190020.30282.cc · DOI
  24. Z Liu, 2007, Chronic treatment with minocycline preserves adult new neurons and reduces functional impairment after focal cerebral ischemia., Stroke, 38, 146, 10.1161/01.STR.0000251791.64910.cd · DOI
  25. MK Mishra, 2008, Minocycline neuroprotects, reduces microglial activation, inhibits caspase 3 induction, and viral replication following Japanese encephalitis., J Neurochem, 105, 1582, 10.1111/j.1471-4159.2008.05238.x · DOI
  26. S Das, 2008, Japanese encephalitis virus infects neural progenitor cells and decreases their proliferation., J Neurochem, 106, 1624, 10.1111/j.1471-4159.2008.05511.x · DOI
  27. S Vrati, 1999, Molecular characterization of an Indian isolate of Japanese encephalitis virus that shows an extended lag phase during growth., J Gen Virol, 80, 1665, 10.1099/0022-1317-80-7-1665 · DOI · Paper page
  28. S Das, 2009, Japanese encephalitis virus induce immuno-competency in neural stem/progenitor cells., PLoS One, 4, e8134, 10.1371/journal.pone.0008134 · DOI
  29. MK Mishra, 2007, Neuroprotection conferred by astrocytes is insufficient to protect animals from succumbing to Japanese encephalitis., Neurochem Int, 50, 764, 10.1016/j.neuint.2007.01.014 · DOI
  30. R Tewari, 2008, Involvement of miltefosine-mediated ERK activation in glioma cell apoptosis through Fas regulation., J Neurochem, 107, 616, 10.1111/j.1471-4159.2008.05625.x · DOI
  31. UC Chaturvedi, 1979, Variable effect on peripheral blood leucocytes during JE virus infection of man., Clin Exp Immunol, 38, 492
  32. A Mathur, 1992, Breakdown of blood-brain barrier by virus-induced cytokine during Japanese encephalitis virus infection., Int J Exp Pathol, 73, 603
  33. V Swarup, 2008, Tumor necrosis factor receptor-associated death domain mediated neuronal death contributes to the glial activation and subsequent neuroinflammation in Japanese encephalitis., Neurochem Int, 52, 1310, 10.1016/j.neuint.2008.01.014 · DOI
  34. MK Mishra, 2009, Understanding the molecular mechanism of blood-brain barrier damage in an experimental model of Japanese encephalitis: correlation with minocycline administration as a therapeutic agent., Neurochem Int, 55, 717, 10.1016/j.neuint.2009.07.006 · DOI
  35. F Doetsch, 2003, A niche for adult neural stem cells., Curr Opin Genet Dev, 13, 543, 10.1016/j.gde.2003.08.012 · DOI
  36. G Martino, 2006, The therapeutic potential of neural stem cells., Nat Rev Neurosci, 7, 395, 10.1038/nrn1908 · DOI
  37. MJ Romanko, 2004, Roles of the mammalian subventricular zone in cell replacement after brain injury., Prog Neurobiol, 74, 77, 10.1016/j.pneurobio.2004.07.001 · DOI
  38. F Lazarini, 2009, Cellular and behavioral effects of cranial irradiation of the subventricular zone in adult mice., PLoS One, 4, e7017, 10.1371/journal.pone.0007017 · DOI
  39. K Mori, Peripherally injected lipopolysaccharide induces apoptosis in the subventricular zone of young adult mice., Neurosci Lett
  40. S Pluchino, 2008, Persistent inflammation alters the function of the endogenous brain stem cell compartment., Brain, 131, 2564, 10.1093/brain/awn198 · DOI
  41. U Heldmann, 2005, TNF-alpha antibody infusion impairs survival of stroke-generated neuroblasts in adult rat brain., Exp Neurol, 196, 204, 10.1016/j.expneurol.2005.07.024 · DOI
  42. T Tikka, 2001, Minocycline, a tetracycline derivative, is neuroprotective against excitotoxicity by inhibiting activation and proliferation of microglia., J Neurosci, 21, 2580, 10.1523/JNEUROSCI.21-08-02580.2001 · DOI · Paper page
  43. TM Reyes, 1998, The proinflammatory cytokine network: interactions in the CNS and blood of rhesus monkeys., Am J Physiol, 274, R139
  44. E Cacci, 2008, In vitro neuronal and glial differentiation from embryonic or adult neural precursor cells are differently affected by chronic or acute activation of microglia., Glia, 56, 412, 10.1002/glia.20616 · DOI
  45. E Cacci, 2005, Microglia-derived tumor necrosis factor-alpha exaggerates death of newborn hippocampal progenitor cells in vitro., J Neurosci Res, 80, 789, 10.1002/jnr.20531 · DOI
  46. G Wong, 2004, Interferon-gamma but not TNF alpha promotes neuronal differentiation and neurite outgrowth of murine adult neural stem cells., Exp Neurol, 187, 171, 10.1016/j.expneurol.2004.01.009 · DOI
  47. D Widera, 2006, Tumor necrosis factor alpha triggers proliferation of adult neural stem cells via IKK/NF-kappaB signaling., BMC Neurosci, 7, 64, 10.1186/1471-2202-7-64 · DOI
  48. L Bernardino, 2008, Tumor necrosis factor-alpha modulates survival, proliferation, and neuronal differentiation in neonatal subventricular zone cell cultures., Stem Cells, 26, 2361, 10.1634/stemcells.2007-0914 · DOI · Paper page
  49. M Nakanishi, 2007, Microglia-derived interleukin-6 and leukaemia inhibitory factor promote astrocytic differentiation of neural stem/progenitor cells., Eur J Neurosci, 25, 649, 10.1111/j.1460-9568.2007.05309.x · DOI
  50. ER Matarredona, 2005, Role of nitric oxide in subventricular zone neurogenesis., Brain Res Brain Res Rev, 49, 355, 10.1016/j.brainresrev.2005.01.001 · DOI
  51. C Romero-Grimaldi, 2006, Chronic inhibition of nitric oxide synthesis enhances both subventricular zone neurogenesis and olfactory learning in adult mice., Eur J Neurosci, 24, 2461, 10.1111/j.1460-9568.2006.05127.x · DOI
  52. A Torroglosa, 2007, Nitric oxide decreases subventricular zone stem cell proliferation by inhibition of epidermal growth factor receptor and phosphoinositide-3-kinase/Akt pathway., Stem Cells, 25, 88, 10.1634/stemcells.2006-0131 · DOI
  53. R Covacu, 2006, Nitric oxide exposure diverts neural stem cell fate from neurogenesis towards astrogliogenesis., Stem Cells, 24, 2792, 10.1634/stemcells.2005-0640 · DOI
  54. M Strassburger, 2008, Anti-inflammatory treatment with the p38 mitogen-activated protein kinase inhibitor SB239063 is neuroprotective, decreases the number of activated microglia and facilitates neurogenesis in oxygen-glucose-deprived hippocampal slice cultures., Eur J Pharmacol, 592, 55, 10.1016/j.ejphar.2008.06.099 · DOI
  55. Y Ziv, 2008, Orchestrating brain-cell renewal: the role of immune cells in adult neurogenesis in health and disease., Trends Mol Med, 14, 471, 10.1016/j.molmed.2008.09.004 · DOI · Paper page
  56. Y Ziv, 2008, Immune-based regulation of adult neurogenesis: implications for learning and memory., Brain Behav Immun, 22, 167, 10.1016/j.bbi.2007.08.006 · DOI
  57. MC Zink, 2005, Neuroprotective and anti-human immunodeficiency virus activity of minocycline., Jama, 293, 2003, 10.1001/jama.293.16.2003 · DOI

Cited by

Sorted by citations

See all 65

Metadata

Authors
Das, S., Dutta, K., Kumawat, K. L., Ghoshal, A., Adhya, D., & Basu, A.
Venue
PLoS ONE
Published
2011-03-03
Volume
6
Issue
3
Pages
e17225
ISSN
1932-6203
Cited by
65
References
8
Language
en

About these checks

Registry, retraction, Cites and statistics results are computed, not judged, with one exception: a printed reference that no index lists is read once by a model before it counts as a citation error. Claims are extracted by a model and kept only when their quote appears verbatim in the text; each cited source is then checked, with a model’s help, for whether it says what the claim relies on. Those verdicts can be wrong — read the claim’s quote and the cited source before relying on one.

Statistics and arithmetic are recomputed, not judged.

Confidence bands are shown only for fields calibrated on our annotated test set. None is calibrated yet, so no band is shown.

What counts as a claim ›How we measure confidence ›How we check this ›

Are you an author, or do you see a problem with this page? Request a review