

The DOI matches its Crossref record; 74 of the 74 references it cites were found in a registry or an index.
Graph Theoretical Analysis of Functional Brain Networks: Test-Retest Evaluation on Short- and Long-Term Resting-State Functional MRI Data
Open accessAbstract
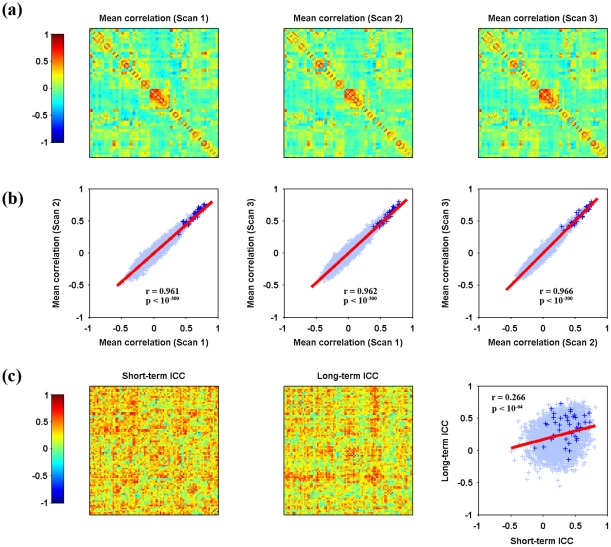
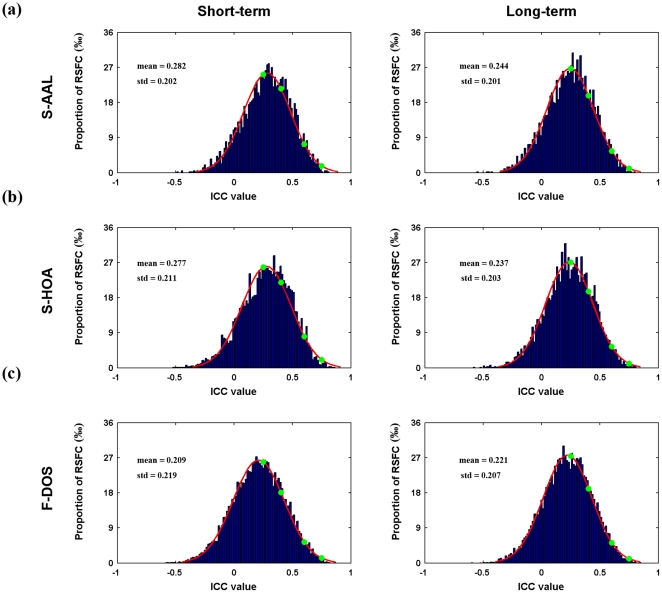
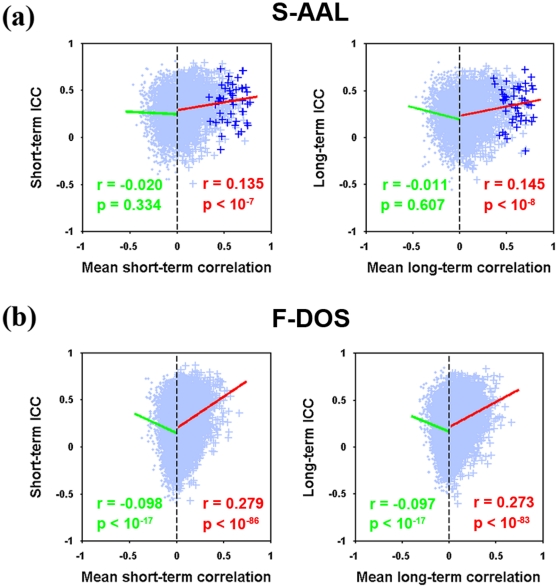
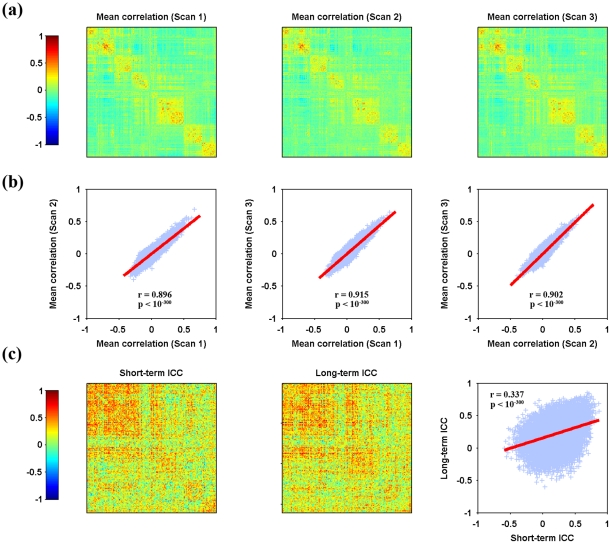
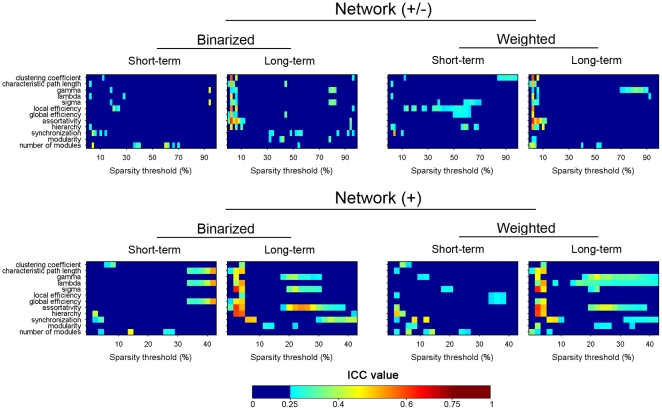
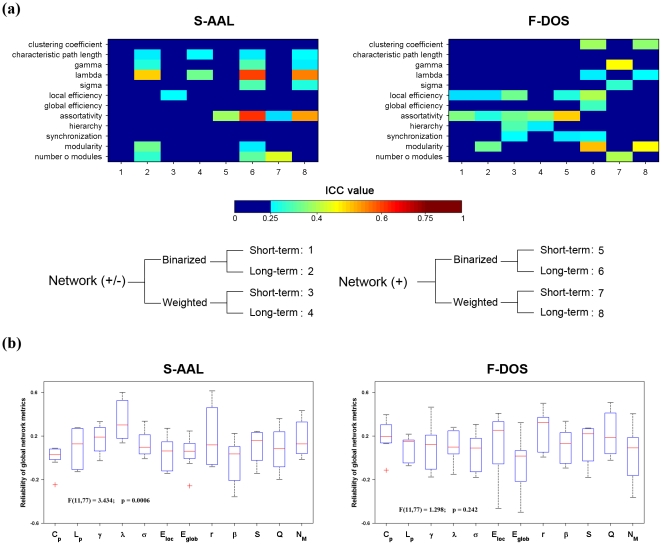
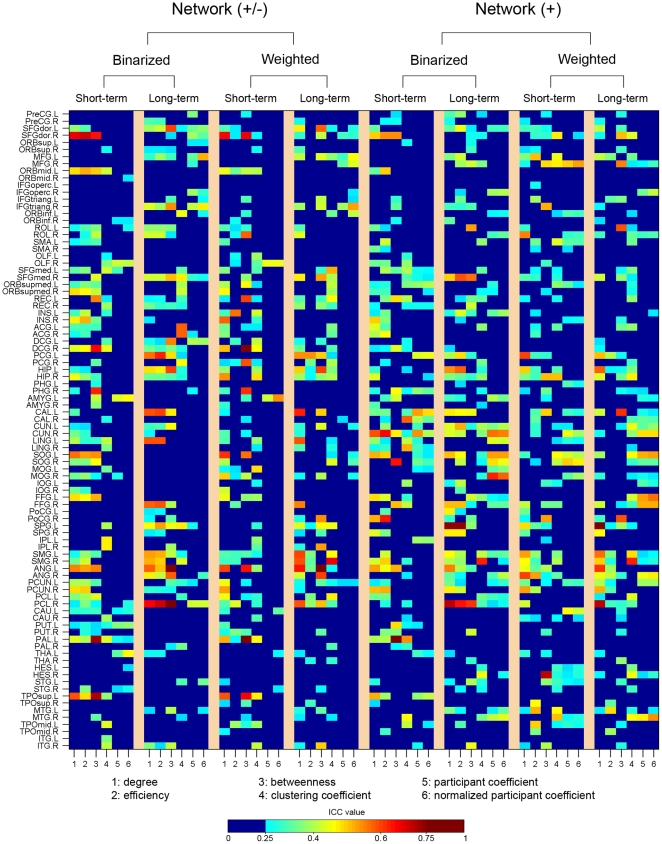
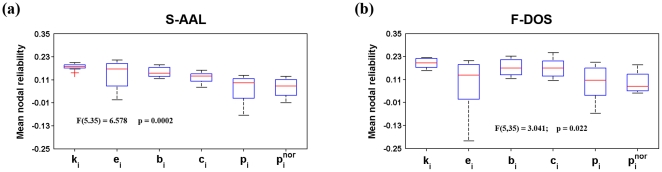
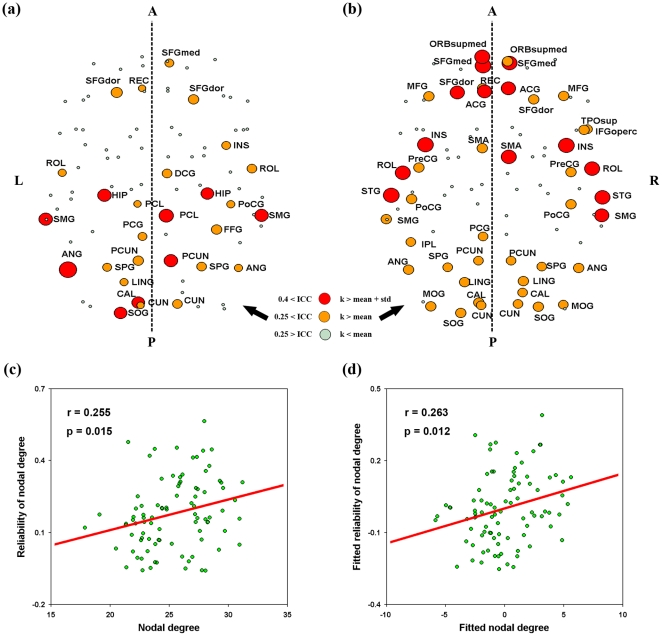
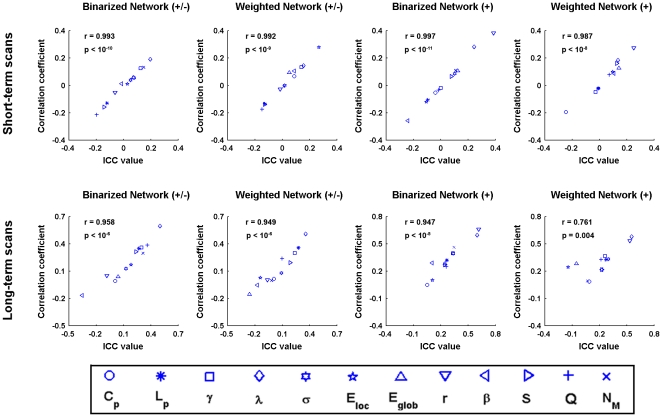
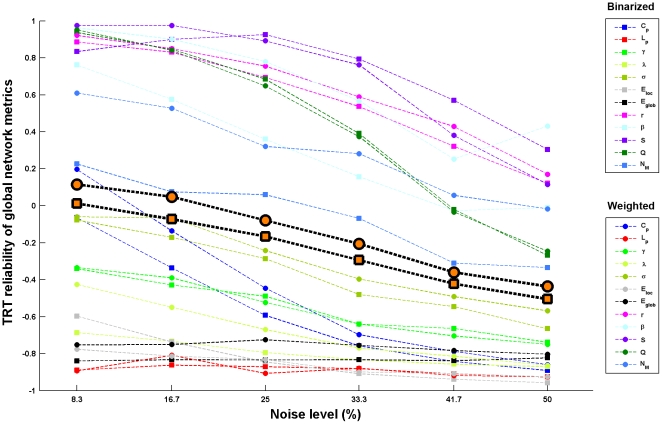
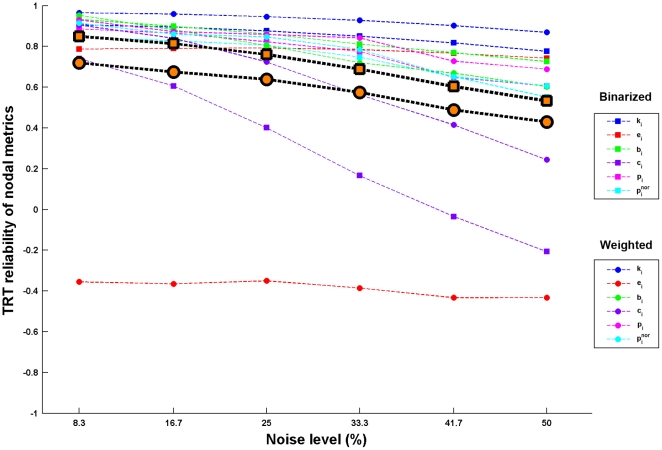
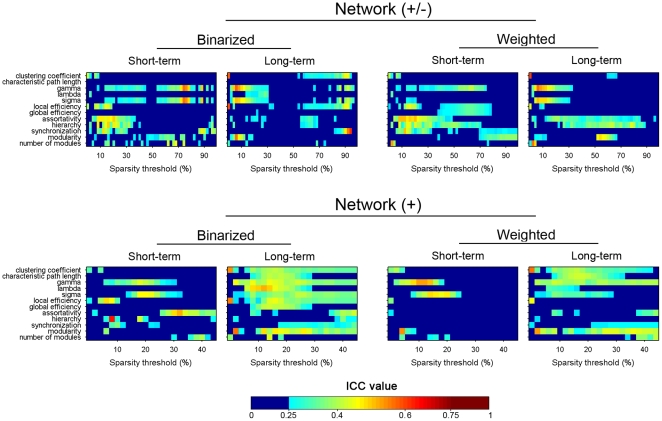
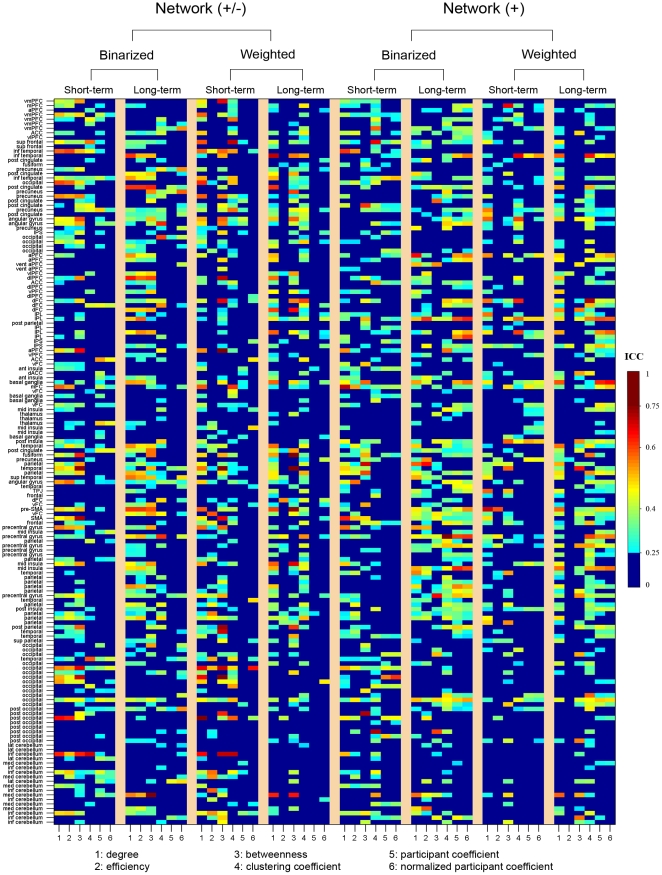
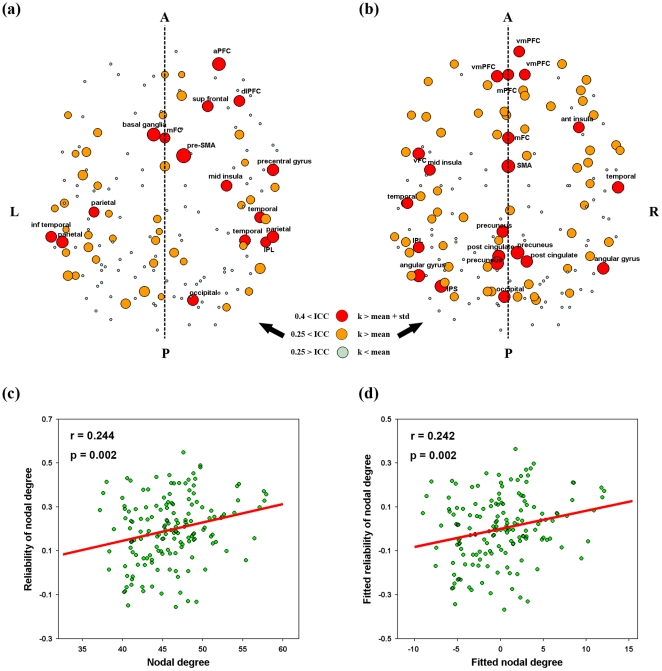
Graph-based computational network analysis has proven a powerful tool to quantitatively characterize functional architectures of the brain. However, the test-retest (TRT) reliability of graph metrics of functional networks has not been systematically examined. Here, we investigated TRT reliability of topological metrics of functional brain networks derived from resting-state functional magnetic resonance imaging data. Specifically, we evaluated both short-term (<1 hour apart) and long-term (>5 months apart) TRT reliability for 12 global and 6 local nodal network metrics. We found that reliability of global network metrics was overall low, threshold-sensitive and dependent on several factors of scanning time interval (TI, long-term>short-term), network membership (NM, networks excluding negative correlations>networks including negative correlations) and network type (NT, binarized networks>weighted networks). The dependence was modulated by another factor of node definition (ND) strategy. The local nodal reliability exhibited large variability across nodal metrics and a spatially heterogeneous distribution. Nodal degree was the most reliable metric and varied the least across the factors above. Hub regions in association and limbic/paralimbic cortices showed moderate TRT reliability. Importantly, nodal reliability was robust to above-mentioned four factors. Simulation analysis revealed that global network metrics were extremely sensitive (but varying degrees) to noise in functional connectivity and weighted networks generated numerically more reliable results in compared with binarized networks. For nodal network metrics, they showed high resistance to noise in functional connectivity and no NT related differences were found in the resistance. These findings provide important implications on how to choose reliable analytical schemes and network metrics of interest.
Overview
The claims and statistics of this paper haven’t been checked yet.
Run the check — free, no account needed. It reads the open-access text and checks the sources it cites.
Integrity signals
Registry
Cites
Statistics
Figures
Verification
Claims the paper makes
The claims and statistics of this paper haven’t been checked yet.
Run the check — free, no account needed. It reads the open-access text and checks the sources it cites.
Claims other papers make about this one
Each is checked against this paper’s own text: does it say what the citing paper says it does?
In the citing paper
“Multiple studies have found evidence for limited test-retest reliability using a multitude of conventional rs-fcMRI network characteristics and analytic approaches (Braun et al., 2012; Wang et al., 2011; Wisner et al., 2013; Zuo et al., 2010; Zuo and Xing, 2014).”
From Development of large-scale functional networks from birth to adulthood: A guide to the neuroimaging literature (2017) · cites this paper as Wang et al., 2011
Self-check
Percentages, sums and reported differences re-computed from the paper’s own numbers.
The self-check needs the paper’s full text.
Citations
Cites
Statistical principles in experimental design.
Winer, B. J. (1962) · McGraw-Hill Book Company · doi:10.1037/11774-000 · Cited by 27,137
Intraclass correlations: Uses in assessing rater reliability.
Shrout, P. E., & Fleiss, J. L. (1979) · Psychological Bulletin · doi:10.1037/0033-2909.86.2.420 · Cited by 24,532
Tzourio-Mazoyer, N., Landeau, B., Papathanassiou, D., Crivello, F., Etard, O., Delcroix, N., Mazoyer, B., & Joliot, M. (2002) · NeuroImage · doi:10.1006/nimg.2001.0978 · Cited by 16,319
Complex brain networks: graph theoretical analysis of structural and functional systems
Bullmore, E., & Sporns, O. (2009) · Nature Reviews Neuroscience · doi:10.1038/nrn2575 · Cited by 11,820
Complex network measures of brain connectivity: Uses and interpretations
Rubinov, M., & Sporns, O. (2010) · NeuroImage · doi:10.1016/j.neuroimage.2009.10.003 · Cited by 11,522
Complex networks: structure and dynamics
BOCCALETTI, S., LATORA, V, MORENO, Y., CHAVEZ, M., & HWANG, D. (2006) · Physics Reports · doi:10.1016/j.physrep.2005.10.009 · Cited by 11,010
Functional connectivity in the motor cortex of resting human brain using echo‐planar mri
Biswal, B., Zerrin Yetkin, F., Haughton, V. M., & Hyde, J. S. (1995) · Magnetic Resonance in Medicine · doi:10.1002/mrm.1910340409 · Cited by 9,812
Self-citationThe human brain is intrinsically organized into dynamic, anticorrelated functional networks
Fox, M. D., Snyder, A. Z., Vincent, J. L., Corbetta, M., Van Essen, D. C., & Raichle, M. E. (2005) · Proceedings of the National Academy of Sciences · doi:10.1073/pnas.0504136102 · Cited by 8,553
Statistical Principles in Experimental Design
Myers, J. L., & Winer, B. J. (1964) · The American Journal of Psychology · doi:10.2307/1419292 · Cited by 8,111
Network motifs: simple building blocks of complex networks.
Milo, R., Shen-Orr, S., Itzkovitz, S., Kashtan, N., Chklovskii, D., & Alon, U. (2002) · Science · doi:10.1126/science.298.5594.824 · Cited by 7,368
Research works printed but not linked: 1
- R Salvador, 2005, Undirected graphs of frequency-dependent functional connectivity in whole brain networks., Phil Trans R Soc B 360, 937–946
Cited by
Sorted by citations
GRETNA: a graph theoretical network analysis toolbox for imaging connectomics
Wang, J., Wang, X., Xia, M., Liao, X., Evans, A. C., & Yong He, A. (2015) · Frontiers in Human Neuroscience · doi:10.3389/fnhum.2015.00386 · Cited by 1,439
Self-citationNetwork Centrality in the Human Functional Connectome
Zuo, X., Ehmke, R. C., Mennes, M., Imperati, D., Castellanos, F. X., Sporns, O., & Milham, M. P. (2011) · Cerebral Cortex · doi:10.1093/cercor/bhr269 · Cited by 1,190
Self-citationQuestions and controversies in the study of time-varying functional connectivity in resting fMRI
Lurie, D. J., Kessler, D., Bassett, D. S., Betzel, R. F., Breakspear, M., Kheilholz, S., Kucyi, A., Liégeois, R., Lindquist, M. A., McIntosh, A. R., et al. (2020) · Network Neuroscience · doi:10.1162/netn_a_00116 · Cited by 648
Noble, S., Scheinost, D., & Constable, R. T. (2019) · NeuroImage · doi:10.1016/j.neuroimage.2019.116157 · Cited by 601
Zuo, X., Xu, T., Jiang, L., Yang, Z., Cao, X., Yong He, A., Zang, Y., Castellanos, F. X., & Milham, M. P. (2012) · NeuroImage · doi:10.1016/j.neuroimage.2012.10.017 · Cited by 510
Self-citationDepression, Neuroimaging and Connectomics: A Selective Overview
Gong, Q., & Yong He, A. (2014) · Biological Psychiatry · doi:10.1016/j.biopsych.2014.08.009 · Cited by 508
Cognitive Network Neuroscience
Medaglia, J. D., Lynall, M.-E., & Bassett, D. S. (2015) · Journal of Cognitive Neuroscience · doi:10.1162/jocn_a_00810 · Cited by 419
Non-Stationarity in the “Resting Brain’s” Modular Architecture
Jones, D. T., Vemuri, P., Murphy, M. C., Gunter, J. L., Senjem, M. L., Machulda, M. M., Przybelski, S. A., Gregg, B. E., Kantarci, K., Knopman, D. S., et al. (2012) · PLoS ONE · doi:10.1371/journal.pone.0039731 · Cited by 435
Disrupted Functional Brain Connectome in Individuals at Risk for Alzheimer's Disease
Wang, J., Zuo, X., Dai, Z., Xia, M., Zhao, Z., Zhao, X., Jia, J., Han, Y., & He, Y. (2013) · Biological Psychiatry · doi:10.1016/j.biopsych.2012.03.026 · Cited by 432
Self-citationAlzheimer's disease: connecting findings from graph theoretical studies of brain networks
Tijms, B. M., Wink, A. M., de Haan, W., van der Flier, W. M., Stam, C. J., Scheltens, P., & Barkhof, F. (2013) · Neurobiology of Aging · doi:10.1016/j.neurobiolaging.2013.02.020 · Cited by 416
Grayson, D. S., & Fair, D. A. (2017) · NeuroImage · doi:10.1016/j.neuroimage.2017.01.079 · Cited by 411
“Multiple studies have found evidence for limited test-retest reliability using a multitude of conventional rs-fcMRI network characteristics and analytic approaches (Braun et al., 2012; Wang et al., 2011; Wisner et al., 2013; Zuo et al., 2010; Zuo and Xing, 2014).”
BackgroundResting-State Functional MR Imaging: A New Window to the Brain
Barkhof, F., Haller, S., & Rombouts, S. A. R. B. (2014) · Radiology · doi:10.1148/radiol.14132388 · Cited by 397
Fox, M., Liu, H., & Pascual‐Leone, Á. (2012) · NeuroImage · doi:10.1016/j.neuroimage.2012.10.082 · Cited by 395
Clinical applications of the functional connectome
Castellanos, F. X., Di Martino, A., Craddock, R. C., Mehta, A. D., & Milham, M. P. (2013) · NeuroImage · doi:10.1016/j.neuroimage.2013.04.083 · Cited by 312
Self-citationIdentifying and Mapping Connectivity Patterns of Brain Network Hubs in Alzheimer's Disease
Dai, Z., Yan, C., Li, K., Wang, Z., Wang, J., Cao, M., Lin, Q., Shu, N., Xia, M., Bi, Y., et al. (2014) · Cerebral Cortex · doi:10.1093/cercor/bhu246 · Cited by 298
Self-citationOne-year test-retest reliability of intrinsic connectivity network fMRI in older adults
Guo, C. C., Kurth, F., Zhou, J., Mayer, E. A., Eickhoff, S. B., Kramer, J. H., & Seeley, W. W. (2012) · NeuroImage · doi:10.1016/j.neuroimage.2012.03.027 · Cited by 252
Functional brain networks and cognitive deficits in Parkinson's disease
Baggio, H. C., Sala‐Llonch, R., Segura, B., Martı́, M. J., Valldeoriola, F., Compta, Y., TOLOSA, E. S., & Junqué, C. (2014) · Human Brain Mapping · doi:10.1002/hbm.22499 · Cited by 257
Hardmeier, M., Hatz, F., Bousleiman, H., Schindler, C., Stam, C. J., & Fuhr, P. (2014) · PLoS ONE · doi:10.1371/journal.pone.0108648 · Cited by 250
Cao, H., Plichta, M. M., Schäfer, A., Haddad, L., Grimm, O., Schneider, M., Esslinger, C., Kirsch, P., Meyer-Lindenberg, A., & Tost, H. (2014) · NeuroImage · doi:10.1016/j.neuroimage.2013.09.013 · Cited by 227
Disrupted structural and functional brain networks in Alzheimer's disease
Dai, Z., Lin, Q., Li, T., Wang, X., Yuan, H., Yu, X., Yong He, A., & Wang, H. (2018) · Neurobiology of Aging · doi:10.1016/j.neurobiolaging.2018.11.005 · Cited by 222
Wang, H., Jin, X., Zhang, Y., & Wang, J. (2016) · Brain and Behavior · doi:10.1002/brb3.448 · Cited by 215
Self-citationAlexander‐Bloch, A. F., Lambiotte, R., Roberts, B., Giedd, J. N., Gogtay, N., & Bullmore, E. T. (2011) · NeuroImage · doi:10.1016/j.neuroimage.2011.11.035 · Cited by 201
Defining nodes in complex brain networks
Stanley, M. L., Moussa, M. N., Paolini, B., Lyday, R. G., Burdette, J. H., & Laurienti, P. J. (2013) · Frontiers in Computational Neuroscience · doi:10.3389/fncom.2013.00169 · Cited by 202
Addressing head motion dependencies for small-world topologies in functional connectomics
Yan, C., Craddock, R. C., Yong He, A., & Milham, M. P. (2013) · Frontiers in Human Neuroscience · doi:10.3389/fnhum.2013.00910 · Cited by 196
Self-citationChen, X., Zhang, H., Zhang, L., Shen, C., Lee, S., & Shen, D. G. (2017) · Human Brain Mapping · doi:10.1002/hbm.23711 · Cited by 190
Liang, X., Wang, J., Yan, C., Shu, N., Xu, K., Gong, G., & Yong He, A. (2012) · PLoS ONE · doi:10.1371/journal.pone.0032766 · Cited by 196
Self-citationLiao, X., Xia, M., Xu, T., Dai, Z., Cao, X., Niu, H., Zuo, X., Zang, Y., & Yong He, A. (2013) · NeuroImage · doi:10.1016/j.neuroimage.2013.07.058 · Cited by 189
Self-citationDíez‐Cirarda, M., Strafella, A. P., Kim, J., Peña, J., Ojeda, N., Cabrera‐Zubizarreta, A., & Ibarretxe‐Bilbao, N. (2017) · NeuroImage Clinical · doi:10.1016/j.nicl.2017.12.013 · Cited by 185
Dai, Z., & He, Y. (2014) · Neuroscience Bulletin · doi:10.1007/s12264-013-1421-0 · Cited by 173
Wu, X., Zou, Q., Hu, J., Tang, W., Mao, Y. Q., Gao, L., Zhu, J., Jin, Y., Wu, X., Lu, L., et al. (2015) · Journal of Neuroscience · doi:10.1523/jneurosci.0415-15.2015 · Cited by 177
Brain Connectivity Analysis: A Short Survey
Lang, E. W., Tomé, A. M., Keck, I. R., Górriz, J. M., & Puntonet, C. G. (2012) · Computational Intelligence and Neuroscience · doi:10.1155/2012/412512 · Cited by 185
Faria, A. V., Joel, S. E., Zhang, Y., Oishi, K., van Zjil, P. C. M., Miller, M. I., Pekar, J. J., & Mori, S. (2012) · NeuroImage · doi:10.1016/j.neuroimage.2012.03.078 · Cited by 169
Multisite reliability of MR-based functional connectivity
Noble, S., Scheinost, D., Finn, E. S., Shen, X., Papademetris, X., McEwen, S. C., Bearden, C. E., Addington, J., Goodyear, B. G., Cadenhead, K. S., et al. (2016) · NeuroImage · doi:10.1016/j.neuroimage.2016.10.020 · Cited by 168
Test–retest reliability of functional connectivity networks during naturalistic fMRI paradigms
Wang, J., Ren, Y., Hu, X., Nguyen, V. T., Guo, L., Han, J., & Guo, C. C. (2017) · Human Brain Mapping · doi:10.1002/hbm.23517 · Cited by 155
Self-citationImaging Functional and Structural Brain Connectomics in Attention-Deficit/Hyperactivity Disorder
Cao, M., Shu, N., Cao, Q., Wang, Y., & Yong He, A. (2014) · Molecular Neurobiology · doi:10.1007/s12035-014-8685-x · Cited by 161
Termenón, M., Jaillard, A. S., Delon‐Martin, C., & Achard, S. (2016) · NeuroImage · doi:10.1016/j.neuroimage.2016.05.062 · Cited by 154
Schröter, M. S., Spoormaker, V. I., Schorer, A., Wohlschläger, A. M., Czisch, M., Kochs, E. F., Zimmer, C., Hemmer, B., Schneider, G. H., Jordan, D., et al. (2012) · Journal of Neuroscience · doi:10.1523/jneurosci.6046-11.2012 · Cited by 148
Altered Network Topologies and Hub Organization in Adults with Autism: A Resting-State fMRI Study
Itahashi, T., Yamada, T., Watanabe, H., Nakamura, M., Jimbo, D., Shioda, S., Toriizuka, K., Kato, N., & Hashimoto, R. (2014) · PLoS ONE · doi:10.1371/journal.pone.0094115 · Cited by 143
Chen, B., Xu, T., Zhou, C., Wang, L., Yang, N., Wang, Z., Dong, H.-M., Yang, Z., Zang, Y., Zuo, X., et al. (2015) · PLoS ONE · doi:10.1371/journal.pone.0144963 · Cited by 136
Self-citationIntraclass correlation: Improved modeling approaches and applications for neuroimaging
Chen, G., Taylor, P. A., Haller, S. P., Kircanski, K., Stoddard, J., Pine, D. S., Leibenluft, E., Brotman, M. A., & Cox, R. W. (2017) · Human Brain Mapping · doi:10.1002/hbm.23909 · Cited by 135
Wang, Y., Wang, J., Jia, Y., Zhong, S., Zhong, M., Sun, Y., Niu, M., Zhao, L., Zhao, L., Pan, J., et al. (2017) · Translational Psychiatry · doi:10.1038/tp.2017.117 · Cited by 133
Self-citationMapping the Alzheimer’s Brain with Connectomics
Xie, T., & Yong He, A. (2012) · Frontiers in Psychiatry · doi:10.3389/fpsyt.2011.00077 · Cited by 129
Mapping Individual Brain Networks Using Statistical Similarity in Regional Morphology from MRI
Kong, X., Liu, Z., Huang, L., Wang, X., Yang, Z., Zhou, G., Zhen, Z., & Liu, J. (2015) · PLoS ONE · doi:10.1371/journal.pone.0141840 · Cited by 121
Test-retest reliability of graph metrics of resting state MRI functional brain networks: A review
Andellini, M., Cannatà, V., Gazzellini, S., Bernardi, B., & Napolitano, A. (2015) · Journal of Neuroscience Methods · doi:10.1016/j.jneumeth.2015.05.020 · Cited by 128
Han, K., Mac Donald, C. L., Johnson, A. M., Barnes, Y., Wierzechowski, L., Zonies, D., Oh, J., Flaherty, S., Fang, R., Raichle, M. E., et al. (2014) · NeuroImage · doi:10.1016/j.neuroimage.2013.08.017 · Cited by 123
Characteristics and variability of structural networks derived from diffusion tensor imaging
Cheng, H., Wang, Y., Sheng, J., Kronenberger, W. G., Mathews, V. P., Hummer, T. A., & Saykin, A. J. (2012) · NeuroImage · doi:10.1016/j.neuroimage.2012.03.036 · Cited by 122
Network topology and functional connectivity disturbances precede the onset of Huntington’s disease
Harrington, D. L., Rubinov, M., Durgerian, S., Mourany, L., Reece, C., Koenig, K. A., Bullmore, E. T., Long, J. D., Paulsen, J. S., for the PREDICT-HD investigators of the Huntington Study Group, et al. (2015) · Brain · doi:10.1093/brain/awv145 · Cited by 122
Test-Retest Reliability of Graph Metrics in Functional Brain Networks: A Resting-State fNIRS Study
Niu, H., Li, Z., Liao, X., Wang, J., Zhao, T., Shu, N., Zhao, X., & Yong He, A. (2013) · PLoS ONE · doi:10.1371/journal.pone.0072425 · Cited by 120
Self-citationP4‐158: Nonstationarity in the ‘resting brain's’ modular architecture
Jones, D. T., Vemuri, P., Murphy, M. C., Gunter, J. L., Senjem, M. L., Machulda, M. M., Przybelski, S. A., Gregg, B. E., Kantarci, K., Knopman, D. S., et al. (2012) · Alzheimer s & Dementia · doi:10.1016/j.jalz.2012.05.1862 · Cited by 116
Suo, X., Lei, D., Li, L., Li, W., Dai, J., Wang, S., He, M., Zhu, H., Kemp, G. J., & Gong, Q. (2018) · Journal of Psychiatry and Neuroscience · doi:10.1503/jpn.170214 · Cited by 111
Yi, L., Wang, J., Jia, L., Zhao, Z., Lu, J., Li, K., Jia, J., Yong He, A., Jiang, C., & Han, Y. (2012) · PLoS ONE · doi:10.1371/journal.pone.0044758 · Cited by 113
Self-citationLi, Y., Wang, N., Wang, H., Lv, Y., Zou, Q., & Wang, J. (2021) · NeuroImage · doi:10.1016/j.neuroimage.2021.118018 · Cited by 104
Self-citationSanabria-Díaz, G., Martínez‐Montes, E., Melie‐García, L., & Initiative, T. A. D. N. (2013) · PLoS ONE · doi:10.1371/journal.pone.0068860 · Cited by 104
Xia, M., & Yong He, A. (2011) · Brain Connectivity · doi:10.1089/brain.2011.0062 · Cited by 107
Wang, J., Qiu, S., Xu, Y., Liu, Z., Wen, X., Hu, X., Zhang, R., Li, M., Wang, W., & Huang, R. (2014) · Clinical Neurophysiology · doi:10.1016/j.clinph.2013.12.120 · Cited by 103
Self-citationFranzmeier, N., Caballero, M. Á. A., Taylor, A. N. W., Simon-Vermot, L., Buerger, K., Ertl-Wagner, B., Mueller, C., Catak, C., Janowitz, D., Baykara, E., et al. (2016) · Brain Imaging and Behavior · doi:10.1007/s11682-016-9599-1 · Cited by 103
The Functional Connectome of Speech Control
Fuertinger, S., Horwitz, B., & Simonyan, K. (2015) · PLoS Biology · doi:10.1371/journal.pbio.1002209 · Cited by 102
Combining network topology and information theory to construct representative brain networks
Luppi, A. I., & Stamatakis, E. A. (2020) · Network Neuroscience · doi:10.1162/netn_a_00170 · Cited by 97
Geng, S., Liu, X., Biswal, B. B., & Niu, H. (2017) · Frontiers in Neuroscience · doi:10.3389/fnins.2017.00392 · Cited by 95
Self-citationReproducibility of Graph-Theoretic Brain Network Metrics: A Systematic Review
Welton, T., Kent, D. A., Auer, D. P., & Dineen, R. A. (2014) · Brain Connectivity · doi:10.1089/brain.2014.0313 · Cited by 96
Birn, R. M., Cornejo, M. D., Molloy, E. K., Patriat, R., Meier, T. B., Kirk, G. R., Nair, V. A., Meyerand, M. E., & Prabhakaran, V. (2014) · Brain Connectivity · doi:10.1089/brain.2014.0284 · Cited by 91
Evoked effective connectivity of the human neocortex
Entz, L., Tóth, E., Keller, C. J., Bickel, S., Groppe, D. M., Fabó, D., Kozák, L. R., Erőss, L., Ulbert, I., & Mehta, A. D. (2014) · Human Brain Mapping · doi:10.1002/hbm.22581 · Cited by 87
Functional neuroimaging in psychiatry and the case for failing better
Nour, M. M., Liu, Y., & Dolan, R. J. (2022) · Neuron · doi:10.1016/j.neuron.2022.07.005 · Cited by 92
Reineberg, A. E., & Banich, M. T. (2016) · Human Brain Mapping · doi:10.1002/hbm.23219 · Cited by 88
Shou, H., Eloyan, A., Lee, S., Zipunnikov, V. M., Crainiceanu, A., Nebel, M. B., Caffo, B. S., Lindquist, M. A., & Crainiceanu, C. M. (2013) · Cognitive Affective & Behavioral Neuroscience · doi:10.3758/s13415-013-0196-0 · Cited by 86
Functional connectomics from a “big data” perspective
Xia, M., & Yong He, A. (2017) · NeuroImage · doi:10.1016/j.neuroimage.2017.02.031 · Cited by 85
Zhao, N., Yuan, L., Jia, X., Xu-feng, Z., Deng, X., He, H., Zhong, J., Wang, J., & Zang, Y. (2018) · Frontiers in Neuroinformatics · doi:10.3389/fninf.2018.00054 · Cited by 87
Self-citationApolipoprotein E ε4 modulates functional brain connectome in A lzheimer's disease
Wang, J., Wang, X., He, Y., Yu, X., Wang, H., & He, Y. (2015) · Human Brain Mapping · doi:10.1002/hbm.22740 · Cited by 87
Self-citationDivergent brain functional network alterations in dementia with Lewy bodies and Alzheimer's disease
Peraza, L. R., Taylor, J., & Kaiser, M. (2015) · Neurobiology of Aging · doi:10.1016/j.neurobiolaging.2015.05.015 · Cited by 82
Dall’Acqua, P., Johannes, S., Mica, L., Simmen, H., Glaab, R., Fandino, J., Schwendinger, M., Meier, C., Ulbrich, E. J., Müller, A. F., et al. (2017) · Frontiers in Human Neuroscience · doi:10.3389/fnhum.2017.00280 · Cited by 91
Consciousness & Brain Functional Complexity in Propofol Anaesthesia
Varley, T. F., Luppi, A. I., Pappas, I., Naçi, L., Adapa, R., Owen, A. M., Menon, D. K., & Stamatakis, E. A. (2020) · Scientific Reports · doi:10.1038/s41598-020-57695-3 · Cited by 81
Shen, Y., Yao, J., Jiang, X., Zhang, L., Xu, L., Feng, R., Cai, L., Liu, J., Wang, J., & Chen, W. (2015) · Human Brain Mapping · doi:10.1002/hbm.22817 · Cited by 84
Self-citationTest-retest reliability of dynamic functional connectivity in resting state fMRI
Zhang, C., Baum, S. A., Adduru, V. R., Biswal, B. B., & Michael, A. M. (2018) · NeuroImage · doi:10.1016/j.neuroimage.2018.08.021 · Cited by 84
Self-citationHuman hippocampal CA3 damage disrupts both recent and remote episodic memories
Miller, T. D., Chong, T. T. ‐., Davies, A. M. A., Johnson, M. R., Irani, S. R., Husain, M., Ng, T. W. C., Jacob, S., Maddison, P., Kennard, C., et al. (2020) · eLife · doi:10.7554/elife.41836 · Cited by 85
Supervised machine learning for diagnostic classification from large-scale neuroimaging datasets
Lanka, P., Rangaprakash, D., Dretsch, M. N., Katz, J. S., Denney, T. S., & Deshpande, G. (2019) · Brain Imaging and Behavior · doi:10.1007/s11682-019-00191-8 · Cited by 80
Systematic evaluation of fMRI data-processing pipelines for consistent functional connectomics
Luppi, A. I., Gellersen, H. M., Liu, Z.-Q., Peattie, A. R. D., Manktelow, A. E., Adapa, R., Owen, A. M., Naçi, L., Menon, D. K., Dimitriadis, S. I., et al. (2024) · Nature Communications · doi:10.1038/s41467-024-48781-5 · Cited by 86
Chong-yaw Wee, A., Yap, P., & Shen, D. G. (2016) · CNS Neuroscience & Therapeutics · doi:10.1111/cns.12499 · Cited by 81
Wang, Y., Wang, J., Jia, Y., Zhong, S., Niu, M., Sun, Y., Qi, Z., Zhao, L., Huang, L., & Huang, R. (2017) · Scientific Reports · doi:10.1038/s41598-017-03777-8 · Cited by 81
Self-citationHoliga, Š., Sambataro, F., Luzy, C. P., Greig, G., Sarkar, N., Renken, R. J., Marsman, J.-B. C., Schobel, S., Bertolino, A., & Dukart, J. (2018) · PLoS ONE · doi:10.1371/journal.pone.0206583 · Cited by 81
Li, L., Zeng, L., Lin, Z.-J., Cazzell, M., & Liu, H. (2015) · Journal of Biomedical Optics · doi:10.1117/1.jbo.20.5.050801 · Cited by 78
Li, S., Ma, X., Huang, R., Li, M., Tian, J., Wen, H., Lin, C., Wang, T., Zhan, W., Jin, F., et al. (2015) · Clinical Neurophysiology · doi:10.1016/j.clinph.2015.06.022 · Cited by 74
Shu, N., Duan, Y., Xia, M., Schoonheim, M. M., Huang, J., Ren, Z., Sun, Z., Ye, J., Dong, H., Shi, F., et al. (2016) · Scientific Reports · doi:10.1038/srep29383 · Cited by 80
Fiecas, M. J. A., Ombao, H., van Lunen, D., Baumgartner, R., Coimbra, A., & Feng, D. (2012) · NeuroImage · doi:10.1016/j.neuroimage.2012.09.052 · Cited by 76
Resting state magnetoencephalography functional connectivity in traumatic brain injury
Tarapore, P. E., Findlay, A. M., LaHue, S. C., Lee, H., Honma, S. M., Mizuiri, D., Luks, T. L., Manley, G. T., Nagarajan, S. S., & Mukherjee, P. (2013) · Journal of neurosurgery · doi:10.3171/2013.3.jns12398 · Cited by 74
Lee, Y.-B., Park, B., James, O., Kim, S., & Park, H. (2017) · Frontiers in Human Neuroscience · doi:10.3389/fnhum.2017.00418 · Cited by 74
Iordan, A. D., Cooke, K. A., Moored, K., Katz, B., Buschkuehl, M., Jaeggi, S. M., Jonides, J., Peltier, S., Polk, T. A., & Reuter‐Lorenz, P. A. (2018) · Frontiers in Aging Neuroscience · doi:10.3389/fnagi.2017.00419 · Cited by 85
Schulz, M., Malherbe, C., Cheng, B., Thomalla, G., & Schlemm, E. (2021) · BMC Medicine · doi:10.1186/s12916-021-01962-1 · Cited by 71
Spontaneous functional network dynamics and associated structural substrates in the human brain
Liao, X., Yuan, L., Zhao, T., Dai, Z., Shu, N., Xia, M., Yang, Y., Evans, A. C., & Yong He, A. (2015) · Frontiers in Human Neuroscience · doi:10.3389/fnhum.2015.00478 · Cited by 68
Disrupted brain network topology in chronic insomnia disorder: A resting-state fMRI study
Li, Z., Chen, R., Guan, M., Wang, E., Qian, T., Zhao, C., Zou, Z., Beck, T., Shi, D., Wang, M., et al. (2018) · NeuroImage Clinical · doi:10.1016/j.nicl.2018.01.012 · Cited by 69
Exploring brain functional plasticity in world class gymnasts: a network analysis
Wang, J., Lü, M., Fan, Y., Wen, X., Zhang, R., Wang, B., Ma, Q., Zheng, S. M., Yong He, A., Wang, J., et al. (2015) · Brain Structure and Function · doi:10.1007/s00429-015-1116-6 · Cited by 69
Self-citationNodal centrality of functional network in the differentiation of schizophrenia
Cheng, H., Newman, S. D., Goñi, J., Kent, J. S., Howell, J. M., Bolbecker, A. R., Puce, A., O’Donnell, B. F., & Hetrick, W. P. (2015) · Schizophrenia Research · doi:10.1016/j.schres.2015.08.011 · Cited by 69
Su, Q., Yao, D., Jiang, M., Liu, F., Jiang, J., Xu, C., Dai, Y., Yu, M., Long, L., Li, H., et al. (2014) · Australian & New Zealand Journal of Psychiatry · doi:10.1177/0004867414553949 · Cited by 67
Enhanced Network Efficiency of Functional Brain Networks in Primary Insomnia Patients
Ma, X., Jiang, G., Fu, S., Jin, F., Wu, Y., Liu, M., Xu, G., & Wang, T. (2018) · Frontiers in Psychiatry · doi:10.3389/fpsyt.2018.00046 · Cited by 70
A longitudinal study of structural brain network changes with normal aging
Wu, K., Taki, Y., Sato, K., Qi, H., Kawashima, R., & Fukuda, H. (2013) · Frontiers in Human Neuroscience · doi:10.3389/fnhum.2013.00113 · Cited by 69
Temporal Reliability and Lateralization of the Resting-State Language Network
Zhu, L., Yang, F., Zou, Q., Wang, J., Gao, J., & Niu, Z. (2014) · PLoS ONE · doi:10.1371/journal.pone.0085880 · Cited by 72
Self-citationTest-Retest Reliability of “High-Order” Functional Connectivity in Young Healthy Adults
Zhang, H., Chen, X., Zhang, Y., & Shen, D. G. (2017) · Frontiers in Neuroscience · doi:10.3389/fnins.2017.00439 · Cited by 67
A neuromarker of individual general fluid intelligence from the white-matter functional connectome
Li, J., Biswal, B. B., Meng, Y., Yang, S., Duan, X., Cui, Q., Chen, H., & Liao, W. (2020) · Translational Psychiatry · doi:10.1038/s41398-020-0829-3 · Cited by 68
Self-citationWisner, K. M., Atluri, G., Lim, K. O., & MacDonald, A. W. (2013) · NeuroImage · doi:10.1016/j.neuroimage.2013.02.066 · Cited by 66
Zhang, D., Liu, X., Chen, J., Liu, B., & Wang, J. (2015) · Frontiers in Aging Neuroscience · doi:10.3389/fnagi.2015.00006 · Cited by 68
Self-citationHomotopic connectivity in drug‐naïve, first‐episode, early‐onset schizophrenia
Li, H., Xu, Y. J., Zhang, K.-R., Hoptman, M. J., & Zuo, X. (2014) · Journal of Child Psychology and Psychiatry · doi:10.1111/jcpp.12307 · Cited by 65
Self-citation
Metadata
- Authors
- Wang, J.-H., Zuo, X.-N., Gohel, S., Milham, M. P., Biswal, B. B., & He, Y.
- Affiliations
- Chinese Academy of Sciences (CN)
- University of Medicine and Dentistry of New Jersey (US)
- NYU Langone Health (US)
- Venue
- PLoS ONE
- Publisher
- Public Library of Science (PLoS)
- Published
- 2011-07-19
- Volume
- 6
- Issue
- 7
- Pages
- e21976
- ISSN
- 1932-6203 (ISSN-L)
- PMC
- PMC3139595
- OpenAlex
- W2020617938
- Cited by
- 416
- References
- 74
- Citations by year
- 2026: 21 · 2025: 24 · 2024: 29 · 2023: 35 · 2022: 30 · 2021: 33 · 2020: 27 · 2019: 19 · 2018: 27 · 2017: 36 · 2016: 19 · 2015: 40 · 2014: 27 · 2013: 25 · 2012: 19
- FWCI
- 12.50
- Type
- journal article
- Language
- en
- Open access
- gold
- doi.org
- Locations
- PLoS ONE (publishedVersion, cc-by)
- Europe PMC (PubMed Central) (publishedVersion, cc-by)
- PubMed Central (publishedVersion, cc-by)
- PubMed (publishedVersion)
- Institutional Repository of Institute of Psychology, Chinese Academy of Sciences (Institute of Psychology, Chinese Academy of Sciences) (submittedVersion, cc-by)
- RePEc: Research Papers in Economics (submittedVersion)
- DOAJ (DOAJ: Directory of Open Access Journals) (submittedVersion, cc-by-sa)
- Figshare (submittedVersion, cc-by)
- Institutional Repository of Institute of Psychology, Chinese Academy of Sciences (Institute of Psychology, Chinese Academy of Sciences) (submittedVersion, cc-by-nc-sa)
- Funders
- National Natural Science Foundation of China (30870667, 81030028)
- Topics
- Life Sciences › Neuroscience › Cognitive Neuroscience › Functional Brain Connectivity Studies
- Physical Sciences › Physics and Astronomy › Statistical and Nonlinear Physics › Complex Network Analysis Techniques
- Health Sciences › Medicine › Radiology, Nuclear Medicine and Imaging › Advanced Neuroimaging Techniques and Applications
- Keywords
- test-retest reliability, functional brain networks, resting-state functional connectivity, graph theory, hub regions, association cortex, noise sensitivity, network topology
- MeSH terms
- Adult, Brain, Computer Simulation, Female, Humans, Magnetic Resonance Imaging, Male, Models, Neurological, Nerve Net, Rest, Statistics as Topic, Time Factors, Reproducibility of Results
About these checks
Registry, retraction, Cites and statistics results are computed, not judged, with one exception: a printed reference that no index lists is read once by a model before it counts as a citation error. Claims are extracted by a model and kept only when their quote appears verbatim in the text; each cited source is then checked, with a model’s help, for whether it says what the claim relies on. Those verdicts can be wrong — read the claim’s quote and the cited source before relying on one.
Statistics and arithmetic are recomputed, not judged.
Confidence bands are shown only for fields calibrated on our annotated test set. None is calibrated yet, so no band is shown.
What counts as a claim ›How we measure confidence ›How we check this ›
Are you an author, or do you see a problem with this page? Request a review
