

The DOI matches its Crossref record; 42 of the 42 references it cites were found in a registry or an index.
Mechanisms of the Anti-Obesity Effects of Oxytocin in Diet-Induced Obese Rats
Open accessAbstract
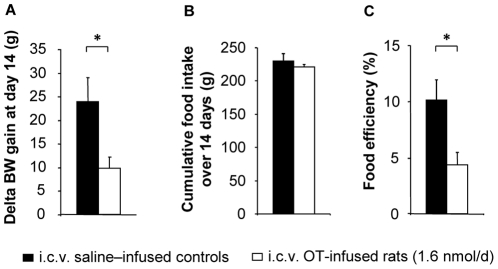
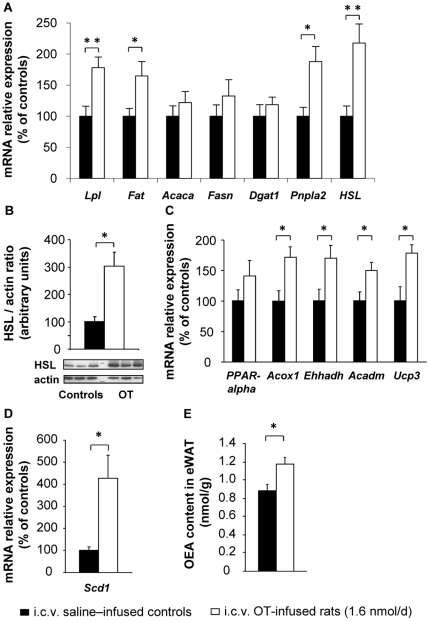
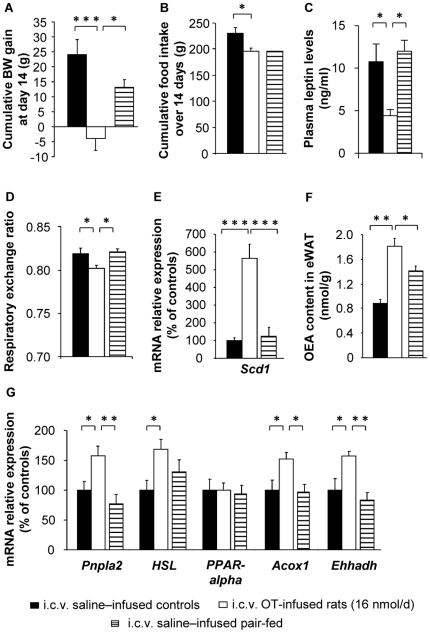
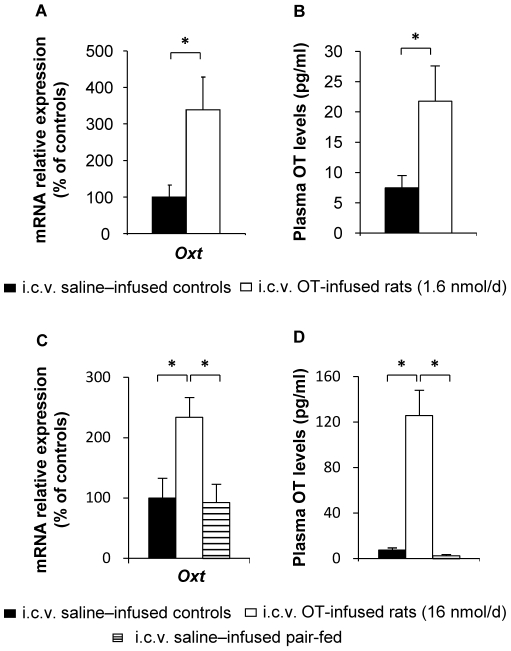
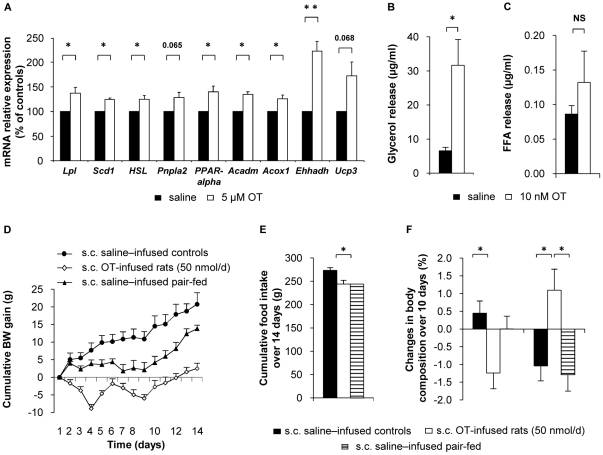
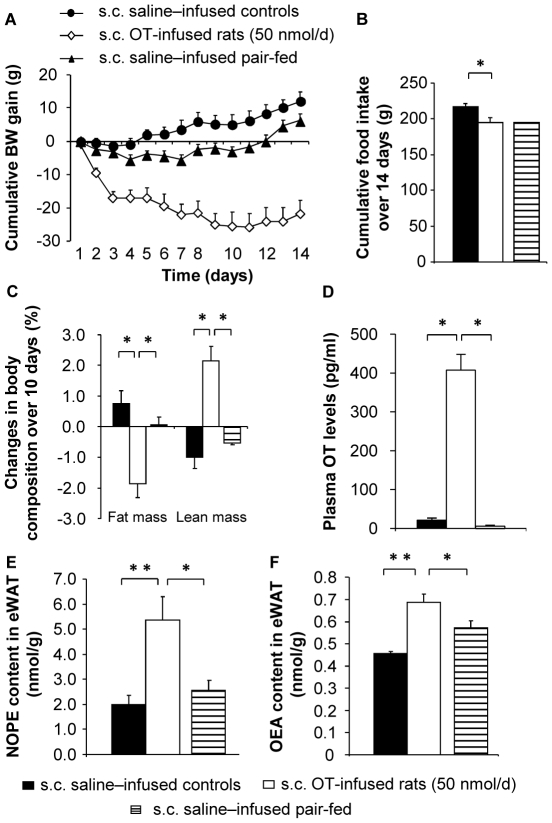
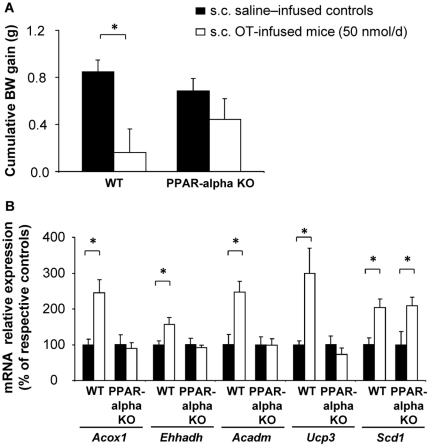
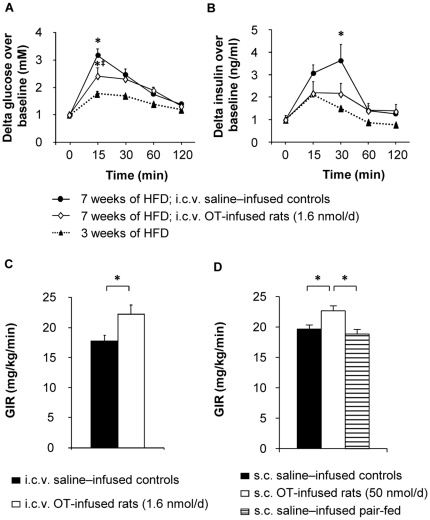
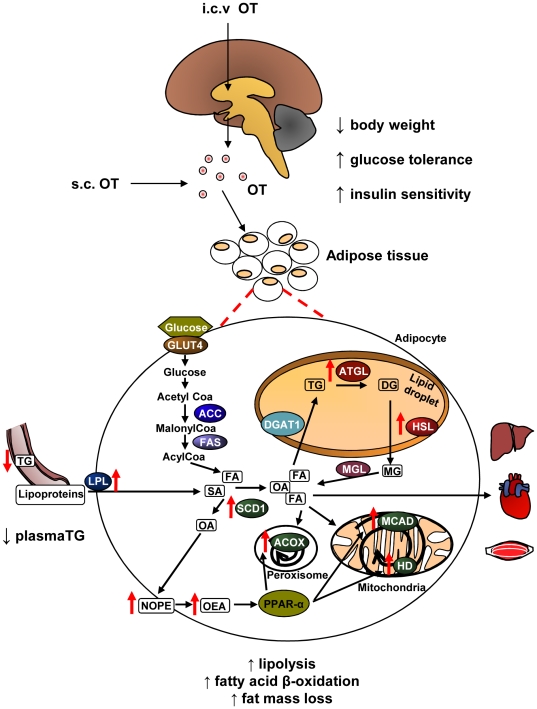
Apart from its role during labor and lactation, oxytocin is involved in several other functions. Interestingly, oxytocin- and oxytocin receptor-deficient mice develop late-onset obesity with normal food intake, suggesting that the hormone might exert a series of beneficial metabolic effects. This was recently confirmed by data showing that central oxytocin infusion causes weight loss in diet-induced obese mice. The aim of the present study was to unravel the mechanisms underlying such beneficial effects of oxytocin. Chronic central oxytocin infusion was carried out in high fat diet-induced obese rats. Its impact on body weight, lipid metabolism and insulin sensitivity was determined. We observed a dose-dependent decrease in body weight gain, increased adipose tissue lipolysis and fatty acid β-oxidation, as well as reduced glucose intolerance and insulin resistance. The additional observation that plasma oxytocin levels increased upon central infusion suggested that the hormone might affect adipose tissue metabolism by direct action. This was demonstrated using in vitro, ex vivo, as well as in vivo experiments. With regard to its mechanism of action in adipose tissue, oxytocin increased the expression of stearoyl-coenzyme A desaturase 1, as well as the tissue content of the phospholipid precursor, N-oleoyl-phosphatidylethanolamine, the biosynthetic precursor of the oleic acid-derived PPAR-alpha activator, oleoylethanolamide. Because PPAR-alpha regulates fatty acid β-oxidation, we hypothesized that this transcription factor might mediate the oxytocin effects. This was substantiated by the observation that, in contrast to its effects in wild-type mice, oxytocin infusion failed to induce weight loss and fat oxidation in PPAR-alpha-deficient animals. Altogether, these results suggest that oxytocin administration could represent a promising therapeutic approach for the treatment of human obesity and type 2 diabetes.
Overview
The claims and statistics of this paper haven’t been checked yet.
Run the check — free, no account needed. It reads the open-access text and checks the sources it cites.
Integrity signals
Registry
Cites
Statistics
Figures
Verification
Claims the paper makes
The claims and statistics of this paper haven’t been checked yet.
Run the check — free, no account needed. It reads the open-access text and checks the sources it cites.
Claims other papers make about this one
Each is checked against this paper’s own text: does it say what the citing paper says it does?
In the citing paper
“These studies suggest that oxytocin promotes energy expenditure.”
From Oxytocin reduces caloric intake in men (2015) · cites this paper as [7]
In the citing paper
“Oxytocin induces weight loss in rodents, and this effect may be related to increased energy expenditure and lipolyis in addition to appetite suppression(6, 7, 8, 9, 10, 11).”
From Oxytocin reduces caloric intake in men (2015) · cites this paper as [7]
In the citing paper
“In vitro and in vivo experiments have demonstrated that oxytocin inhibits adipogenesis and promotes lipolytic pathways and fatty acid oxidation(7, 37).”
From Oxytocin reduces caloric intake in men (2015) · cites this paper as [7]
In the citing paper
“In an investigation of rats receiving a high fat diet, central oxytocin attenuated weight gain without changing food intake(7).”
From Oxytocin reduces caloric intake in men (2015) · cites this paper as [7]
In the citing paper
“Although this conclusion is in need of corroboration in experiments focusing on glucose homeostasis, it is in line with findings that oxytocin enhances insulin sensitivity and glucose tolerance in a rodent model of diet-induced obesity independent of its effects on body weight (7,50).”
From Oxytocin Reduces Reward-Driven Food Intake in Humans (2013) · cites this paper as [50]
In the citing paper
“similar anti-obesity effects of OXT were reported to occur in rat models [16], [17].”
From Treatment of obesity and diabetes using oxytocin or analogs in patients and mouse models (2013) · cites this paper as [17]
Self-check
Percentages, sums and reported differences re-computed from the paper’s own numbers.
The self-check needs the paper’s full text.
Citations
Cites
The oxytocin receptor system: structure, function, and regulation
Gimpl, G., & Fahrenholz, F. (2001) · Physiological Reviews · doi:10.1152/physrev.2001.81.2.629 · Cited by 3,089
The endogenous cannabinoid system controls extinction of aversive memories
Marsicano, G., Wotjak, C. T., Azad, S. C., Bisogno, T., Rammes, G., Cascio, M. G., Hermann, H., Tang, J., Hofmann, C., Zieglgänsberger, W., et al. (2002) · Nature · doi:10.1038/nature00839 · Cited by 1,728
Lee, S. S. T., Pineau, T., Drago, J., Lee, E. J., Owens, J. W., Kroetz, D. L., Fernández‐Salguero, P. M., Westphal, H., & Gonzalez, F. J. (1995) · Molecular and Cellular Biology · doi:10.1128/mcb.15.6.3012 · Cited by 1,652
Fu, J., Gaetani, S., Oveisi, F., Verme, J., Serrano, A., de Fonseca, F. D., Rosengarth, A., Luecke, H., Giacomo, B. D., Tarzia, G., et al. (2003) · Nature · doi:10.1038/nature01921 · Cited by 1,113
Oxytocin Receptors and Human Parturition: A Dual Role for Oxytocin in the Initiation of Labor
Fuchs, A., Fuchs, F., Husslein, P. W., Soloff, M. S., & Fernström, M. J. (1982) · Science · doi:10.1126/science.6278592 · Cited by 494
Swaab, D. F., Purba, J. S., & Hofman, M. A. (1995) · The Journal of Clinical Endocrinology & Metabolism · doi:10.1210/jcem.80.2.7852523 · Cited by 421
The expectant brain: adapting for motherhood
Brunton, P. J., & Russell, J. A. (2008) · Nature Reviews Neuroscience · doi:10.1038/nrn2280 · Cited by 407
Guzmán, M., Lo Verme, J., Fu, J., Oveisi, F., Blázquez, C., & Piomelli, D. (2004) · Journal of Biological Chemistry · doi:10.1074/jbc.m404087200 · Cited by 328
Influence of oxytocin on feeding behavior in the rat
Arletti, R., Benelli, A., & Bertolini, A. (1989) · Peptides · doi:10.1016/0196-9781(89)90082-x · Cited by 328
Role of stearoyl-coenzyme A desaturase in lipid metabolism
Miyazaki, M., & Ntambi, J. M. (2003) · Prostaglandins Leukotrienes and Essential Fatty Acids · doi:10.1016/s0952-3278(02)00261-2 · Cited by 296
Cited by
Sorted by citations
Items 201–254 of 254
Worth, A. A., Feetham, C. H., Morrissey, N. A., & Luckman, S. M. (2024) · Frontiers in Endocrinology · doi:10.3389/fendo.2024.1449326 · Cited by 4
Slattery, J. D., Rambousek, J. R., Tsui, E. W., Honeycutt, M. K., Goldberg, M., Graham, J. L., Wietecha, T., Wolden‐Hanson, T., Williams, A. L., O’Brien, K. D., et al. (2025) · Frontiers in Endocrinology · doi:10.3389/fendo.2025.1503096 · Cited by 5
Li, S., Kim, Y., Chen, J. D. Z., & Madhoun, M. F. (2021) · Obesity Surgery · doi:10.1007/s11695-020-05177-w · Cited by 4
Pharmacological Approaches in Obesity Treatment
Erden, E. E., YAZICI, Z. G., KILIÇ, C., Aydın, S., & Kılıç, F. S. (2022) · OSMANGAZİ JOURNAL OF MEDICINE · doi:10.20515/otd.1093390 · Cited by 4
Oxytocin; Effects on Milk Production
Ahmad, M. M. (2020) · Pure and Applied Biology · doi:10.19045/bspab.2021.100034 · Cited by 4
Ren, H.-C., Ji, L.-X., Chen, T., Liu, Y.-G., Liu, R., Wei, D., Jia, X., & Ji, G. (2022) · ACS Omega · doi:10.1021/acsomega.1c06600 · Cited by 3
Behavioral plasticity: Role of neuropeptides in shaping feeding responses
Levine, A. S., Jewett, D. C., Kotz, C. M., & Olszewski, P. K. (2022) · Appetite · doi:10.1016/j.appet.2022.106031 · Cited by 5
Age and sex influence the response in lipid metabolism of dehydrated Wistar rats
Cognuck, S. Q., Reis, W. L., Silva, M. S., Zorro, S. V., Almeida‐Pereira, G., Debarba, L. K., Elias, L. L. K., & Antunes‐Rodrigues, J. (2022) · Scientific Reports · doi:10.1038/s41598-022-11587-w · Cited by 3
Imaizumi, J., Kamada, S., Taniguchi, M., Sugimoto, T., Maeda, T., Arakaki, R., Yamamoto, S., Shirakawa, A., Mineda, A., Yoshida, A., et al. (2023) · Nutrients · doi:10.3390/nu15122768 · Cited by 3
Arata, M., Tamura, K., Aoki, H., Noguchi, H., Takeda, A., Minato, S., Yamamoto, S., Kinouchi, R., Yoshida, K., Yamamoto, Y., et al. (2024) · Nutrients · doi:10.3390/nu16152533 · Cited by 3
Thakur, P., Shrivastava, R., & Shrivastava, V. K. (2021) · Metabolism Open · doi:10.1016/j.metop.2021.100146 · Cited by 2
Gomaa, R., Ibrahim, M., Alghannam, M., & Elsayed, N. (2017) · Al-Azhar Assiut Medical Journal · doi:10.4103/azmj.azmj_33_17 · Cited by 2
Editorial: Oxytocin: Control of Bone and Fat Mass and Metabolism
Amri, E. (2016) · Frontiers in Endocrinology · doi:10.3389/fendo.2016.00027 · Cited by 2
Wong, B. C., Chau, C. K., Ao, F., Mo, C., Wong, S., Wong, Y. H., & So, H. (2017) · bioRxiv (Cold Spring Harbor Laboratory) · doi:10.1101/140590 · Cited by 2
Constanthin, P. E., Isidor, N., de Seigneux, S., & Momjian, S. (2024) · Endocrine · doi:10.1007/s12020-024-04131-5 · Cited by 1
Mendez, A. J., Szeto, A., Boulina, M. E., Westwright, J. S., Rahman, H., Abushamma, S., Schneider, R., & McCabe, P. M. (2024) · Frontiers in Endocrinology · doi:10.3389/fendo.2024.1465818 · Cited by 1
Mekki, L. B., Elhassan, Y. H., Badi, R. M., Shazali, A. F., Mojaddidi, M. A., Ibrahim, S., Abdalla, H. A., Elsawaf, Z. M., Mohammedali, A. A., & Saeed, A. M. (2025) · Cureus · doi:10.7759/cureus.81451 · Cited by 1
Yamamoto, S., Arakaki, R., Arata, M., Tamura, K., Aoki, H., Noguchi, H., Takeda, A., Uchishiba, M., Minato, S., Inui, H., et al. (2025) · The Journal of Medical Investigation · doi:10.2152/jmi.72.316 · Cited by 1
Modulation of Fatty Acid Oxidation and Glucose Uptake by Oxytocin in Adipocytes
Lin, H., Chen, Y.-S., Chen, Y.-J., Lin, Y., Mersmann, H. J., & Ding, S. (2017) · Journal of Biomedical Science and Engineering · doi:10.4236/jbise.2017.102005 · Cited by 1
Oxytocin as a Metabolic Modulator
Bhatt, N. (2021) · IntechOpen eBooks · doi:10.5772/intechopen.97630 · Cited by 1
Intranasal oxytocin as a treatment for obesity: safety and efficacy
Balestrino, R., Losa, M., Albano, L., Barzaghi, L. R., & Mortini, P. (2023) · Expert Review of Endocrinology & Metabolism · doi:10.1080/17446651.2023.2216794 · Cited by 2
Is oxytocin an undeservedly forgotten hormone in men?
Tyuzikov, I. A., Grekov, E. A., & Smirnov, A. V. (2023) · Andrology and Genital Surgery · doi:10.17650/2070-9781-2023-24-2-66-76 · Cited by 1
Oxytocin: Potential New Treatment for Binge Eating
Kim, Y., Hong, S. M., & Moon, J. (2020) · Springer eBooks · doi:10.1007/978-3-030-43562-2_17 · Cited by 1
Levels of leptin, irisin, oxytocin and insulin in obese and normal weight Iraqi young men
Hammoud, A. S., & Salman, M. I. (2023) · Biomedicine · doi:10.51248/.v43i4.3106 · Cited by 1
Gibson, C. L. (2016) · ERA: Education and Research Archive (University of Alberta) · doi:10.7939/r3pv6bf98 · Cited by 1
Lenglos, C., Calvez, J., & Timofeeva, E. (2014) · Receptors & Clinical Investigation · doi:10.14800/rci.222
Imunolocalização dos receptores de ocitocina no testículo e epidídimo de cães
Minazaki, C. K. (2013) · Digital Library of Theses and Dissertations (Universidade de São Paulo) · doi:10.11606/t.10.2013.tde-27032014-083119
Birech, Z., Mwangi, P. W., Sehmi, P. K., & Nyaga, N. M. (2019) · bioRxiv (Cold Spring Harbor Laboratory) · doi:10.1101/523555
تأثير الأوكسيتوسن على وزن جسم ذكور الأرانب
Mohammed, A. A., Bonaama, A. F., Moftah, S. A. M., Ramadhan, A. T., Bolhaj, A. M. A., Aregeb, S. A., & El-Mabrouk, M. A. (2021) · AL-MUKHTAR JOURNAL OF SCIENCES · doi:10.54172/mjsc.v36i4.369
Zenclussen, A. C. (2018) · Faculty Opinions – Post-Publication Peer Review of the Biomedical Literature · doi:10.3410/f.733835560.793550261
Ha, S. M., Ahn, I., Kowal, T., Yoon, J. G., Olson, C. A., Diamante, G., Cely, I., Zhang, G., Wang, S., Garcia, K., et al. (2022) · bioRxiv (Cold Spring Harbor Laboratory) · doi:10.1101/2022.09.06.506855
Oxytocin: A key regulator of mitochondrial metabolism and energy homeostasis
Ueda, Y. (2024) · International Journal of Science and Research Archive · doi:10.30574/ijsra.2024.12.1.0734
Edwards, M. M., Nguyen, H. K., Dodson, A. D., Herbertson, A. J., Honeycutt, M. K., Slattery, J. D., Rambousek, J. R., Tsui, E. W., Wolden‐Hanson, T., Wietecha, T., et al. (2024) · bioRxiv (Cold Spring Harbor Laboratory) · doi:10.1101/2024.09.12.612710
Repetitive daily oxytocin treatment reduces weight gain but not acute neonatal procedural pain
Baudat, M., Joosten, E. A. J., & Simons, S. H. P. (2024) · Pediatric Research · doi:10.1038/s41390-024-03680-9
Endocrinologic Sequelae of Anorexia Nervosa and Obesity
Sisley, S. R., Gordon, C. M., & Sonabend, R. (2024) · Springer eBooks · doi:10.1007/978-3-031-66296-6_33
Sartorius, A. M., Kang, H., Deilhaug, E., Walle, K. M., Lawson, E. A., Eddy, K. T., van der Meer, D., Westlye, L. T., & Quintana, D. S. (2025) · medRxiv · doi:10.1101/2025.04.04.25325238
Oduor, E. D., Mwangi, P. W., Chege, B. M., Olago, S. F., & Bukachi, F. (2025) · PLoS ONE · doi:10.1371/journal.pone.0334966
The endocannabinoidome and its role in the central and peripheral control of food intake
Silvestri, C., & Marzo, V. D. (2025) · Handbook of behavioral neuroscience · doi:10.1016/b978-0-443-13908-6.00013-x
Tan, Z., Lyu, P., & Jiang, H. (2025) · BMC Genomics · doi:10.1186/s12864-025-12312-3
Wronski, M., Boutin, R., Sailer, C. O., Galbiati, F., Aulinas, A., Muhammed, M., Eddy, K. T., Thomas, J. J., Kerem, L., Carter, C. S., et al. (2025) · Diabetes Obesity and Metabolism · doi:10.1111/dom.70340
Longitudinal associations among childhood trauma, oxytocin, and metabolic risk in schizophrenia
Goh, K. K., Chen, P.-Y., Chang, H., Kanahara, N., Chen, C., Cheng, M., Yang, C.-T., & Lu, M. (2026) · Psychiatry Research · doi:10.1016/j.psychres.2026.117088
Identification of intranasal oxytocin plasma proteome signatures
Breithaupt, L. E., Harshman, S. G., Botros, P., Zhang, Z., Holman, K., Boutin, R., Galbiati, F., Aulinas, A., Lo, J., Soukas, A. A., et al. (2026) · Endocrine · doi:10.1007/s12020-025-04529-9
Caractérisation d’outils pharmacologiques pour l’étude des récepteurs centraux de la vasopressine
Marir, R. (2013) · theses.fr (ABES) · doi:10.70675/547ee25cz6fbfz417azabc9z92de6a7a2fcc
Brissard, L. (2018) · theses.fr (ABES) · doi:10.70675/24feb632zea3az4ccbz92e9z6c3512519f0f · Cited by 1
Eramo, B., Sepe, C., Friuli, M., Campagna, A., Romano, A., & Gaetani, S. (2026) · Pharmacological Research · doi:10.1016/j.phrs.2026.108279
Hormonal dimorphism in sarcopenia disease
Menard, R., & Madelaine, R. (2026) · Aging · doi:10.18632/aging.206392 · Cited by 2
Adam, K. M., Kuklinski, K. M., Fisher, C. A., Skinner, W. M., Lo, J. Y., Kochersberger, A., & Garrison, J. L. (2026) · bioRxiv (Cold Spring Harbor Laboratory) · doi:10.64898/2026.06.28.735098
Williams, A. L., & Blevins, J. E. (2026) · Current Diabetes Reports · doi:10.1007/s11892-026-01640-7
Güneşli, I., Aksun, M. S., & Yıldız, B. O. (2026) · Journal of Endocrinological Investigation · doi:10.1007/s40618-026-03047-3
Metadata
- Authors
- Deblon, N., Veyrat-Durebex, C., Bourgoin, L., Caillon, A., Bussier, A.-L., Petrosino, S., Piscitelli, F., Legros, J.-J., Geenen, V., Foti, M., Wahli, W., Di Marzo, V., & Rohner-Jeanrenaud, F.
- Affiliations
- University of Geneva (CH)
- Istituto di Chimica Biomolecolare (IT)
- University of Liège (BE)
- University of Lausanne (CH)
- Venue
- PLoS ONE
- Publisher
- Public Library of Science (PLoS)
- Published
- 2011-09-27
- Volume
- 6
- Issue
- 9
- Pages
- e25565
- ISSN
- 1932-6203 (ISSN-L)
- PMC
- PMC3181274
- OpenAlex
- W2161253360
- Cited by
- 254
- References
- 42
- Citations by year
- 2026: 7 · 2025: 11 · 2024: 20 · 2023: 12 · 2022: 18 · 2021: 25 · 2020: 16 · 2019: 23 · 2018: 22 · 2017: 22 · 2016: 19 · 2015: 17 · 2014: 20 · 2013: 16 · 2012: 5
- FWCI
- 6.22
- Type
- journal article
- Language
- en
- Open access
- gold
- doi.org
- Locations
- PLoS ONE (publishedVersion, cc-by)
- Europe PMC (PubMed Central) (publishedVersion, cc-by)
- PubMed Central (publishedVersion, cc-by)
- PubMed (publishedVersion)
- Archive ouverte UNIGE (University of Geneva) (publishedVersion, other-oa)
- IRIS (submittedVersion)
- DOAJ (DOAJ: Directory of Open Access Journals) (submittedVersion, cc-by-sa)
- Figshare (submittedVersion, cc-by)
- Open Repository and Bibliography (University of Liège) (submittedVersion, other-oa)
- SERVAL (Université de Lausanne) (submittedVersion, other-oa)
- Archive ouverte UNIGE (University of Geneva) (submittedVersion, cc-by)
- Funders
- National Science Foundation (310030)
- Schweizerischer Nationalfonds zur Förderung der Wissenschaftlichen Forschung (120147, 128660, 135727, 31003A, 31003A-134919/1, 134919, 310000, 310030, 3100A0)
- National Institutes of Health (DA009789)
- National Institute on Drug Abuse (P01DA009789)
- Topics
- Life Sciences › Neuroscience › Endocrine and Autonomic Systems › Regulation of Appetite and Obesity
- Health Sciences › Medicine › Endocrinology, Diabetes and Metabolism › Adipokines, Inflammation, and Metabolic Diseases
- Life Sciences › Biochemistry, Genetics and Molecular Biology › Molecular Biology › Peroxisome Proliferator-Activated Receptors
- Keywords
- oxytocin, anti-obesity, diet-induced obesity, high-fat diet, adipose tissue lipolysis, fatty acid beta-oxidation, insulin resistance, impaired glucose tolerance, PPARα, stearoyl-CoA desaturase 1, oleoylethanolamide, type 2 diabetes
- MeSH terms
- Adipose Tissue, Animals, Body Weight, Diet, Dose-Response Relationship, Drug, Insulin Resistance, Male, Obesity, Oleic Acids, Oxytocin, Anti-Obesity Agents, PPAR alpha, Mice, Rats, Gene Knockout Techniques, Endocannabinoids
About these checks
Registry, retraction, Cites and statistics results are computed, not judged, with one exception: a printed reference that no index lists is read once by a model before it counts as a citation error. Claims are extracted by a model and kept only when their quote appears verbatim in the text; each cited source is then checked, with a model’s help, for whether it says what the claim relies on. Those verdicts can be wrong — read the claim’s quote and the cited source before relying on one.
Statistics and arithmetic are recomputed, not judged.
Confidence bands are shown only for fields calibrated on our annotated test set. None is calibrated yet, so no band is shown.
What counts as a claim ›How we measure confidence ›How we check this ›
Are you an author, or do you see a problem with this page? Request a review
