

The DOI matches its Crossref record; 30 of the 30 references it cites were found in a registry or an index.
The Bile Acid Receptor GPBAR-1 (TGR5) Modulates Integrity of Intestinal Barrier and Immune Response to Experimental Colitis
Open accessAbstract
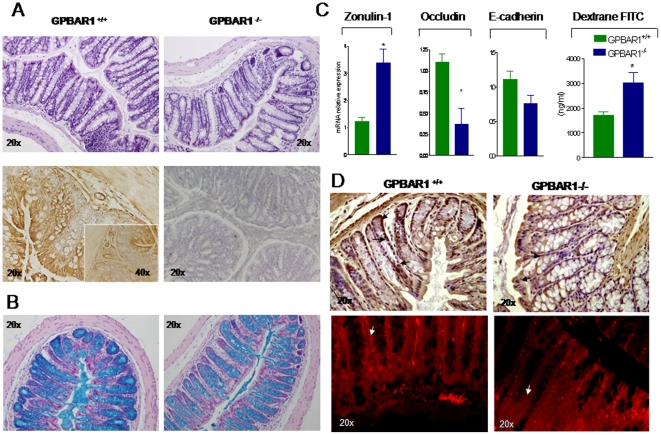
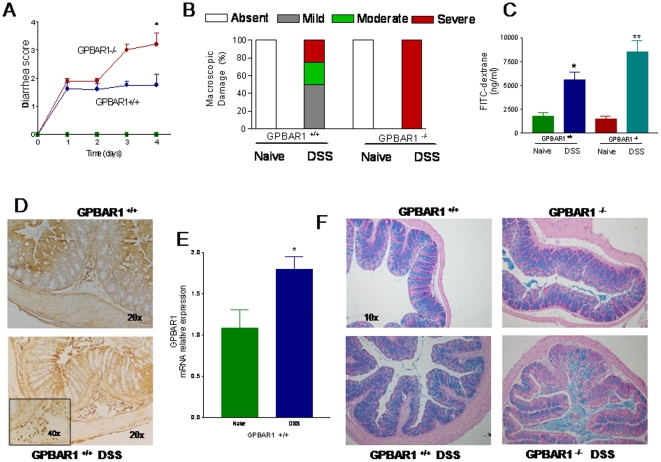
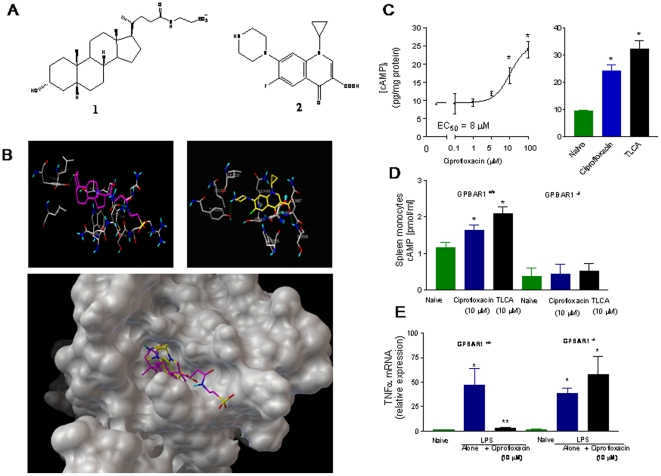
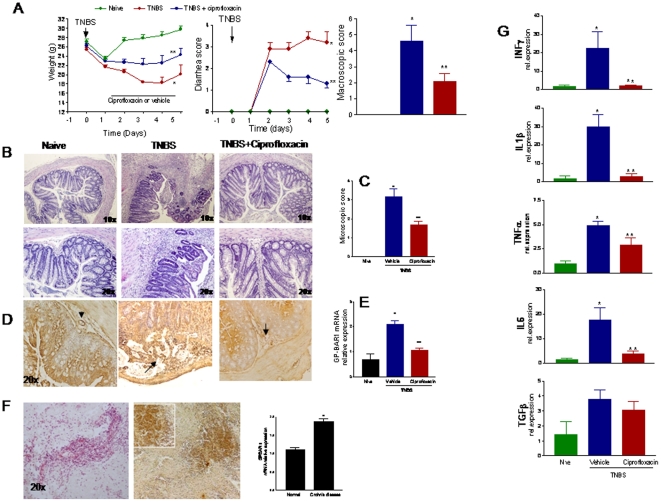
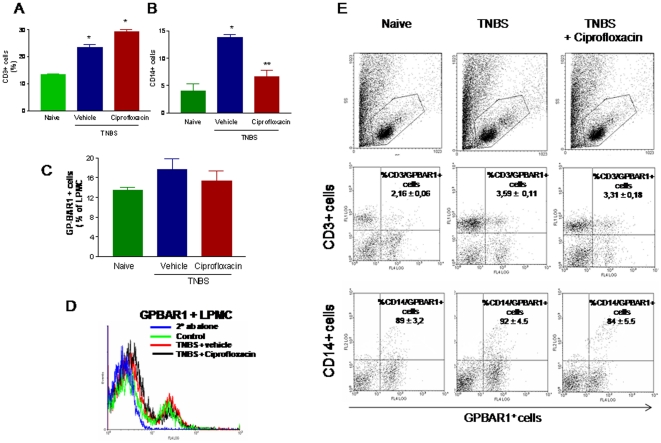
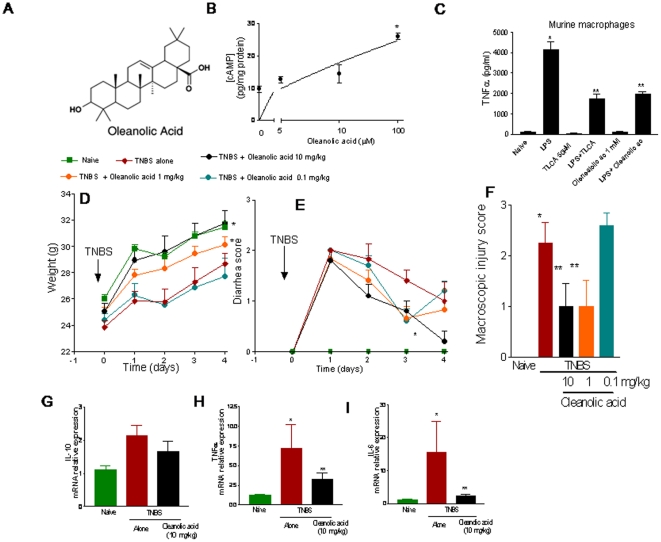
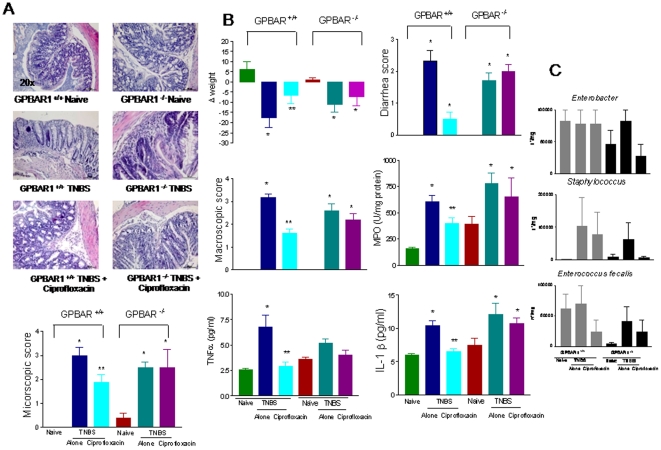
BACKGROUND: GP-BAR1, a member G protein coupled receptor superfamily, is a cell surface bile acid-activated receptor highly expressed in the ileum and colon. In monocytes, ligation of GP-BAR1 by secondary bile acids results in a cAMP-dependent attenuation of cytokine generation. AIMS: To investigate the role GP-BAR1 in regulating intestinal homeostasis and inflammation-driven immune dysfunction in rodent models of colitis. METHODS: Colitis was induced in wild type and GP-BAR1(-/-) mice by DSS and TNBS administration. Potential GP-BAR1 agonists were identified by in silico screening and computational docking studies. RESULTS: GP-BAR1(-/-) mice develop an abnormal morphology of colonic mucous cells and an altered molecular architecture of epithelial tight junctions with increased expression and abnormal subcellular distribution of zonulin 1 resulting in increased intestinal permeability and susceptibility to develop severe colitis in response to DSS at early stage of life. By in silico screening and docking studies we identified ciprofloxacin as a GP-BAR1 ligand. In monocytes, ciprofloxacin increases cAMP concentrations and attenuates TNFα release induced by TLR4 ligation in a GP-BAR1 dependent manner. Treating mice rendered colitic by TNBS with ciprofloxacin and oleanolic acid, a well characterized GP-BAR1 ligand, abrogates signs and symptoms of colitis. Colonic expression of GP-BAR1 mRNA increases in rodent models of colitis and tissues from Crohn's disease patients. Flow cytometry analysis demonstrates that ≈90% of CD14+ cells isolated from the lamina propria of TNBS-treated mice stained positively for GP-BAR1. CONCLUSIONS: GP-BAR1 regulates intestinal barrier structure. Its expression increases in rodent models of colitis and Crohn's disease. Ciprofloxacin is a GP-BAR1 ligand.
Overview
The claims and statistics of this paper haven’t been checked yet.
Run the check — free, no account needed. It reads the open-access text and checks the sources it cites.
Integrity signals
Registry
Cites
Statistics
Figures
Verification
Claims the paper makes
The claims and statistics of this paper haven’t been checked yet.
Run the check — free, no account needed. It reads the open-access text and checks the sources it cites.
Claims other papers make about this one
Each is checked against this paper’s own text: does it say what the citing paper says it does?
In the citing paper
“changes in the composition of the bile acid pool, an increase in colonic expression of GPBAR1 and a decrease in ileal activity of BAR have all been detected in patients suffering from IBD (Cipriani et al., 2011; Duboc et al., 2013; Lenz et al., 1976; Nijmeijer et al., 2011; Rutgeerts et al., 1979).”
From Understanding the Holobiont: How Microbial Metabolites Affect Human Health and Shape the Immune System (2017) · cites this paper as Cipriani et al., 2011
In the citing paper
“Gpbar1−/− mice, like their Nr1h4−/− counterparts, develop more severe disease than wildtype controls in several animal models of inflammatory disorder, including colitis, hepatitis and gastritis (Cipriani et al., 2011; C. Guo et al., 2015; Y.-D. Wang et al., 2011).”
From Understanding the Holobiont: How Microbial Metabolites Affect Human Health and Shape the Immune System (2017) · cites this paper as Cipriani et al., 2011
In the citing paper
“Mice treated with GP-BAR1 agonists (ciprofloxacin and oleanolic acid) abrogated the signs and symptoms of TNBS-induced colitis.117”
From Regulation of Intestinal Barrier Function by Microbial Metabolites (2021) · cites this paper as [117]
In the citing paper
“Importantly these mice were more susceptible to DSS- or TNBS-induced colitis.117”
From Regulation of Intestinal Barrier Function by Microbial Metabolites (2021) · cites this paper as [117]
Self-check
Percentages, sums and reported differences re-computed from the paper’s own numbers.
The self-check needs the paper’s full text.
Citations
Cites
AutoDock4 and AutoDockTools4: Automated docking with selective receptor flexibility
Morris, G. M., Huey, R., Lindstrom, W., Sanner, M. F., Belew, R. K., Goodsell, D. S., & Olson, A. J. (2009) · Journal of Computational Chemistry · doi:10.1002/jcc.21256 · Cited by 26,294
Comparative Protein Modelling by Satisfaction of Spatial Restraints
Šali, A., & Blundell, T. L. (1993) · Journal of Molecular Biology · doi:10.1006/jmbi.1993.1626 · Cited by 12,977
MANTOVANI, A., SOZZANI, S., LOCATI, M., ALLAVENA, P., & SICA, A. (2002) · Trends in Immunology · doi:10.1016/s1471-4906(02)02302-5 · Cited by 5,528
Comparative Protein Structure Modeling of Genes and Genomes
Martí-Renom, M. A., Stuart, A. C., Fiser, A., Sánchez, R., Melo, F., & Šali, A. (2000) · Annual Review of Biophysics and Biomolecular Structure · doi:10.1146/annurev.biophys.29.1.291 · Cited by 3,169
Bile acids induce energy expenditure by promoting intracellular thyroid hormone activation
Watanabe, M., Houten, S. M., Mataki, C., Christoffolete, M. A., Kim, B. W., Sato, H., Messaddeq, N., Harney, J. W., Ezaki, O., Kodama, T., et al. (2006) · Nature · doi:10.1038/nature04330 · Cited by 2,220
A G Protein-coupled Receptor Responsive to Bile Acids
Kawamata, Y., Fujii, R., Hosoya, M., Harada, M., Yoshida, H., Miwa, M., Fukusumi, S., Habata, Y., Itoh, T., Shintani, Y., et al. (2003) · Journal of Biological Chemistry · doi:10.1074/jbc.m209706200 · Cited by 1,628
Main-chain Bond Lengths and Bond Angles in Protein Structures
Laskowski, R. A., Moss, D. S., & Thornton, J. M. (1993) · Journal of Molecular Biology · doi:10.1006/jmbi.1993.1351 · Cited by 1,217
Identification of membrane-type receptor for bile acids (M-BAR)
Maruyama, T., Miyamoto, Y., Nakamura, T., Tamai, Y., Okada, H., Sugiyama, E., Nakamura, T., Itadani, H., & Tanaka, K. (2002) · Biochemical and Biophysical Research Communications · doi:10.1016/s0006-291x(02)02550-0 · Cited by 993
Katsuma, S., Hirasawa, A., & Tsujimoto, G. (2005) · Biochemical and Biophysical Research Communications · doi:10.1016/j.bbrc.2005.01.139 · Cited by 789
The bile acid receptor FXR is a modulator of intestinal innate immunity
Vavassori, P., Mencarelli, A., Renga, B., Distrutti, E., & Fiorucci, S. (2009) · The Journal of Immunology · doi:10.4049/jimmunol.0803978 · Cited by 655
Self-citation
Cited by
Sorted by citations
Items 301–383 of 383
Løkka, G., Dhanasiri, A. K. S., Krogdahl, Å., & Kortner, T. M. (2022) · Fish & Shellfish Immunology · doi:10.1016/j.fsi.2022.10.049 · Cited by 9
Hankir, M. K., Langseder, T., Bankoglu, E. E., Ghoreishi, Y., Dischinger, U., Kurlbaum, M., Kroiß, M., Otto, C., le Roux, C. W., Arora, T., et al. (2020) · iScience · doi:10.1016/j.isci.2020.101777 · Cited by 8
Wei, P., Wu, M., Huang, C., Ho, Y.-H., Hung, C.-S., Lin, Y., Tsao, M.-F., & Lin, J.-C. (2022) · Biomedicines · doi:10.3390/biomedicines10071741 · Cited by 8
Stroke-Associated Pneumonia and the Brain-Gut-Lung Axis
Bai, J., Zhao, Y., Wang, Z., Qin, P., Huang, J., Cheng, Y., Wang, C., Chen, Y., Liu, L., Zhang, Y., et al. (2025) · The Neurologist · doi:10.1097/nrl.0000000000000626 · Cited by 8
Ramayo‐Caldas, Y., Crespo‐Piazuelo, D., Morata, J., González-Rodríguez, O., Sebastià, C., Castelló, A., Dalmau, A., Ramos-Onsins, S. E., Alexiou, K. G., Folch, J. M., et al. (2023) · Microbiology Spectrum · doi:10.1128/spectrum.05271-22 · Cited by 7
Gut Microbiota–Immune System Crosstalk
Fava, F. (2014) · Elsevier eBooks · doi:10.1016/b978-0-12-407825-3.00009-5 · Cited by 6
Wang, M., Hao, G., Qu, Y., Chen, L., Hua, W., Zong, S., Wang, M., Su, C., Quan-ying, Z., Du, Z.-Y., et al. (2022) · Brazilian Journal of Pharmaceutical Sciences · doi:10.1590/s2175-97902022e191086 · Cited by 6
Zhuo, N., Yun, Y., Zhang, C., Guo, S., Yin, J., Zhao, T., Ge, X., Gu, M., Xie, X., & Nan, F. (2024) · Bioorganic Chemistry · doi:10.1016/j.bioorg.2024.107132 · Cited by 6
Xenobiotic and endobiotic handling by the mucosal immune system
Chen, M. L., & Sundrud, M. S. (2018) · Current Opinion in Gastroenterology · doi:10.1097/mog.0000000000000478 · Cited by 6
Bile acid receptors regulate the role of intestinal macrophages in inflammatory bowel disease
Yang, H., Shi, X., Wang, B., Li, H., Li, B., Zhou, T., Tian, L., Wang, S., & Yin, K. (2025) · Frontiers in Immunology · doi:10.3389/fimmu.2025.1577000 · Cited by 7
Al‐Kishali, H. A., Fattah, M. A. A. E., Mohammad, W. A., & El-Abhar, H. S. (2019) · JGH Open · doi:10.1002/jgh3.12148 · Cited by 5
Gao, J., Li, L., Zhang, S., Zhao, H., Feng, B., Liu, C., Wang, X., Li, S., Li, Y., & Zhao, D. (2025) · International Immunopharmacology · doi:10.1016/j.intimp.2025.116056 · Cited by 4
Biagioli, M., Giorgio, C. D., Marchianò, S., Sensini, B., Urbani, G., Giannelli, E., Lachi, G., Massa, C., Sette, M. R., Paniconi, F., et al. (2026) · Gut Microbes · doi:10.1080/19490976.2026.2645125 · Cited by 4
The interplay between gut microbiota metabolites and host body: Implications in health and disease
Islam, M. M., Hasan, M. S., Ripon, M. A. R., Refa, A. I., Sworna, M. A., Hossain, M. T., Shuha, M. F., Islam, M. M. H., Nahar, S., Opsora, S. N., et al. (2026) · Human Nutrition & Metabolism · doi:10.1016/j.hnm.2026.200364 · Cited by 4
Zhou, S., Li, Y., Qiu, X., Li, B., Hu, L., Tang, Z., Li, H., Li, S., Fang, Z., & Chen, H. (2024) · Journal of the Science of Food and Agriculture · doi:10.1002/jsfa.13571 · Cited by 4
Rachubik, P., Grochowalska, K., Audzeyenka, I., Rogacka, D., & Piwkowska, A. (2025) · Biochemical and Biophysical Research Communications · doi:10.1016/j.bbrc.2025.151671 · Cited by 4
Liu, H., Zhang, X., Li, K., Fang, Q., Liu, X., Sun, L. Y., Guo, G.-L., An, S., Li, M., Wang, G., et al. (2024) · Aquaculture Reports · doi:10.1016/j.aqrep.2024.102455 · Cited by 4
The Role of Bile Acid Receptors in Chronic Inflammatory Diseases
Park, R., & Ji, J. D. (2017) · Journal of Rheumatic Diseases · doi:10.4078/jrd.2017.24.5.253 · Cited by 4
Dey, P., & Moludi, J. (2023) · Elsevier eBooks · doi:10.1016/b978-0-323-85730-7.00030-8 · Cited by 4
Bile acid signaling mediates gut microbiota regulation of host lipid metabolism
Liu, M., He, C., Lv, X., Zheng, W., Yin, J., Li, Y., & Ma, J. (2026) · Frontiers in Microbiology · doi:10.3389/fmicb.2025.1696213 · Cited by 6
Alterations in Peripheral Metabolites as Key Actors in Alzheimer’s Disease
Sheng, C., Chu, X., He, Y., Ding, Q., Jia, S., Shi, Q.-G., Sun, R., Li, S., Du, W., Liang, Y., et al. (2023) · Current Alzheimer Research · doi:10.2174/1567205020666230825091147 · Cited by 4
Chen, Y., Li, K., Zhang, M., Liu, J., Wang, M., Xiu, Y.-H., Zhang, Q.-Y., & Zhao, D. (2025) · Journal of Functional Foods · doi:10.1016/j.jff.2025.106706 · Cited by 2
Porez, G., Prawitt, J., Gross, B. S., & Staels, B. (2012) · Cited by 3
Bile Acids: A Bridge Linking Gut Microbiota and NAFLD
Zhang, J., Wang, C., Ji, X., Wu, F., Lin, Z., Zhou, Y., Xu, C., & Wang, F. (2022) · Advanced Gut & Microbiome Research · doi:10.1155/2022/4752148 · Cited by 3
Kaji, I., & Kaunitz, J. D. (2018) · Elsevier eBooks · doi:10.1016/b978-0-12-809954-4.00028-1 · Cited by 4
Zeise, K. D., Falkowski, N. R., Metcalf, J. D., Brown, C. A., & Huffnagle, G. B. (2024) · Infection and Immunity · doi:10.1128/iai.00438-24 · Cited by 2
Xu, J., Zhang, S., Chen, Q., Xu, C., Wu, S., Lin, Q., Li, Z., & Nie, Q. (2025) · Food Frontiers · doi:10.1002/fft2.70211 · Cited by 2
Bile acid dysmetabolism in inflammatory bowel diseases
Kuznetsova, D. A., Lapin, S. V., & Владимировна, Г. И. (2023) · Almanac of Clinical Medicine · doi:10.18786/2072-0505-2023-51-007 · Cited by 3
Qiang, X., Wang, X., Liang, S., Li, S., Lv, Y., & Zhan, J. (2024) · Food Research International · doi:10.1016/j.foodres.2024.115543 · Cited by 3
Microbiota, Inflammation, and Gut Barrier Dysfunction in HCC
Ram, A. K., Wright, G. A. K., & Vairappan, B. (2019) · IntechOpen eBooks · doi:10.5772/intechopen.89578 · Cited by 2
Liu, Y.-J., Sun, Q., Chen, J., Chen, M., Ouyang, B., Sun, H., Nie, Y., Wang, P., Ma, J., & Guan, X. (2018) · The Journal of Trauma: Injury, Infection, and Critical Care · doi:10.1097/ta.0000000000001979 · Cited by 2
Biagioli, M., Giorgio, C. D., Massa, C., Marchianò, S., Bellini, R., Bordoni, M., Urbani, G., Roselli, R., Lachi, G., Morretta, E., et al. (2024) · bioRxiv (Cold Spring Harbor Laboratory) · doi:10.1101/2024.04.08.588556 · Cited by 2
The bile acid receptor TGR5 and cholestasis
Merlen, G., Bidault, V., Doignon, I., Garcin, I., & Tordjmann, T. (2022) · Exploration of Digestive Diseases · doi:10.37349/edd.2022.00011 · Cited by 1
Li, Y., Kong, H., Li, C., Gu, Z., Ban, X., & Li, Z. (2025) · Journal of Agricultural and Food Chemistry · doi:10.1021/acs.jafc.5c07137 · Cited by 1
The intestinal microbiota as a key modulator of acute graft-versus-host disease
Paredes, J. E., Schmiester, M., Jenq, R. R., & van den Brink, M. R. M. (2026) · Nature reviews. Cancer · doi:10.1038/s41568-026-00910-6 · Cited by 2
Zhang, J., Pan, Z., Zhao, S., Li, J., Chen, L., Jin, Y., Tang, R., Gao, X., & Sun, J. (2026) · Frontiers in Immunology · doi:10.3389/fimmu.2026.1822573 · Cited by 1
Acierno, C., Caturano, A., Barletta, F., Rinaldi, L., Sasso, F. C., Adinolfi, L. E., & Nevola, R. (2026) · Frontiers in Physiology · doi:10.3389/fphys.2026.1881697 · Cited by 1
Bile acid metabolism and signaling in human and animal health: A One Health perspective
Li, L., Liu, S., Cao, Z., Cao, Y., Wu, S., Deng, L., Yao, J., & Zhang, J. (2026) · iMetaOmics. · doi:10.1002/imo2.70123 · Cited by 1
Loss of TGR5-activating bile acids is associated with disease activity in inflammatory bowel disease
Stallhofer, J., Leonhardt, J., Semmler, J., Neugebauer, S., Kiehntopf, M., Löhden, W., Homeister, L., Ungelenk, M., Hübner, C. A., Steube, A., et al. (2026) · Scientific Reports · doi:10.1038/s41598-026-63156-0 · Cited by 1
The Cross Talk Between Bile Acids and Intestinal Microbiota
Fiamoncini, J. (2019) · Elsevier eBooks · doi:10.1016/b978-0-12-815249-2.00014-2 · Cited by 1
Kudira, R., Pasula, S., Kapil, S., & Miethke, A. G. (2022) · BIO-PROTOCOL · doi:10.21769/bioprotoc.4400 · Cited by 1
The Microbiota and Its Modulation in Immune-Mediated Disorders
Pevsner‐Fischer, M., Rot, C., Tuganbaev, T., & Elinav, E. (2016) · Elsevier eBooks · doi:10.1016/b978-0-12-803302-9.00010-5 · Cited by 1
Drapkina, O. M., & Fomicheva, Е. I. (2016) · Rational Pharmacotherapy in Cardiology · doi:10.20996/1819-6446-2016-12-3-344-350 · Cited by 1
Ghosh, S., Erickson, D. L., Chua, M. J., Collins, J., & Jala, V. R. (2023) · bioRxiv (Cold Spring Harbor Laboratory) · doi:10.1101/2023.07.24.550342 · Cited by 1
The gut microbiome and gut-liver axis in NAFLDPreprint
Guo, C., Ji, J., Wu, J., Wu, L., Feng, J., Li, J., Yu, Q., Dai, W., Li, Y., & Zheng, Y. (2024) · doi:10.22541/au.170666810.08665505/v1
The impact of host-microbe interactions on murine colonic secretomotor function
Lomasney, K. W. (2014) · Cork Open Research Archive (University College Cork, Ireland)
Intestinal targeting of small molecule MMP and TGR5 ligands for inflammatory bowel disease
Pigott, M. (2018) · Arrow@dit (Dublin Institute of Technology)
Role of bile acid receptors in the regulation of cardiovascular diseases
Shiozaki, Y., Keenan, A. L., & Miyazaki, M. (2020) · Elsevier eBooks · doi:10.1016/b978-0-12-819404-1.00020-8
Role and significance of bile acid membrane receptor GPBAR1 in pathogenesis of obstructive jaundice
Liu, J., Chen, H., & Zhang, G.-X. (2020) · World Chinese Journal of Digestology · doi:10.11569/wcjd.v28.i21.1053
The Relationship between Bile Acid Metabolism and Colorectal Polyps
董, 书. (2021) · Advances in Clinical Medicine · doi:10.12677/acm.2021.116369
Pleiotropic effects of ursodeoxycholic acid
Stepanov, Y. М., & Саленко, А. В. (2021) · GASTROENTEROLOGY · doi:10.22141/2308-2097.55.2.2021.233637
ABSTRACTS IMMUNOPHARMACOLOGY MEETING
a.vv., A. V. (2021) · doi:10.36118/pharmadvances.2021.17
Ramayo‐Caldas, Y., Crespo‐Piazuelo, D., Morata, J., González-Rodríguez, O., Sebastià, C., Castelló, A., Dalmau, A., Ramos-Onsins, S. E., Alexiou, K. G., Folch, J. M., et al. (2022) · bioRxiv (Cold Spring Harbor Laboratory) · doi:10.1101/2022.10.06.510490
Oguro-Igashira, E., & Takeda, K. (2025) · Translational and Regulatory Sciences · doi:10.33611/trs.2025-014
Kaden, T., Allwang, M., Stallhofer, J., Graf, K., Raasch, M., & Mosig, A. S. (2026) · Frontiers in Immunology · doi:10.3389/fimmu.2026.1761539
Xie, X., Dong, J., Lu, G., Gao, K., Li, X., Mao, W., Chen, F., Tong, Z., Li, B., & Li, W. (2020) · Figshare · doi:10.6084/m9.figshare.12650160
Xie, X., Dong, J., Lu, G., Gao, K., Li, X., Mao, W., Chen, F., Tong, Z., Li, B., & Li, W. (2020) · Figshare · doi:10.6084/m9.figshare.12650169
Xie, X., Dong, J., Lu, G., Gao, K., Li, X., Mao, W., Chen, F., Tong, Z., Li, B., & Li, W. (2020) · Figshare · doi:10.6084/m9.figshare.12650163
Xie, X., Dong, J., Lu, G., Gao, K., Li, X., Mao, W., Chen, F., Tong, Z., Li, B., & Li, W. (2020) · Figshare · doi:10.6084/m9.figshare.12650172
Gu, F., Zhu, S., Tang, Y., Liu, X., Jia, M., Malmuthuge, N., Valencak, T. G., McFadden, J. W., Liu, J., & Sun, H.-Z. (2023) · Figshare · doi:10.6084/m9.figshare.22618519
Xie, X., Dong, J., Lu, G., Gao, K., Li, X., Mao, W., Chen, F., Tong, Z., Li, B., & Li, W. (2020) · Figshare · doi:10.6084/m9.figshare.12650166
Kahale, N. (2019) · theses.fr (ABES) · doi:10.70675/94e9e289z3c99z462bzb7a9z44059acaf7ed
Influence of bile acids metabolism on hepatic immunity in mice
Guinot, V. (2022) · theses.fr (ABES) · doi:10.70675/b69bb11eza30fz4874z9af2za6e31b2d5ad8
Mariaule, V. (2024) · theses.fr (ABES) · doi:10.70675/1d41e841zf788z4dd7z8784zc26304e24ea1
Qi, Z., Qi, P., Tang, H., & Qi, P. (2026) · Phenomics · doi:10.1007/s43657-025-00243-8
Altered bile acid metabolism in people with HIV correlates with systemic and intestinal inflammation
Irwin, S. L., Elliott, J. E., Li, F., Ruiz, P., Pr, A., Du, X., & Fulcher, J. A. (2026) · AIDS · doi:10.1097/qad.0000000000004585
Postbiotics: a promising tool in personalized medicine approach for the inflammatory disorders
Nami, S., Abbasi, A., Aghebati‐Maleki, A., HosseinYari, A., & Maleki, L. A. (2026) · Molecular and Cellular Biochemistry · doi:10.1007/s11010-026-05597-9
Bile acids as mediators of microbiota signaling in entero-hepatic disorders
Fiorucci, S., Marchianò, S., Giorgio, C. D., Urbani, G., Monti, M. C., Zampella, A., Distrutti, E., & Biagioli, M. (2026) · Biochemical Pharmacology · doi:10.1016/j.bcp.2026.118341
Mu, K., He, M., Liao, R., Shao, C., Xie, P., Xie, J., Liu, Y., Ju, Z., Zhong, K., Yuan, Y., et al. (2026) · Nutrients · doi:10.3390/nu18162641
Seethaler, B., Basrai, M., Delzenne, N. M., Walter, J., Nguyen, N. K., & Bischoff, S. C. (2026) · Microbiome · doi:10.1186/s40168-026-02501-x
Tan, F., Chen, Y., Ma, M., Zheng, L., Ma, A., Jia, Y., Xia, J., Chen, Z., & Li, S. (2026) · Food Bioscience · doi:10.1016/j.fbio.2026.110092
Bile acid signaling in health and disease
Fan, Z., He, M., Liang, T., 张必利, Zhao, N., & Li, P. (2026) · Molecular Biomedicine · doi:10.1186/s43556-026-00603-4
Liu, Y., Zang, D., & Chen, J. (2026) · Frontiers in Immunology · doi:10.3389/fimmu.2026.1922678
BindingDB (2021) · UC San Diego · doi:10.7270/q2dv1pd0
Metadata
- Authors
- Cipriani, S., Mencarelli, A., Chini, M. G., Distrutti, E., Renga, B., Bifulco, G., Baldelli, F., Donini, A., & Fiorucci, S.
- Affiliations
- University of Perugia (IT)
- University of Salerno (IT)
- Azienda Ospedaliera di Perugia (IT)
- Corresponding author
- Fiorucci, Stefano
- ORCID
- Venue
- PLoS ONE
- Publisher
- Public Library of Science (PLoS)
- Published
- 2011-10-27
- Volume
- 6
- Issue
- 10
- Pages
- e25637
- ISSN
- 1932-6203 (ISSN-L)
- PMC
- PMC3203117
- OpenAlex
- W1970465623
- Cited by
- 382
- References
- 30
- Citations by year
- 2026: 20 · 2025: 19 · 2024: 30 · 2023: 34 · 2022: 45 · 2021: 49 · 2020: 31 · 2019: 29 · 2018: 25 · 2017: 14 · 2016: 16 · 2015: 17 · 2014: 23 · 2013: 19 · 2012: 11
- FWCI
- 10.58
- Type
- journal article
- Language
- en
- Update notices
- correction (2013-01-29)
- Open access
- gold
- doi.org
- Locations
- PLoS ONE (publishedVersion, cc-by)
- Europe PMC (PubMed Central) (publishedVersion, cc-by)
- PubMed Central (publishedVersion, cc-by)
- PubMed (publishedVersion)
- National University of Singapore (submittedVersion, cc-by)
- DOAJ (DOAJ: Directory of Open Access Journals) (submittedVersion)
- Figshare (submittedVersion, cc-by)
- Archivio Istituzionale della Ricerca - Università degli Studi del Molise (submittedVersion)
- Topics
- Health Sciences › Medicine › Gastroenterology › Inflammatory Bowel Disease
- Health Sciences › Medicine › Oncology › Drug Transport and Resistance Mechanisms
- Health Sciences › Medicine › Gastroenterology › Gastrointestinal motility and disorders
- Keywords
- TGR5, bile acid receptors, colitis, intestinal barrier integrity, tight junctions, intestinal permeability, ciprofloxacin, oleanolic acid, cAMP signaling, TNF-α, TLR4, monocytes, Crohn's disease, DSS-induced colitis, TNBS-induced colitis, lamina propria
- MeSH terms
- Animals, Cholera Toxin, Ciprofloxacin, Colitis, Haptoglobins, Immunity, Intestinal Mucosa, Ligands, Permeability, Protein Precursors, Mice, Knockout, Tight Junctions, Receptors, G-Protein-Coupled, Mice
About these checks
Registry, retraction, Cites and statistics results are computed, not judged, with one exception: a printed reference that no index lists is read once by a model before it counts as a citation error. Claims are extracted by a model and kept only when their quote appears verbatim in the text; each cited source is then checked, with a model’s help, for whether it says what the claim relies on. Those verdicts can be wrong — read the claim’s quote and the cited source before relying on one.
Statistics and arithmetic are recomputed, not judged.
Confidence bands are shown only for fields calibrated on our annotated test set. None is calibrated yet, so no band is shown.
What counts as a claim ›How we measure confidence ›How we check this ›
Are you an author, or do you see a problem with this page? Request a review
