

The DOI matches its Crossref record; 83 of the 84 references it cites were found in a registry or an index.
Protein 3D Structure Computed from Evolutionary Sequence Variation
Open accessAbstract
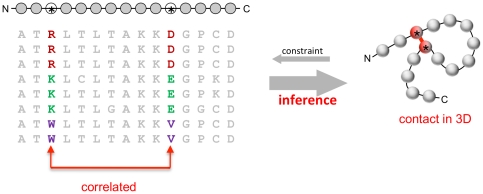
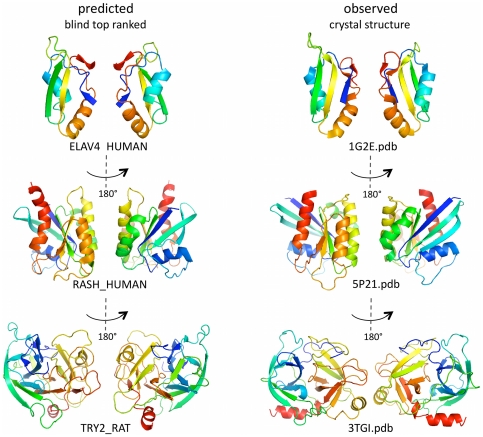
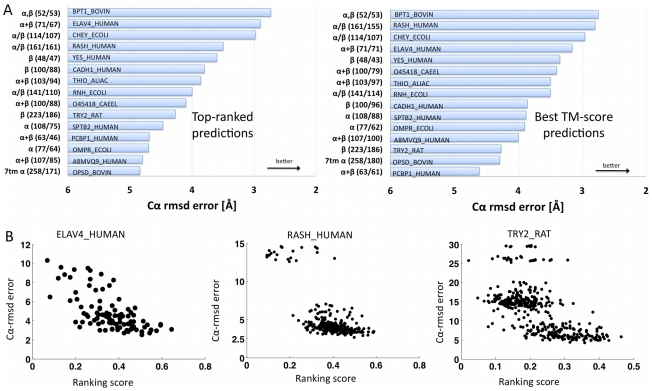
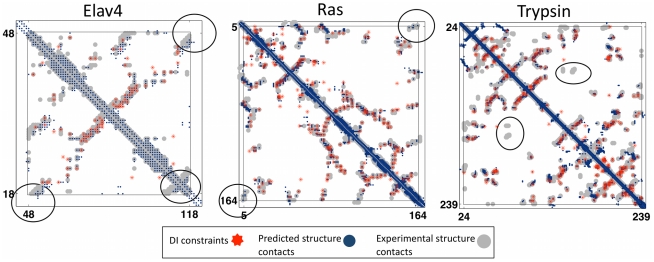
The evolutionary trajectory of a protein through sequence space is constrained by its function. Collections of sequence homologs record the outcomes of millions of evolutionary experiments in which the protein evolves according to these constraints. Deciphering the evolutionary record held in these sequences and exploiting it for predictive and engineering purposes presents a formidable challenge. The potential benefit of solving this challenge is amplified by the advent of inexpensive high-throughput genomic sequencing.In this paper we ask whether we can infer evolutionary constraints from a set of sequence homologs of a protein. The challenge is to distinguish true co-evolution couplings from the noisy set of observed correlations. We address this challenge using a maximum entropy model of the protein sequence, constrained by the statistics of the multiple sequence alignment, to infer residue pair couplings. Surprisingly, we find that the strength of these inferred couplings is an excellent predictor of residue-residue proximity in folded structures. Indeed, the top-scoring residue couplings are sufficiently accurate and well-distributed to define the 3D protein fold with remarkable accuracy.We quantify this observation by computing, from sequence alone, all-atom 3D structures of fifteen test proteins from different fold classes, ranging in size from 50 to 260 residues, including a G-protein coupled receptor. These blinded inferences are de novo, i.e., they do not use homology modeling or sequence-similar fragments from known structures. The co-evolution signals provide sufficient information to determine accurate 3D protein structure to 2.7-4.8 Å C(α)-RMSD error relative to the observed structure, over at least two-thirds of the protein (method called EVfold, details at http://EVfold.org). This discovery provides insight into essential interactions constraining protein evolution and will facilitate a comprehensive survey of the universe of protein structures, new strategies in protein and drug design, and the identification of functional genetic variants in normal and disease genomes.
Overview
The claims and statistics of this paper haven’t been checked yet.
Run the check — free, no account needed. It reads the open-access text and checks the sources it cites.
Integrity signals
Registry
Cites
Statistics
Figures
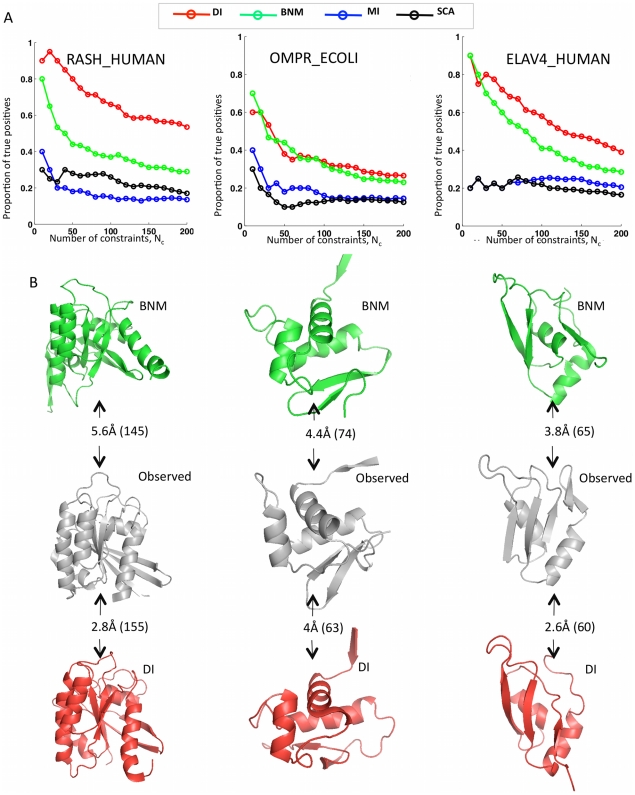
![Figure 3 Progress in contact prediction using the maximum entropy method. Extraction of evolutionary information about residue coupling and predicted contacts from multiple sequence alignments works much better using the global statistical model (right, Direct Information, DI, Equation 3) than the local statistical model (left, Mutual Information, MI, Equation 1). Predicted contacts for DI (red lines connecting the residues predicted to be coupled from sequence information) are better positioned in the experimentally observed structure (grey ribbon diagram), than those for MI (left, blue lines), shown here for the RAS protein (upper) and ELAV4 protein (lower). The DI residue pairs are also more evenly distributed along the chain and overlap more accurately with the contacts in the observed structure (red stars [predicted, grey circles [observed] in contact map; center, upper right triangle) than those using MI (blue [predicted], grey circles [observed]; center, lower left triangle). Details of contact maps for all proteins comparing predicted and observed contacts are in Figures S1 and S2, Text S1.](/paper-figures/ad0edff5338c41479018a65a69fdb4cd/protein-3d-structure-computed-from-evolutionary-sequence-variation-figure-3.jpg)
Verification
Claims the paper makes
The claims and statistics of this paper haven’t been checked yet.
Run the check — free, no account needed. It reads the open-access text and checks the sources it cites.
Claims other papers make about this one
Each is checked against this paper’s own text: does it say what the citing paper says it does?
In the citing paper
“The premise of methods to infer structure based on evolutionary couplings is that, because amino acids exist and evolve in the context of 3D structure, they are not free to evolve independently, but instead co-evolve in patterns reflective of the underlying structure.”
From Predicting multiple conformations via sequence clustering and AlphaFold2 (2024) · cites this paper as [9]
In the citing paper
“One of the major insights leveraged by AlphaFold 1,2 comes from the use of evolutionary covariations that can be extracted from large-scale multiple sequence alignments.[49][50][51][52][53][54]”
From AlphaFold and Implications for Intrinsically Disordered Proteins (2021) · cites this paper as [50]
Self-check
Percentages, sums and reported differences re-computed from the paper’s own numbers.
The self-check needs the paper’s full text.
Citations
Cites
The PyMOL Molecular Graphics System
DeLano, W. L. (2002) · Medical Entomology and Zoology · Cited by 18,147
Crystallography & NMR System: A New Software Suite for Macromolecular Structure Determination
Brünger, A. T., Adams, P. D., Clore, G. M., DeLano, W. L., Gros, P., Grosse‐Kunstleve, R. W., Jiang, J., Kuszewski, J. J., Nilges, M., Pannu, N., et al. (1998) · Acta Crystallographica Section D Biological Crystallography · doi:10.1107/s0907444998003254 · Cited by 15,723
The Pfam Protein Families Database
Bateman, A. G. (2002) · Nucleic Acids Research · doi:10.1093/nar/30.1.276 · Cited by 14,075
I-TASSER: a unified platform for automated protein structure and function prediction
Roy, A., Küçükural, A., & Zhang, Y. (2010) · Nature Protocols · doi:10.1038/nprot.2010.5 · Cited by 6,212
The Pfam protein families database
Finn, R. D., Mistry, J., Tate, J., Coggill, P., Heger, A., Pollington, J. E., Gavin, O. L., Gunasekaran, P., Ceric, G., Forslund, K., et al. (2010) · Nucleic Acids Research · doi:10.1093/nar/gkp985 · Cited by 2,694
Scoring function for automated assessment of protein structure template quality
Zhang, Y., & Skolnick, J. (2004) · Proteins: Structure, Function, and Bioinformatics · doi:10.1002/prot.20264 · Cited by 2,392
Atomic-level characterization of the structural dynamics of proteins
Shaw, D. E., Maragakis, P., Lindorff-Larsen, K., Piana, S., Dror, R. O., Eastwood, M. P., Bank, J. A., Jumper, J. M., Salmon, J. K., Shan, Y., et al. (2010) · Science · doi:10.1126/science.1187409 · Cited by 1,923
Weak pairwise correlations imply strongly correlated network states in a neural population
Schneidman, E., Berry, M. J., Segev, R., & Bialek, W. (2006) · Nature · doi:10.1038/nature04701 · Cited by 1,745
Holm, L., & Sander, C. (1996) · Science · doi:10.1126/science.273.5275.595 · Cited by 1,497
Self-citationMorcos, F., Pagnani, A., Lunt, B., Bertolino, A., Marks, D. S., Sander, C., Zecchina, R., Onuchic, J. N., Hwa, T., & Weigt, M. (2011) · Proceedings of the National Academy of Sciences · doi:10.1073/pnas.1111471108 · Cited by 1,434
Self-citation
Research works printed but not linked: 3
- KT Simons, 1999, Ab initio protein structure prediction of CASP III targets using ROSETTA., Proteins, Suppl 3, 171, 10.1002/(SICI)1097-0134(1999)37:3+<171::AID-PROT21>3.0.CO;2-Z · DOI
- MMT Mezard, 2009, Constraint satisfaction problems and neural networks: A statistical physics perspective., Journal of Physiology, 103, 107
- TR Lezon, 2006, Using the principle of entropy maximization to infer genetic interaction networks from gene expression patterns., Proceedings of the National Academy of Sciences of the United States of America, 103, 19033, 10.1073/pnas.0609152103 · DOI
Cited by
Sorted by citations
Highly accurate protein structure prediction with AlphaFold
Jumper, J., Evans, R., Pritzel, A., Green, T., Figurnov, M., Ronneberger, O., Tunyasuvunakool, K., Bates, R., Žídek, A., Potapenko, A., et al. (2021) · Nature · doi:10.1038/s41586-021-03819-2 · Cited by 43,764
Rives, A., Meier, J., Sercu, T., Goyal, S., Lin, Z., Liu, J., Guo, D., Ott, M., Zitnick, C. L., Ma, J., et al. (2021) · Proceedings of the National Academy of Sciences · doi:10.1073/pnas.2016239118 · Cited by 3,286
ProtTrans: Toward Understanding the Language of Life Through Self-Supervised Learning
Elnaggar, A., Heinzinger, M., Dallago, C., Rehawi, G., Wang, Y., Jones, L., Gibbs, T., Feher, T., Angerer, C., Steinegger, M., et al. (2022) · IEEE Transactions on Pattern Analysis and Machine Intelligence · doi:10.1109/tpami.2021.3095381 · Cited by 2,329
Opportunities and obstacles for deep learning in biology and medicine
Ching, T., Himmelstein, D. S., Beaulieu-Jones, B. K., Kalinin, A. A., Do, B. T., Way, G. P., Ferrero, E., Agapow, P.-M., Zietz, M., Hoffman, M. M., et al. (2018) · Journal of The Royal Society Interface · doi:10.1098/rsif.2017.0387 · Cited by 2,310
HHblits: lightning-fast iterative protein sequence searching by HMM-HMM alignment
Remmert, M., Biegert, A., Hauser, A., & Söding, J. (2012) · Nature Methods · doi:10.1038/nmeth.1818 · Cited by 2,288
Metadata
- Authors
- Marks, D. S., Colwell, L. J., Sheridan, R., Hopf, T. A., Pagnani, A., Zecchina, R., & Sander, C.
- Affiliations
- Harvard University (US)
- MRC Laboratory of Molecular Biology (GB)
- Memorial Sloan Kettering Cancer Center (US)
- Italian institute for Genomic Medicine (IT)
- Politecnico di Torino (IT)
- Corresponding author
- Marks, Debora S.
- Venue
- PLoS ONE
- Publisher
- Public Library of Science (PLoS)
- Published
- 2011-12-07
- Volume
- 6
- Issue
- 12
- Pages
- e28766
- ISSN
- 1932-6203 (ISSN-L)
- PMC
- PMC3233603
- OpenAlex
- W2061042699
- Cited by
- 1,144
- References
- 84
- Citations by year
- 2026: 61 · 2025: 60 · 2024: 47 · 2023: 72 · 2022: 96 · 2021: 104 · 2020: 90 · 2019: 110 · 2018: 91 · 2017: 107 · 2016: 71 · 2015: 74 · 2014: 72 · 2013: 56 · 2012: 29
- FWCI
- 20.79
- Type
- journal article
- Language
- en
- Open access
- gold
- doi.org
- Locations
- PLoS ONE (publishedVersion, cc-by)
- Europe PMC (PubMed Central) (publishedVersion, cc-by)
- PubMed Central (publishedVersion, cc-by)
- PubMed (publishedVersion)
- PORTO@Iris (submittedVersion, cc-by)
- DOAJ (DOAJ: Directory of Open Access Journals) (submittedVersion, cc-by-sa)
- Figshare (submittedVersion, cc-by)
- PORTO Publications Open Repository TOrino (Politecnico di Torino) (submittedVersion, cc-by)
- Funders
- Memorial Sloan-Kettering Cancer Center
- Studienstiftung des Deutschen Volkes
- National Institutes of Health (NIH U54, CA143798)
- Engineering and Physical Sciences Research Council (EP/H028064/1)
- National Cancer Institute (U54CA143798)
- National Institute of General Medical Sciences (R01GM106303)
- Topics
- Life Sciences › Biochemistry, Genetics and Molecular Biology › Molecular Biology › Protein Structure and Dynamics
- Life Sciences › Biochemistry, Genetics and Molecular Biology › Structural Biology › Enzyme Structure and Function
- Life Sciences › Biochemistry, Genetics and Molecular Biology › Molecular Biology › RNA and protein synthesis mechanisms
- Keywords
- protein structure prediction, coevolution, maximum entropy model, multiple sequence alignment, de novo structure prediction, protein evolution, G protein-coupled receptors, protein engineering
- MeSH terms
- Animals, Humans, Protein Conformation, Proteins, Rhodopsin, Trypsin, Genetic Variation, Drug Design, Reproducibility of Results, Models, Statistical, Genome, Protein Structure, Tertiary, Evolution, Molecular, Entropy, Computational Biology, Catalytic Domain, Imaging, Three-Dimensional
About these checks
Registry, retraction, Cites and statistics results are computed, not judged, with one exception: a printed reference that no index lists is read once by a model before it counts as a citation error. Claims are extracted by a model and kept only when their quote appears verbatim in the text; each cited source is then checked, with a model’s help, for whether it says what the claim relies on. Those verdicts can be wrong — read the claim’s quote and the cited source before relying on one.
Statistics and arithmetic are recomputed, not judged.
Confidence bands are shown only for fields calibrated on our annotated test set. None is calibrated yet, so no band is shown.
What counts as a claim ›How we measure confidence ›How we check this ›
Are you an author, or do you see a problem with this page? Request a review
