

The DOI matches its Crossref record; 40 of the 40 references it cites were found in a registry or an index.
Increased Oral Detection, but Decreased Intestinal Signaling for Fats in Mice Lacking Gut Microbiota
Open accessAbstract
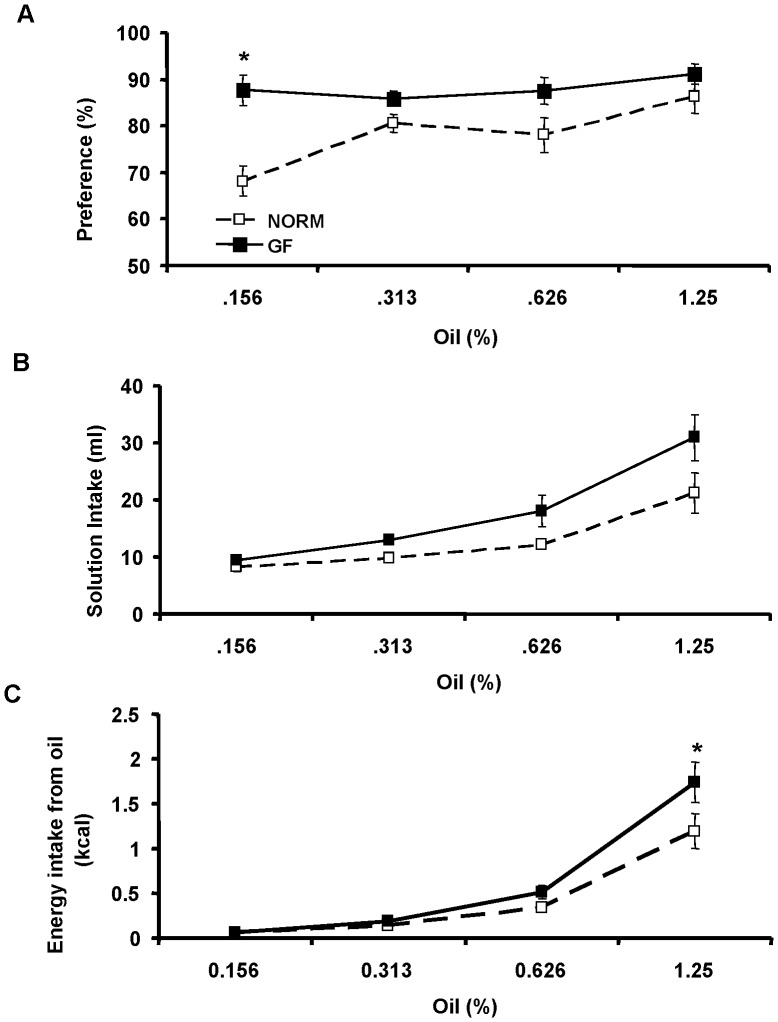
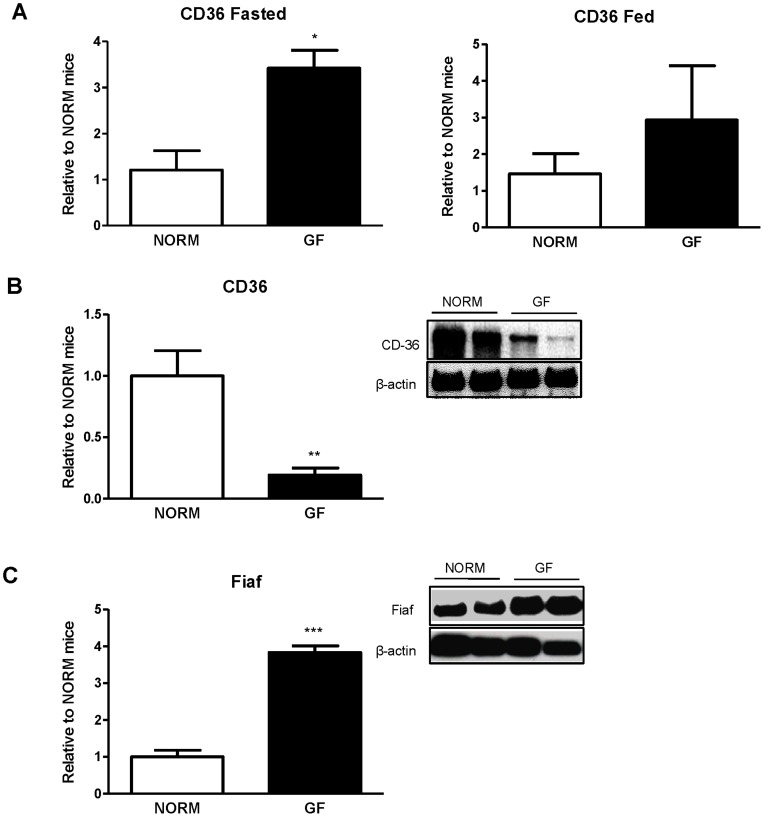
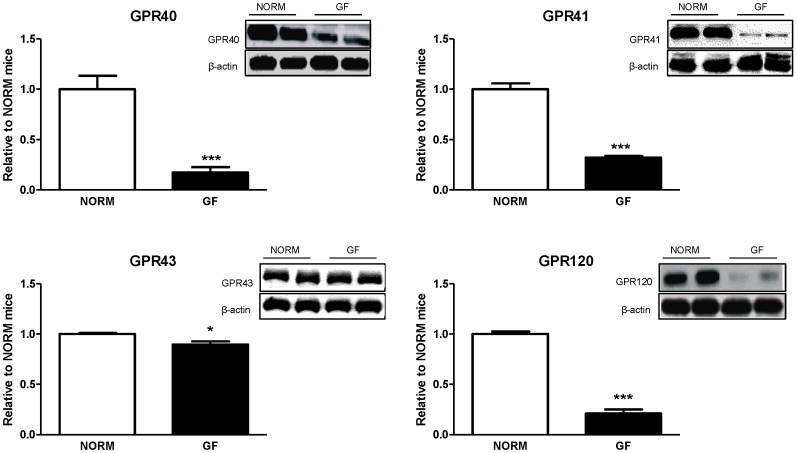
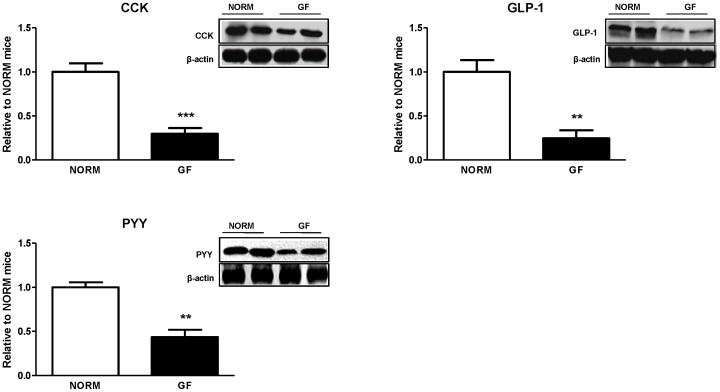
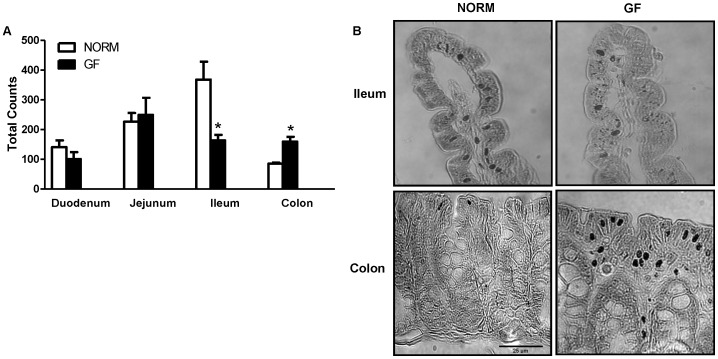
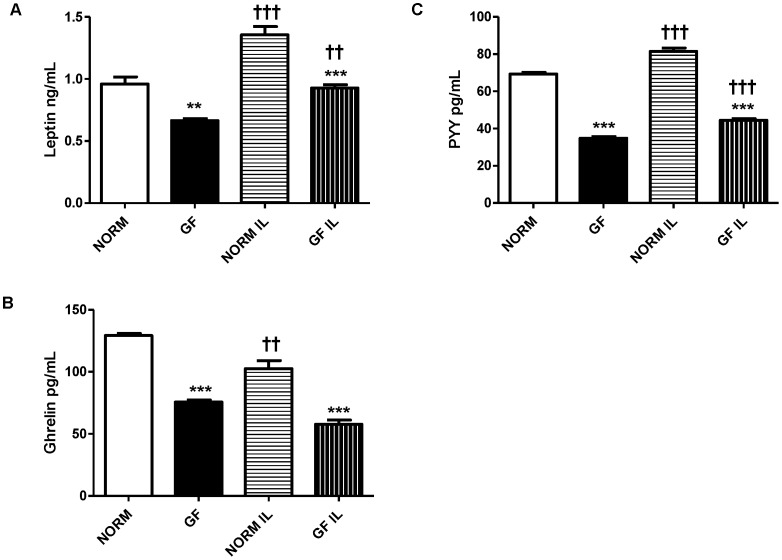
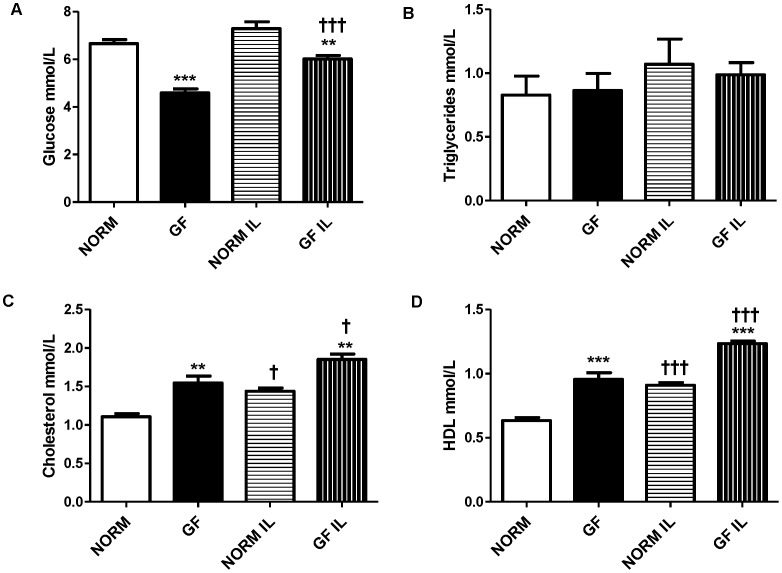
Germ-free (GF) mice lacking intestinal microbiota are significantly leaner than normal (NORM) control mice despite consuming more calories. The contribution of microbiota on the recognition and intake of fats is not known. Thus, we investigated the preference for, and acceptance of, fat emulsions in GF and NORM mice, and associated changes in lingual and intestinal fatty acid receptors, intestinal peptide content, and plasma levels of gut peptides. GF and NORM C57Bl/6J mice were given 48-h two-bottle access to water and increasing concentrations of intralipid emulsions. Gene expression of the lingual fatty acid translocase CD36 and protein expression of intestinal satiety peptides and fatty-acid receptors from isolated intestinal epithelial cells were determined. Differences in intestinal enteroendocrine cells along the length of the GI tract were quantified. Circulating plasma satiety peptides reflecting adiposity and biochemical parameters of fat metabolism were also examined. GF mice had an increased preference and intake of intralipid relative to NORM mice. This was associated with increased lingual CD36 (P<0.05) and decreased intestinal expression of fatty acid receptors GPR40 (P<0.0001), GPR41 (P<0.0001), GPR43 (P<0.05), and GPR120 (P<0.0001) and satiety peptides CCK (P<0.0001), PYY (P<0.001), and GLP-1 (P<0.001). GF mice had fewer enteroendocrine cells in the ileum (P<0.05), and more in the colon (P<0.05), relative to NORM controls. Finally, GF mice had lower levels of circulating leptin and ghrelin (P<0.001), and altered plasma lipid metabolic markers indicative of energy deficits. Increased preference and caloric intake from fats in GF mice are associated with increased oral receptors for fats coupled with broad and marked decreases in expression of intestinal satiety peptides and fatty-acid receptors.
Overview
The claims and statistics of this paper haven’t been checked yet.
Run the check — free, no account needed. It reads the open-access text and checks the sources it cites.
Integrity signals
Registry
Cites
Statistics
Figures
Verification
Claims the paper makes
The claims and statistics of this paper haven’t been checked yet.
Run the check — free, no account needed. It reads the open-access text and checks the sources it cites.
Claims other papers make about this one
Each is checked against this paper’s own text: does it say what the citing paper says it does?
In the citing paper
“Indeed, germ-free mice have lower levels of plasma ghrelin under basal conditions than conventional mice [128,129].”
From Anxiety, depression, and the microbiome: A role for gut peptides (2018) · cites this paper as [128]
Self-check
Percentages, sums and reported differences re-computed from the paper’s own numbers.
The self-check needs the paper’s full text.
Citations
Cites
The gut microbiota as an environmental factor that regulates fat storage
Bäckhed, F., Ding, H., Wang, T., Hooper, L. V., Koh, G. Y., Nagy, A., Semenkovich, C. F., & Gordon, J. I. (2004) · Proceedings of the National Academy of Sciences · doi:10.1073/pnas.0407076101 · Cited by 6,245
Ghrelin induces adiposity in rodents
Tschöp, M., Smiley, D. L., & Heiman, M. L. (2000) · Nature · doi:10.1038/35038090 · Cited by 3,949
Health and economic burden of the projected obesity trends in the USA and the UK
Wang, Y. C., McPherson, K., Marsh, T., Gortmaker, S. L., & Brown, M. (2011) · The Lancet · doi:10.1016/s0140-6736(11)60814-3 · Cited by 2,775
Mechanisms underlying the resistance to diet-induced obesity in germ-free mice
Bäckhed, F., Manchester, J. K., Semenkovich, C. F., & Gordon, J. I. (2007) · Proceedings of the National Academy of Sciences · doi:10.1073/pnas.0605374104 · Cited by 2,615
Free fatty acids regulate gut incretin glucagon-like peptide-1 secretion through GPR120
Hirasawa, A., Tsumaya, K., Awaji, T., Katsuma, S., Adachi, T., Yamada, M., Sugimoto, Y., Miyazaki, S., & Tsujimoto, G. (2004) · Nature Medicine · doi:10.1038/nm1168 · Cited by 1,580
Samuel, B. S., Shaito, A., Motoike, T., Rey, F. E., Backhed, F., Manchester, J. K., Hammer, R. E., Williams, S. C., Crowley, J., Yanagisawa, M., et al. (2008) · Proceedings of the National Academy of Sciences · doi:10.1073/pnas.0808567105 · Cited by 1,564
Developmental regulation of intestinal angiogenesis by indigenous microbes via Paneth cells
Stappenbeck, T. S., Hooper, L. V., & Gordon, J. I. (2002) · Proceedings of the National Academy of Sciences · doi:10.1073/pnas.202604299 · Cited by 1,095
Rabot, S., Membrez, M., Bruneau, A., Gérard, P., Harach, T., Moser, M., Raymond, F., Mansourian, R., & Chou, C. J. (2010) · The FASEB Journal · doi:10.1096/fj.10.164921 · Cited by 610 · cited 4×
“Conversely, HF-feeding and obesity is associated with decreases in lingual CD36 expression [16], although changes in lingual CD36 protein levels in obese mice has not been confirmed [19].”
BackgroundResultInfluentialThe gut microbiota modulates host energy and lipid metabolism in mice
Velagapudi, V. R., Hezaveh, R., Reigstad, C. S., Gopalacharyulu, P., Yetukuri, L., Islam, S., Felin, J., Perkins, R., Borén, J., Orešič, M., et al. (2010) · Journal of Lipid Research · doi:10.1194/jlr.m002774 · Cited by 589
Kersten, S., Mandard, S., Tan, N. S., Escher, P., Metzger, D., Chambon, P., Gonzalez, F. J., Desvergne, B., & Wahli, W. (2000) · Journal of Biological Chemistry · doi:10.1074/jbc.m004029200 · Cited by 489
Taste Preference for Fatty Acids Is Mediated by GPR40 and GPR120
Cartoni, C., Yasumatsu, K., Ohkuri, T., Shigemura, N., Yoshida, R., Godinot, N., le Coutre, J., Ninomiya, Y., & Damak, S. (2010) · Journal of Neuroscience · doi:10.1523/jneurosci.0496-10.2010 · Cited by 439
Absence of intestinal microbiota does not protect mice from diet-induced obesity
Fleissner, C. K., Huebel, N., Abd El-Bary, M. M., Loh, G., Klaus, S., & Blaut, M. (2010) · British Journal of Nutrition · doi:10.1017/s0007114510001303 · Cited by 436
Mandard, S., Zandbergen, F., van Straten, E., Wahli, W., Kuipers, F., Müller, M., & Kersten, S. (2006) · Journal of Biological Chemistry · doi:10.1074/jbc.m506519200 · Cited by 433
Human duodenal enteroendocrine cells: source of both incretin peptides, GLP-1 and GIP
Theodorakis, M. J., Carlson, O. D., Michopoulos, S., Doyle, M. E., Juhaszova, M., Petraki, K., & Egan, J. M. (2005) · American Journal of Physiology-Endocrinology and Metabolism · doi:10.1152/ajpendo.00326.2004 · Cited by 402
Jan, S. L., Amy, C., Cazes, A., Monnot, C., Lamandé, N., Favier, J., Philippe, J., Sibony, M., Gasc, J., Corvol, P. L., et al. (2003) · American Journal Of Pathology · doi:10.1016/s0002-9440(10)64285-x · Cited by 342
Short-chain fatty acids modify colonic motility through nerves and polypeptide YY release in the rat
Cherbut, C., Ferrier, L., Rozé, C., Anini, Y., Blottière, H. M., Lecannu, G., & Galmiche, J. (1998) · American Journal of Physiology-Gastrointestinal and Liver Physiology · doi:10.1152/ajpgi.1998.275.6.g1415 · Cited by 316
Impact of inulin and oligofructose on gastrointestinal peptides
Delzenne, N. M., Cani, P. D., Daubioul, C., & Neyrinck, A. M. (2005) · British Journal Of Nutrition · doi:10.1079/bjn20041342 · Cited by 314
Liou, A. P., Lu, X., Sei, Y., Zhao, X., Pechhold, S. B., Carrero, R. J., Raybould, H. E., & Wank, S. A. (2010) · Gastroenterology · doi:10.1053/j.gastro.2010.10.012 · Cited by 287
Free fatty acids induce cholecystokinin secretion through GPR120
Tanaka, T., Katsuma, S., Adachi, T., Koshimizu, T., Hirasawa, A., & Tsujimoto, G. (2007) · Naunyn-Schmiedeberg s Archives of Pharmacology · doi:10.1007/s00210-007-0200-8 · Cited by 280
CD36 gene deletion reduces fat preference and intake but not post-oral fat conditioning in mice
Sclafani, A. J., Ackroff, K., & Abumrad, N. A. (2007) · American Journal of Physiology-Regulatory, Integrative and Comparative Physiology · doi:10.1152/ajpregu.00211.2007 · Cited by 189
Martin, C., Passilly‐Degrace, P., Gaillard, D., Merlin, J.-F., Chevrot, M., & Besnard, P. (2011) · PLoS ONE · doi:10.1371/journal.pone.0024014 · Cited by 167
A Gut Feeling for Obesity: 7TM Sensors on Enteroendocrine Cells
Engelstoft, M. S., Egerod, K. L., Holst, B., & Schwartz, T. W. (2008) · Cell Metabolism · doi:10.1016/j.cmet.2008.11.004 · Cited by 147
Swartz, T. D., Duca, F. A., de Wouters, T., Sakar, Y., & Covașă, M. (2011) · British Journal Of Nutrition · doi:10.1017/s0007114511003412 · Cited by 137
Sclafani, A. J., & Glendinning, J. I. (2005) · American Journal of Physiology-Regulatory, Integrative and Comparative Physiology · doi:10.1152/ajpregu.00176.2005 · Cited by 133
Fatty acid responses in taste cells from obesity-prone and -resistant rats
Gilbertson, T. A., Liu, L., Kim, I., Burks, C. A., & HANSEN, D. (2005) · Physiology & Behavior · doi:10.1016/j.physbeh.2005.08.057 · Cited by 132
Dietary Fat Preferences Are Inversely Correlated with Peripheral Gustatory Fatty Acid Sensitivitya
Gilbertson, T. A., Liu, L., York, D. A., & Bray, G. A. (1998) · Annals of the New York Academy of Sciences · doi:10.1111/j.1749-6632.1998.tb10560.x · Cited by 126
Corn oil and mineral oil stimulate sham feeding in rats
Mindell, S., Smith, G. P., & Greenberg, D. (1990) · Physiology & Behavior · doi:10.1016/0031-9384(90)90314-t · Cited by 89
Decreased expression of CD36 in circumvallate taste buds of high-fat diet induced obese rats
Zhang, X.-J., Zhou, L., Ban, X., Liu, D., Jiang, W., & Liu, X.-M. (2010) · Acta Histochemica · doi:10.1016/j.acthis.2010.09.007 · Cited by 83
Intestinal lipid absorption is not affected in CD36 deficient mice
Goudriaan, J. R., Dahlmans, V. E. H., Febbraio, M., Teusink, B., Romijn, J. A., Havekes, L. M., & Voshol, P. J. (2002) · Molecular and Cellular Biochemistry · doi:10.1023/a:1020575412789 · Cited by 73
Flavor preferences conditioned by sugars: Rats learn to prefer glucose over fructose
Ackroff, K., & Sclafani, A. J. (1991) · Physiology & Behavior · doi:10.1016/0031-9384(91)90023-h · Cited by 66
Degrace-Passilly, P., & Besnard, P. (2012) · Current Opinion in Clinical Nutrition & Metabolic Care · doi:10.1097/mco.0b013e32834ff19c · Cited by 60
Cherbuy, C., Honvo‐Houeto, E., Bruneau, A., Bridonneau, C., Mayeur, C., Duée, P., Langella, P., & Thomas, M. (2010) · American Journal of Physiology-Gastrointestinal and Liver Physiology · doi:10.1152/ajpgi.00384.2009 · Cited by 58
Enhanced acceptance and metabolism of fats by rats fed a high-fat diet
Reed, D. R., Tordoff, M. G., & Friedman, M. I. (1991) · American Journal of Physiology-Regulatory, Integrative and Comparative Physiology · doi:10.1152/ajpregu.1991.261.5.r1084 · Cited by 51
Taste does not determine daily intake of dilute sugar solutions in mice
Glendinning, J. I., Beltrán, F. J., Benton, L., Cheng, S., Gieseke, J., Gillman, J. A. M., & Spain, H. N. (2010) · American Journal of Physiology-Regulatory, Integrative and Comparative Physiology · doi:10.1152/ajpregu.00331.2010 · Cited by 33
Lucas, F., & Sclafani, A. J. (1996) · Physiology & Behavior · doi:10.1016/0031-9384(96)00136-9 · Cited by 31
Goodlad, R. A., Ghatei, M. A., Jan Domin, Y., Wright, N. A., Ratcliffe, B., Fordham, J. P., & Bloom, S. R. (1989) · Quarterly Journal of Experimental Physiology · doi:10.1113/expphysiol.1989.sp003291 · Cited by 27
Fat absorption in germ-free and conventional rats artificially deprived of bile secretion.
Demarne, Y., Corring, T., PIHET, A., & SACQUET, E. (1982) · Gut · doi:10.1136/gut.23.1.49 · Cited by 26
Altered orosensory sensitivity to oils in CCK-1 receptor deficient rats
Swartz, T. D., Hajnal, A. S., & Covașă, M. (2009) · Physiology & Behavior · doi:10.1016/j.physbeh.2009.10.016 · Cited by 17
The Cholesterol-lowering Effect of Commercial Diet Fed to Germfree and Conventional Rats
Wöstmann, B. S. J., & Kan, D. (1964) · Journal of Nutrition · doi:10.1093/jn/84.3.277 · Cited by 9
LA FLORE GASTRO-INTESTINALE ET LA DIGESTION DES MATIÈRES GRASSES CHEZ LE MONOGASTRIQUE
Demarne, Y., SACQUET, E., & GARNIER, H. (1972) · annales de biologie animale biochimie biophysique · doi:10.1051/rnd:19720313 · Cited by 4
Research works printed but not linked: 1
- Y Demarne, 1972, Gastrointestinal flora and fat digestion in monogastrics., Ann Biol Anim Biochim Biophys, 12, 509
Cited by
Sorted by citations
Gut/brain axis and the microbiota
Mayer, E. A., Tillisch, K., & Gupta, A. (2015) · Journal of Clinical Investigation · doi:10.1172/jci76304 · Cited by 1,503
Martin, C. R., Osadchiy, V., Kalani, A., & Mayer, E. A. (2018) · Cellular and Molecular Gastroenterology and Hepatology · doi:10.1016/j.jcmgh.2018.04.003 · Cited by 1,284
Tomiyama, A. J. (2019) · Annual Review of Psychology · doi:10.1146/annurev-psych-010418-102936 · Cited by 695
“Germ-free mice, in contrast, have lower levels of satiety hormones like leptin (Duca et al. 2012).”
BackgroundGut Microbiota and Energy Homeostasis in Fish
Butt, R. L., & Volkoff, H. (2019) · Frontiers in Endocrinology · doi:10.3389/fendo.2019.00009 · Cited by 637
The microbiota–gut–brain axis in obesity
Torres‐Fuentes, C., Schellekens, H., Dinan, T. G., & Cryan, J. F. (2017) · The Lancet. Gastroenterology & hepatology · doi:10.1016/s2468-1253(17)30147-4 · Cited by 623
Metadata
- Authors
- Duca, F. A., Swartz, T. D., Sakar, Y., & Covasa, M.
- Affiliations
- Microbiologie de l’alimentation au service de la santé (FR)
- Venue
- PLoS ONE
- Publisher
- Public Library of Science (PLoS)
- Published
- 2012-06-29
- Volume
- 7
- Issue
- 6
- Pages
- e39748
- ISSN
- 1932-6203 (ISSN-L)
- PMC
- PMC3387243
- OpenAlex
- W2061559910
- Cited by
- 181
- References
- 40
- Citations by year
- 2026: 5 · 2025: 9 · 2024: 17 · 2023: 12 · 2022: 15 · 2021: 14 · 2020: 24 · 2019: 21 · 2018: 16 · 2017: 14 · 2016: 9 · 2015: 8 · 2014: 10 · 2013: 7
- FWCI
- 3.22
- Type
- journal article
- Language
- en
- Open access
- gold
- doi.org
- Locations
- PLoS ONE (publishedVersion, cc-by)
- Europe PMC (PubMed Central) (publishedVersion, cc-by)
- PubMed Central (publishedVersion, cc-by)
- PubMed (publishedVersion)
- HAL (submittedVersion, other-oa)
- DOAJ (DOAJ: Directory of Open Access Journals) (submittedVersion, cc-by-sa)
- Funders
- Institut National de la Recherche Agronomique
- Topics
- Life Sciences › Biochemistry, Genetics and Molecular Biology › Molecular Biology › Gut microbiota and health
- Life Sciences › Neuroscience › Endocrine and Autonomic Systems › Regulation of Appetite and Obesity
- Health Sciences › Medicine › Gastroenterology › Gastrointestinal motility and disorders
- Keywords
- gut microbiota, germ-free mice, dietary fat intake, fat preference, fatty acid receptor, CD36, GPR40, GPR41, GPR43, GPR120, satiety peptides, cholecystokinin, peptide YY, glucagon-like peptide-1, enteroendocrine cells, leptin, ghrelin, energy homeostasis, lipid emulsions
- MeSH terms
- Animals, Blood Glucose, Body Weight, Energy Intake, Cell Count, Emulsions, Gastrointestinal Hormones, Gene Expression Regulation, Germ-Free Life, Intestinal Mucosa, Intestines, Lipids, Male, Mice, Inbred C57BL, Mouth, Oils, Peptides, Signal Transduction, CD36 Antigens, Enteroendocrine Cells, Lipid Metabolism, Mice, Metagenome
About these checks
Registry, retraction, Cites and statistics results are computed, not judged, with one exception: a printed reference that no index lists is read once by a model before it counts as a citation error. Claims are extracted by a model and kept only when their quote appears verbatim in the text; each cited source is then checked, with a model’s help, for whether it says what the claim relies on. Those verdicts can be wrong — read the claim’s quote and the cited source before relying on one.
Statistics and arithmetic are recomputed, not judged.
Confidence bands are shown only for fields calibrated on our annotated test set. None is calibrated yet, so no band is shown.
What counts as a claim ›How we measure confidence ›How we check this ›
Are you an author, or do you see a problem with this page? Request a review
