

The DOI matches its Crossref record; 69 of the 69 references it cites were found in a registry or an index.
Gut Microbiota Composition Is Correlated to Grid Floor Induced Stress and Behavior in the BALB/c Mouse
Open accessAbstract
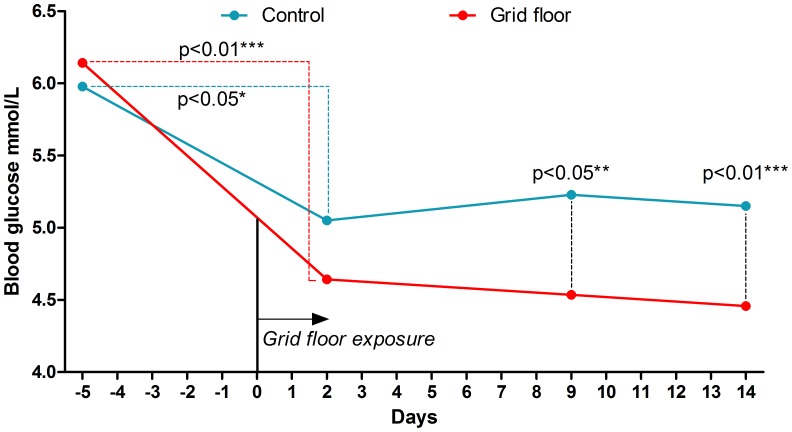
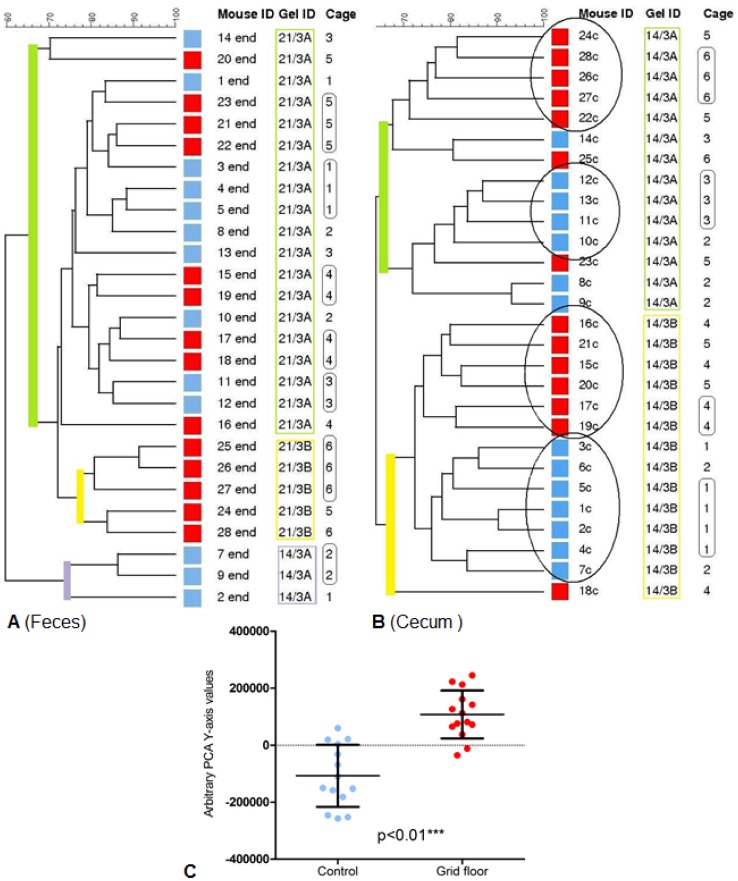
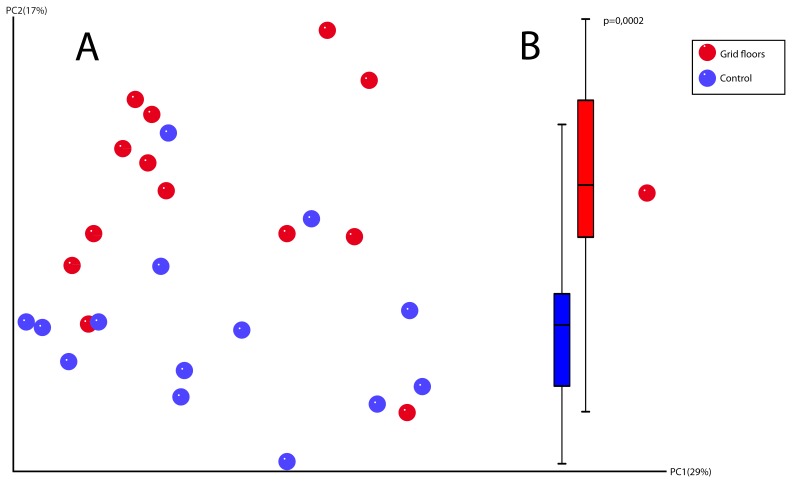
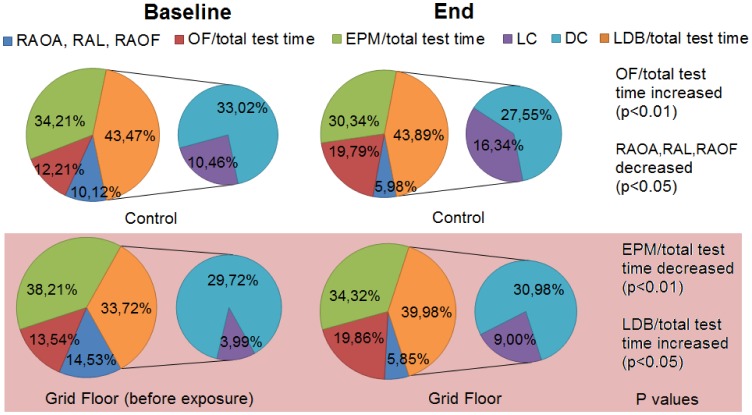
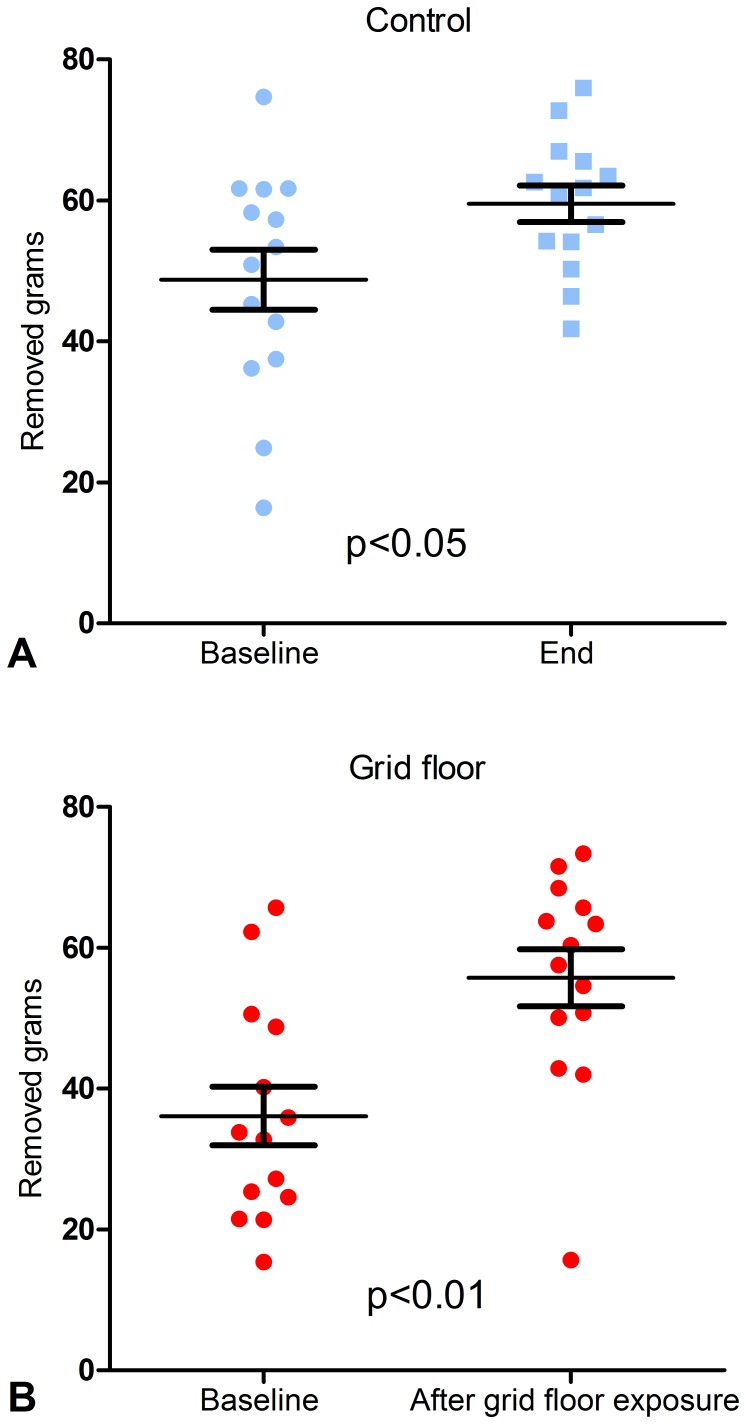
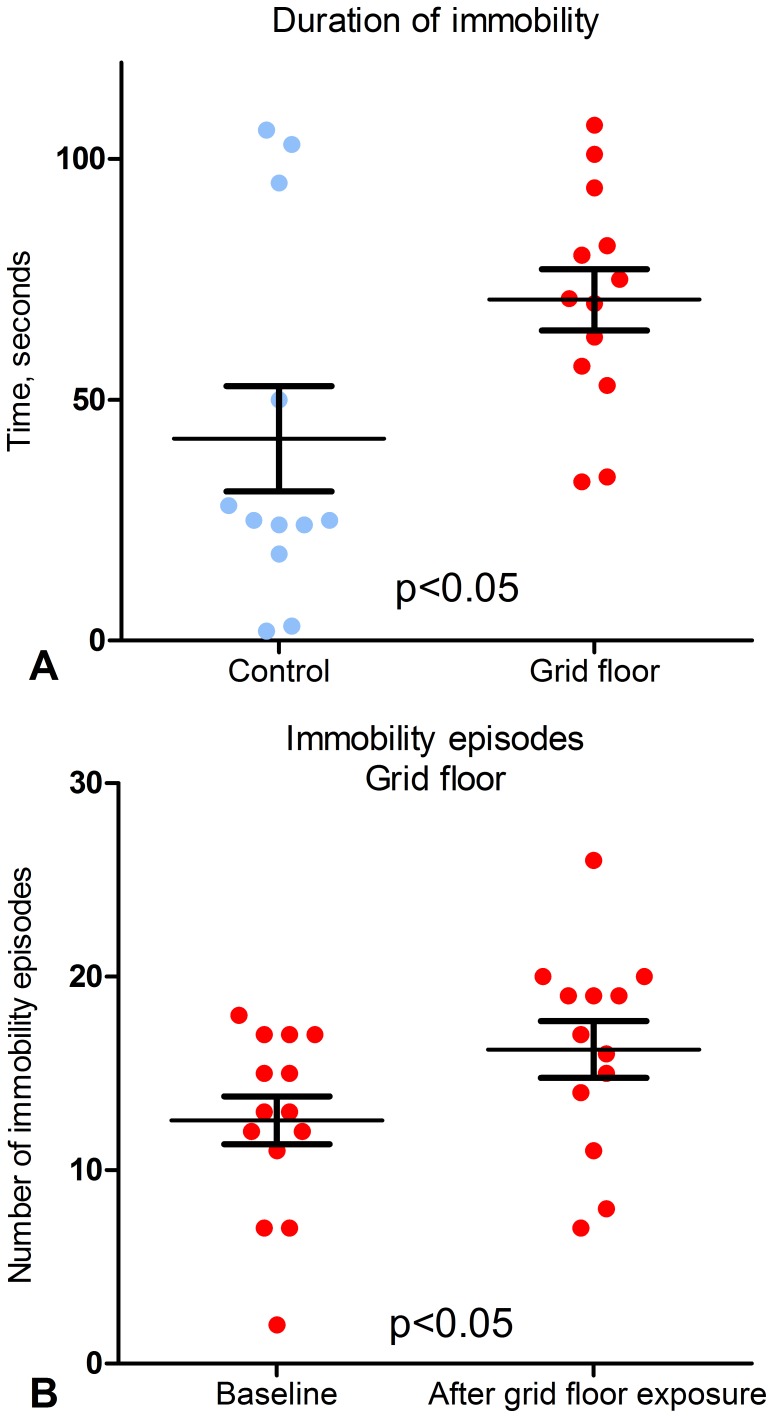
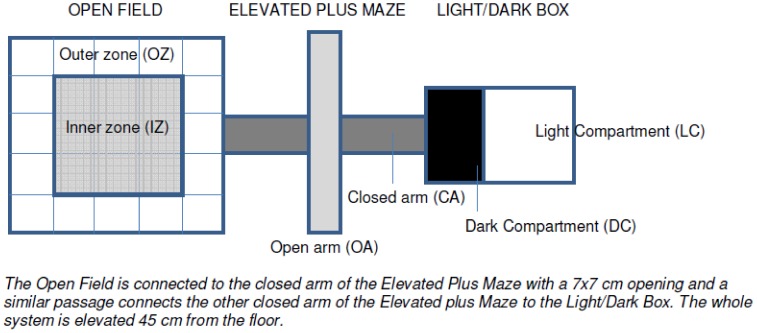
Stress has profound influence on the gastro-intestinal tract, the immune system and the behavior of the animal. In this study, the correlation between gut microbiota composition determined by Denaturing Grade Gel Electrophoresis (DGGE) and tag-encoded 16S rRNA gene amplicon pyrosequencing (454/FLX) and behavior in the Tripletest (Elevated Plus Maze, Light/Dark Box, and Open Field combined), the Tail Suspension Test, and Burrowing in 28 female BALB/c mice exposed to two weeks of grid floor induced stress was investigated. Cytokine and glucose levels were measured at baseline, during and after exposure to grid floor. Stressing the mice clearly changed the cecal microbiota as determined by both DGGE and pyrosequencing. Odoribacter, Alistipes and an unclassified genus from the Coriobacteriaceae family increased significantly in the grid floor housed mice. Compared to baseline, the mice exposed to grid floor housing changed the amount of time spent in the Elevated Plus Maze, in the Light/Dark Box, and burrowing behavior. The grid floor housed mice had significantly longer immobility duration in the Tail Suspension Test and increased their number of immobility episodes from baseline. Significant correlations were found between GM composition and IL-1α, IFN-γ, closed arm entries of Elevated Plus Maze, total time in Elevated Plus Maze, time spent in Light/Dark Box, and time spent in the inner zone of the Open Field as well as total time in the Open Field. Significant correlations were found to the levels of Firmicutes, e.g. various species of Ruminococccaceae and Lachnospiraceae. No significant difference was found for the evaluated cytokines, except an overall decrease in levels from baseline to end. A significant lower level of blood glucose was found in the grid floor housed mice, whereas the HbA1c level was significantly higher. It is concluded that grid floor housing changes the GM composition, which seems to influence certain anxiety-related parameters.
Overview
The claims and statistics of this paper haven’t been checked yet.
Run the check — free, no account needed. It reads the open-access text and checks the sources it cites.
Integrity signals
Registry
Cites
Statistics
Figures
Verification
Claims the paper makes
The claims and statistics of this paper haven’t been checked yet.
Run the check — free, no account needed. It reads the open-access text and checks the sources it cites.
Claims other papers make about this one
Each is checked against this paper’s own text: does it say what the citing paper says it does?
In the citing paper
“Other modifying factors (Figure 1) include psychological stress33,34, physical activity35, tobacco use36, alcohol consumption37, and antibiotic exposure38, 39,40.”
From The gut Microbiome in adult and pediatric functional gastrointestinal disorders (2019) · cites this paper as [33]
Self-check
Percentages, sums and reported differences re-computed from the paper’s own numbers.
The self-check needs the paper’s full text.
Citations
Cites
Muyzer, G., de Waal, E. C., & Uitterlinden, A. G. (1993) · Applied and Environmental Microbiology · doi:10.1128/aem.59.3.695-700.1993 · Cited by 11,490
Molecular Mechanisms of Depression: Perspectives on New Treatment Strategies
Lang, U. E., & Borgwardt, S. (2013) · Cellular Physiology and Biochemistry · doi:10.1159/000350094 · Cited by 8,526
Enterotypes of the human gut microbiome
MetaHIT Consortium (additional members), Arumugam, M., Raes, J., Pelletier, E., Le Paslier, D., Yamada, T., Mende, D. R., Fernandes, G. R., Tap, J., Bruls, T., et al. (2011) · Nature · doi:10.1038/nature09944 · Cited by 7,548
Obesity alters gut microbial ecology
Ley, R. E., Bäckhed, F., Turnbaugh, P., Lozupone, C. A., Knight, R. D., & Gordon, J. I. (2005) · Proceedings of the National Academy of Sciences · doi:10.1073/pnas.0504978102 · Cited by 6,176
Bravo, J. A., Forsythe, P., Chew, M. V., Escaravage, E., Savignac, H. M., Dinan, T. G., Bienenstock, J., & Cryan, J. F. (2011) · Proceedings of the National Academy of Sciences · doi:10.1073/pnas.1102999108 · Cited by 3,888
Chimeric 16S rRNA sequence formation and detection in Sanger and 454-pyrosequenced PCR ampliconsPreprint
Haas, B. J., Gevers, D., Earl, A. M., Feldgarden, M., Ward, D. V., Giannoukos, G., Ciulla, D., Tabbaa, D., Highlander, S. K., Sodergren, E. J., et al. (2011) · Genome Research · doi:10.1101/gr.112730.110 · Cited by 3,527
PyNAST: a flexible tool for aligning sequences to a template alignment
Caporaso, J. G., Bittinger, K. L., Bushman, F. D., DeSantis, T. Z., Andersen, G. L., & Knight, R. D. (2009) · Bioinformatics · doi:10.1093/bioinformatics/btp636 · Cited by 3,449
The open field as a paradigm to measure the effects of drugs on anxiety-like behaviors: a review.
Prut, L., & Belzung, C. (2003) · European Journal of Pharmacology · doi:10.1016/s0014-2999(03)01272-x · Cited by 3,190
Sudo, N., Chida, Y., Aiba, Y., Sonoda, J., Oyama, N., Yu, X., Kubo, C., & Koga, Y. (2004) · The Journal of Physiology · doi:10.1113/jphysiol.2004.063388 · Cited by 2,735
An overview of the immune system
Parkin, J., & Cohen, B. (2001) · The Lancet · doi:10.1016/s0140-6736(00)04904-7 · Cited by 1,593
Research works printed but not linked: 2
- [21]Stub C, Sorensen DB, Jegstrup IM, Ritskes-Hoitinga M, Hansen AK (2002) Fluctuating asymmetry of teeth is not a reliable indicator for assessing stress in rats. Scandinavian Journal of Laboratory Animal Science 29: 149– 153.
- [37]Hansen CHF, Nielsen DS, Kverka M, Zakostelka Z, Klimesova K, et al. (2012) Customizing laboratory mice by modifying gut microbiota and immune system development in the early postnatal period. PLoS One (In Press).
Cited by
Sorted by citations
Items 201–299 of 299
Sharkey, K. A., & Savidge, T. (2014) · Autonomic Neuroscience · doi:10.1016/j.autneu.2014.03.004 · Cited by 11
Gut microbiota analysis and its significance in vasovagal syncope in children
Bai, W., Chen, S. Y., Tang, C., Qi, J., Cui, Q., Xu, M., Du, J., & Jin, H. (2019) · Chinese Medical Journal · doi:10.1097/cm9.0000000000000086 · Cited by 10
Effects of Vegetable and Fruit Juicing on Gut and Oral Microbiome Composition
Sardaro, M. L. S., Grote, V. E., Baik, J., Atallah, M., Amato, K. R., & Ring, M. R. (2025) · Nutrients · doi:10.3390/nu17030458 · Cited by 12
Fatimi, H. E., El‐Mansoury, B., Tinakoua, A., Ndayambaje, M., Zaid, Y., Khalki, H., & Khalki, L. (2025) · Pharmacological Reports · doi:10.1007/s43440-025-00759-w · Cited by 10
Wang, L., Zhang, Y., Guo, X., Gong, L., & Dong, B. (2022) · Frontiers in Microbiology · doi:10.3389/fmicb.2022.856634 · Cited by 10
DeRosa, H., Caradonna, S. G., Tran, H., Marrocco, J., & Kentner, A. C. (2022) · eNeuro · doi:10.1523/eneuro.0148-22.2022 · Cited by 10
Anxiety-like Behavior in Female Sprague Dawley Rats Associated with Cecal Clostridiales
Bear, T., Roy, N. C., Dalziel, J. E., Butts, C. A., Coad, J., Young, W., Parkar, S. G., HEDDERLEY, D. I., Dinnan, H., Martell, S., et al. (2023) · Microorganisms · doi:10.3390/microorganisms11071773 · Cited by 9
Microglia and Microbiome-Gut-Brain Axis
Filho, A. M. C., Gomes, N. S., Lós, D. B., Leite, I. B., Tremblay, M., & Macêdo, D. S. (2024) · Advances in neurobiology · doi:10.1007/978-3-031-55529-9_17 · Cited by 8
Dynamic human gut microbiome and immune shifts during an immersive psychosocial intervention program
Zhou, X., Ganz, A. B., Rayner, A., Cheng, T. Y., Oba, H., Rolnik, B. M., Lancaster, S. M., Lu, X., Li, Y., Johnson, J. S., et al. (2024) · Brain Behavior and Immunity · doi:10.1016/j.bbi.2024.12.027 · Cited by 11
Anisong, N., Siripongvutikorn, S., Puttarak, P., & Wichienchot, S. (2023) · Bioactive Carbohydrates and Dietary Fibre · doi:10.1016/j.bcdf.2023.100380 · Cited by 8
An Update on the Relationship Between the Gut Microbiome and Obsessive-Compulsive Disorder
Turna, J., Patterson, B. A., & Ameringen, M. V. (2017) · Psychiatric Annals · doi:10.3928/00485713-20171013-01 · Cited by 8
Zhao, J., Li, G., Lü, W., Huang, S., & Zhang, Z. (2019) · Microbial Ecology · doi:10.1007/s00248-019-01462-z · Cited by 8
Yang, Z., Yu, R., Deng, W., & Wang, W. (2022) · Frontiers in Genetics · doi:10.3389/fgene.2022.894900 · Cited by 8
Oliver, V. L., & Pang, D. (2022) · Veterinary Clinics of North America Exotic Animal Practice · doi:10.1016/j.cvex.2022.07.010 · Cited by 8
Dugyala, S., Ptacek, T., Simon, J. M., Li, Y., & Frӧhlich, F. (2020) · Animal Microbiome · doi:10.1186/s42523-020-00030-y · Cited by 7
Microbiota-Immune System Interactions in Human Neurological Disorders
Huang, Q., Fang, Y., Liao, D., & Xia, J. (2020) · CNS & Neurological Disorders - Drug Targets · doi:10.2174/1871527319666200726222138 · Cited by 7
Tang, J., Wang, Q., Yu, H., Dong, L., Tang, M., Arif, A., Zhang, G., Zhang, T., Xie, K., Su, S., et al. (2024) · Animals · doi:10.3390/ani14182709 · Cited by 7
Macrı̀, S. (2016) · Neurobiology of Stress · doi:10.1016/j.ynstr.2016.12.001 · Cited by 7
Zaparte, A., Doré, E., White, S., Paliarin, F., Gabriel, C., Copenhaver, K., Basavanhalli, S., Garcia, E., Vaddavalli, R., Luo, M., et al. (2024) · Frontiers in Neuroscience · doi:10.3389/fnins.2024.1383181 · Cited by 7
Tang, A., Chen, Y., Si, K., Lai, J., Gong, W., & Hu, S. (2025) · Molecular Psychiatry · doi:10.1038/s41380-025-03398-y · Cited by 7
Barbetti, M., Mancabelli, L., Vacondio, F., Longhi, G., Ferlenghi, F., Viglioli, M., Turroni, F., Carnevali, L., Mor, M., Ventura, M., et al. (2024) · Progress in Neuro-Psychopharmacology and Biological Psychiatry · doi:10.1016/j.pnpbp.2024.110963 · Cited by 6
Heterocyclic Antidepressants with Antimicrobial and Fungicide Activity
Zolotareva, D., Zazybin, A., Belyankova, Y., Bayazit, S., Dauletbakov, A., Сейлханов, Т. М., Kemelbekov, U., & Aydemir, M. (2025) · Molecules · doi:10.3390/molecules30051102 · Cited by 6
Merchán, A., Pérez-Fernández, C., López, M. J., Moreno, J., Moreno, M., Sánchez-Santed, F., & Flores, P. (2021) · Physiology & Behavior · doi:10.1016/j.physbeh.2021.113356 · Cited by 6
Psychobiotics: The Potential Therapeutic Promise of Microbes in Psychiatry
Sayar, G. H., & Çetin, M. (2016) · Klinik Psikofarmakoloji Bülteni-Bulletin of Clinical Psychopharmacology · doi:10.5455/bcp.20160531111208 · Cited by 6
Oral insulin does not alter gut microbiota composition of NOD mice
Kihl, P., Krych, Ł., Buschard, K., Wesley, J. D., Kot, W., Hansen, A. K., Nielsen, D. S., & von Herrath, M. G. (2018) · Diabetes/Metabolism Research and Reviews · doi:10.1002/dmrr.3010 · Cited by 6
Self-citationKihl, P., Krych, Ł., Deng, L., Hansen, L. H., Buschard, K., Skov, S., Nielsen, D. S., & Hansen, A. K. (2022) · PLoS ONE · doi:10.1371/journal.pone.0266719 · Cited by 6
Self-citationRole of gut microbiota and its functional products in prenatal alcohol-induced anxiety-like behavior
Wong, K. E., Luft, C., Vella, V. R., Ainsworth-Cruickshank, G., Wijesundara, K. K., Holman, P. J., Bodnar, T. S., & Raineki, C. (2025) · Progress in Neuro-Psychopharmacology and Biological Psychiatry · doi:10.1016/j.pnpbp.2025.111454 · Cited by 5
Letenneur, V., Monnoye, M., Philippe, C., Holowacz, S., Rabot, S., Lepage, P., Jacouton, E., & Naudon, L. (2023) · Nutrients · doi:10.3390/nu15214635 · Cited by 6
Exploring the gut microbiota-hippocampus-metabolites axis dysregulation in sepsis mice
Song, F., Li, Q., Cui, J., Wang, J., Xiao, S., Yu, B., Sun, Y., Song, W., Wu, L., & Yongqin, Z. (2024) · Frontiers in Microbiology · doi:10.3389/fmicb.2024.1302907 · Cited by 7
Chaiyasut, C., & Sivamaruthi, B. S. (2018) · IntechOpen eBooks · doi:10.5772/intechopen.79511 · Cited by 5
Depression and Microbiome—Study on the Relation and Contiguity between Dogs and Humans
Mondo, E., Cesare, A. D., Manfreda, G., Sala, C., Cascio, G., Accorsi, P. A., Marliani, G., & Cocchi, M. (2020) · Applied Sciences · doi:10.3390/app10020573 · Cited by 5
Gut microbiome as a therapeutic target in the treatment of depression and anxiety
Ab, K. (2021) · S S Korsakov Journal of Neurology and Psychiatry · doi:10.17116/jnevro2021121111129 · Cited by 5
Gao, W., Zhu, K., Zhang, X., Saren, G., Zhang, Y., Gan, J., Hou, S., & Gui, L. (2025) · Frontiers in Microbiology · doi:10.3389/fmicb.2025.1612170 · Cited by 4
Impact of Altered Gut Microbiota on Ketamine-Induced Conditioned Place Preference in Mice
Li, C., Zhu, C. Y., Tu, G., Chen, Z., Mo, Z., & Luo, C. (2024) · Neuropsychiatric Disease and Treatment · doi:10.2147/ndt.s476420 · Cited by 4
Rodent models for oral microbiome research: considerations and challenges- a mini review
Gopinath, D., Pandiar, D., Li, Z., & Panda, S. (2024) · Frontiers in Oral Health · doi:10.3389/froh.2024.1439091 · Cited by 7
Shalaginova, I. G., Matskova, L. V., Gunitseva, N. M., & Vakoliuk, I. A. (2019) · Ecological genetics · doi:10.17816/ecogen17491-102 · Cited by 4
Microbial Endocrinology in the Pathogenesis of Infectious Disease
Lyte, M. (2016) · ASM Press eBooks · doi:10.1128/9781555819286.ch6 · Cited by 4
The gut microbiota–brain axis and role of probiotics
Sound, R. (2020) · Elsevier eBooks · doi:10.1016/b978-0-12-820593-8.00013-6 · Cited by 4
Can some microbes promote host stress and benefit evolutionarily from this strategy?
Aktipis, A., & Beltrán, D. G. (2020) · BioEssays · doi:10.1002/bies.202000188 · Cited by 4
Gut microbiome composition is related to anxiety and aggression score in companion dogsPreprint
Pellowe, S. D., Zhang, A., Bignell, D. R. D., Peña‐Castillo, L., & Walsh, C. J. (2023) · Research Square · doi:10.21203/rs.3.rs-3424940/v1 · Cited by 4
Dynamic Human Gut Microbiome and Immune Shifts During an Immersive Psychosocial Therapeutic ProgramPreprint
Zhou, X., Ganz, A. B., Rayner, A., Cheng, T. Y., Oba, H., Rolnik, B. M., Lancaster, S. M., Lu, X., Li, Y., Johnson, J. S., et al. (2024) · bioRxiv (Cold Spring Harbor Laboratory) · doi:10.1101/2024.06.26.600881 · Cited by 4
Wang, L., Di, G., Guo, W., Zhu, Y., Zhang, M., Zhou, A., Chen, G., & Wu, W. (2024) · BMC Microbiology · doi:10.1186/s12866-024-03569-x · Cited by 3
Impact of the Gut Microbiome on Behavior and Emotions
Rivera‐Íñiguez, I., Román, S., Ojeda‐Granados, C., & Arturo, P. (2019) · Elsevier eBooks · doi:10.1016/b978-0-12-815249-2.00040-3 · Cited by 3
Effect of Early-life Gut Mucosal Compromise on Disease Progression in NOD Mice.
Bendtsen, K. M., Hansen, C. H. F., Krych, Ł., Buschard, K., Farlov, H., & Hansen, A. K. (2017) · PubMed Central · Cited by 3
Self-citationHasegawa, A., Sasaki, T., Islam, J., Tominaga, T., Nochi, T., Hara, K., & Tanemura, K. (2023) · The Journal of Toxicological Sciences · doi:10.2131/jts.48.149 · Cited by 3
Hair cortisol, cortisone and DHEA concentrations and the composition of microbiota in toddlers
Koskinen, M. K., Aatsinki, A., Kortesluoma, S., Mustonen, P., Munukka, E., Lukkarinen, M. M., Perasto, L., Keskitalo, A., Karlsson, H., & Karlsson, L. (2023) · Psychoneuroendocrinology · doi:10.1016/j.psyneuen.2023.106309 · Cited by 5
Prenatal folate deficiency impairs sociability and memory/recognition in mice offspring
Yoshikawa, M., & Suemaru, K. (2023) · Brain Research · doi:10.1016/j.brainres.2023.148639 · Cited by 3
Metabolomics and the Gut–Brain Axis
Caspani, G., Harvey, M., & Swann, J. R. (2024) · Elsevier eBooks · doi:10.1016/b978-0-323-99971-7.00003-5 · Cited by 3
Bermudez, C., Yao, H. L., Widaningrum, Williams, B. A., Flanagan, B. M., Gidley, M. J., & Mikkelsen, D. (2024) · Food & Function · doi:10.1039/d3fo03612j · Cited by 3
Modulation of Gut Microbiota by Cacao: Insights from an In Vitro Model
Kim, J., Jung, S., Kim, G., Kim, J., Son, B., & Shin, H. (2025) · Current Issues in Molecular Biology · doi:10.3390/cimb47060414 · Cited by 4
Psychobiotics and Brain-Gut Microbiota Axis
Taheri, S., & Khomeiri, M. (2019) · Iranian Journal of Medical Microbiology · doi:10.30699/ijmm.13.1.1 · Cited by 4
The Microbiome–Gut–Brain Axis and the Consequences of Infection and Dysbiosis
Bienenstock, J., Kunze, W., & Forsythe, P. (2016) · The American Journal of Gastroenterology Supplements · doi:10.1038/ajgsup.2016.12 · Cited by 4
Housing influences tissue cytokine levels and the fecal bacterial community structure in rats
Shastri, P., Green, J., Matias, F. M. G., Kalmokoff, M. L., Green-Johnson, J. M., & Brooks, S. P. J. (2017) · Journal of Functional Foods · doi:10.1016/j.jff.2017.10.021 · Cited by 3
Wardziukiewicz, W., & Stachowska, E. (2020) · Postępy Higieny i Medycyny Doświadczalnej · doi:10.5604/01.3001.0014.3416 · Cited by 3
Effects of ultrasound-induced stress on gut microbiota of mice
Chernukha, I. M., Vasilevskaya, E. R., Klimina, K. M., Yunes, R. А., Kupaeva, N. V., Сергеевна, Т. Г., Kibitkina, A. A., Даниленко, В. Н., Karabanov, S. Y., & Fedulova, L. (2023) · Veterinary World · doi:10.14202/vetworld.2023.929-938 · Cited by 2
Increased relative abundance of Alistipes and Sellimonas is related to stage 2 and 3 sleep duration
Sasaki, H., Masutomi, H., & Ishihara, K. (2025) · Frontiers in Sleep · doi:10.3389/frsle.2025.1478129 · Cited by 2
The microbiome-gut-brain axis: The missing link in depression
Foxx, C. L., & Lowry, C. A. (2019) · Elsevier eBooks · doi:10.1016/b978-0-12-815015-3.00011-8 · Cited by 2
Hansen, A. K. (2021) · Laboratory animal science and medicine · doi:10.1007/978-3-030-66147-2_4 · Cited by 2
Self-citationThe Response of Murine Gut Microbiome in the Presence of Altered rpoS Gene of Klebsiella pneumoniae
Iqbal, M., He, P., He, P., Wu, Y., Munir, S., & He, Y. (2024) · International Journal of Molecular Sciences · doi:10.3390/ijms25179222 · Cited by 3
Effect of phosphorus and potassium application on growth, yield and quality of kinnow mandarin.
Dudi, O. P., Singh, R., Singh, S., & Baloda, S. (2007) · Haryana journal of horticultural sciences · Cited by 2
Probiotics Suppress the Depression: A Look at the Possible Mechanisms of Action
Khalili, L., & Sayyed, R. Z. (2022) · Springer eBooks · doi:10.1007/978-981-16-1626-6_15 · Cited by 2
Yang, Y., Feng, H., Wang, Z., Wu, R., Zheng, Y., & Wu, X. (2026) · Frontiers in Microbiology · doi:10.3389/fmicb.2025.1675240 · Cited by 1
The effect of having Christmas dinner with in-laws on gut microbiota composition
de Clercq, N. C., Frissen, M. N., Levin, E., Davids, M., Hartman, J., Prodan, A., Herrema, H., Groen, A. K., Romijn, J. A., & Nieuwdorp, M. (2019) · Human Microbiome Journal · doi:10.1016/j.humic.2019.100058 · Cited by 1
Sariyati, N. H., Othman, N., Abdullah‐Fauzi, N. A. F., Chan, E., Md‐Zain, B. M., Karuppannan, K. V., & Abdul‐Latiff, M. A. B. (2024) · Journal of Medical Primatology · doi:10.1111/jmp.12730 · Cited by 1
Low‐gainer diet‐induced obese microbiota transplanted mice exhibit increased fighting
Mentzel, C. M. J., Yan, H., Hammerich, T. M. S., Klug‐Dambmann, M., Liu, Y., Zachariassen, L. F., Hansen, L. H., Aslampaloglou, A., Kiersgaard, M. K., Nielsen, D. S., et al. (2024) · Clinical and Translational Science · doi:10.1111/cts.13906 · Cited by 1
Self-citationMicrobiome-Based Therapies for Mental Health Disorders
Maqsood, Q., Aman, M., Hussain, N., Saleem, M., & Mahnoor, M. (2024) · Springer eBooks · doi:10.1007/978-981-97-3790-1_15 · Cited by 1
Psychobiotics: A Newer Approach Toward the Treatment of Neurodevelopmental Disorders
Chakraborty, T., Begum, J., Mandal, D., & Sengupta, A. (2021) · Elsevier eBooks · doi:10.1016/b978-0-12-822909-5.00013-7 · Cited by 1
Hahn, M. A., Piecyk, A., Jorge, F., Cerrato, R. M., Kalbe, M., & Dheilly, N. M. (2021) · Research Square · doi:10.21203/rs.3.rs-323107/v1 · Cited by 1
Microplastic Exposure Across Trophic Levels: Effects on the Host Microbiota of Freshwater OrganismsPreprint
Varg, J. E., Outomuro, D., Kunce, W., Kuehrer, L., Svanbäck, R., & Johansson, F. (2021) · Research Square · doi:10.21203/rs.3.rs-515763/v1 · Cited by 1
Microplastic Exposure Across Trophic Levels: Effects on the Host-microbiota of Freshwater OrganismsPreprint
Varg, J. E., Outomuro, D., Kunce, W., Kuehrer, L., Svanbäck, R., & Johansson, F. (2022) · Research Square · doi:10.21203/rs.3.rs-515763/v2 · Cited by 1
A microbial signature of psychological distress in Irritable Bowel Syndrome
Moser, G. (2017) · doi:10.26226/morressier.59a6b34cd462b80290b55aef · Cited by 1
Lyte, M. (2015) · eCommons (Cornell University)
Master BIOLOGIE, AGRONOMIE, SANTE Spécialité Sciences de l'animal pour l'élevage de demain (SAED)
Cedex, R., & Leclerc, G. (2013)
Parental and Early Developmental Stress Impact on Neurodevelopmental and Neuropsychiatric Disorders
Nugent, B. M., Chan, J. C., Jašarević, E., & Bale, T. L. (2016) · Elsevier eBooks · doi:10.1016/b978-0-12-803592-4.00097-3
Nørgaard, S., Sand, F. W., Sørensen, D. B., & Søndergaard, H. (2020) · Animal Welfare · doi:10.7120/09627286.29.2.143
Self-citationARE THEY ALSO MIND COLONIZERS? EXPLORING THE ASSOCIATION BETWEEN GUT MICROBIOTA AND DEPRESSION
Ayeni, F. A., & Fadeyi, T. E. (2020) · FUDMA Journal of Sciences · doi:10.33003/fjs-2020-0402-24
Narkevich, I. A. (2023) · Sel skokhozyaistvennaya Biologiya · doi:10.15389/agrobiology.2022.6.1117eng
РФ, Ф. В. С.-П. Г. Х.-Ф. У. М., & НАРКЕВИЧ, И. А. (2023) · Sel skokhozyaistvennaya Biologiya · doi:10.15389/agrobiology.2022.6.1117rus
Prospects of using biologically active substances to prevent depression
Nadtochii, L. A., Baranenko, D., Proskura, A., Muradova, M., Sao, D., & Bogueva, D. (2023) · Elsevier eBooks · doi:10.1016/b978-0-323-85615-7.00013-6
Pain assessment in laboratory species
Whittaker, A. L., & Brown, C. (2023) · Elsevier eBooks · doi:10.1016/b978-0-12-822215-7.00019-6
Phenylketonuria in a microbial world
van der Goot, E. (2023) · University of Groningen research database (University of Groningen / Centre for Information Technology) · doi:10.33612/diss.678170132
Cui, X., Wang, H., Zhang, H., & Zhang, H. (2026) · Medicine · doi:10.1097/md.0000000000049955
Piccoli, E., Vanzetto, S., Cerolini, L., Conti, D., Celebre, L., & Dell’Osso, B. M. (2024) · Cambridge University Press eBooks · doi:10.1017/9781009067287.019 · Cited by 1
Microbiota influence behavior—Work in animal models
Foster, J. A., & Clarke, G. A. (2024) · Elsevier eBooks · doi:10.1016/b978-0-12-814800-6.00002-9
Kamimura, I., Miyauchi, E., Takeuchi, T., Tsuchiya, N., Tamura, K., Uesugi, A., Negishi, H., Taida, T., Kato, T., Kawasumi, M., et al. (2024) · Research Square · doi:10.21203/rs.3.rs-4060437/v1
The Role of the Immune System in Creating Depression, Post-traumatic-Stress-Disorder, and Psychosis
Littrell, J. L. (2024) · Integrated science · doi:10.1007/978-3-031-72079-6_2
Effect of PEGylated Liposomalization of Oxaliplatin on the Gut Microbiota in Mice
Mogi, K., Morimoto, H., Yasukawa, T., Uozumi, Y., Ishida, T., & Nagasawa, K. (2025) · Biological and Pharmaceutical Bulletin · doi:10.1248/bpb.b25-00578
Dugyala, S., Ptacek, T., Simon, J. M., Li, Y., & Frӧhlich, F. (2020) · Figshare · doi:10.6084/m9.figshare.12258065
Mokrani, M., Charradi, K., Limam, F., Aouani, E., & Urdaci, M. C. (2022) · Figshare · doi:10.6084/m9.figshare.20252711
Mokrani, M., Charradi, K., Limam, F., Aouani, E., & Urdaci, M. C. (2022) · Figshare · doi:10.6084/m9.figshare.20252714
Przerwa, J. (2025) · International Journal of Innovative Technologies in Social Science · doi:10.31435/ijitss.4(48).2025.4431 · Cited by 1
Yin, X., Zeng, J., Li, Z., Chen, S., Xie, C., Li, X., Zhang, L., Pan, Y., & An, J. (2026) · Frontiers in Microbiology · doi:10.3389/fmicb.2026.1762563 · Cited by 1
Pathological Remuneration of Oxidative Stress in Limiting Gut-Brain Axis
Kumar, R., Kashyap, A., & Naqvi, S. (2026) · Oxidative stress in applied basic research and clinical practice · doi:10.1007/978-3-032-19837-2_5
Dönmez, E., Okur, D. Ş., Özsoy, A. U., Şenol, H., & Yüksel, S. (2026) · Frontiers in Medicine · doi:10.3389/fmed.2026.1877706
Chen, P., Lv, J., & Li, Q. (2026) · Natural Product Communications · doi:10.1177/1934578x261471134
Wetz, S., Dadsena, R., Treichel, N. S., Costa, A. S., Hofmann, A., Romanzetti, S., Clavel, T., Reetz, K., & Walders, J. (2026) · Comprehensive physiology · doi:10.1002/cph4.70261
Wang, H.-X., & Wang, Y.-P. (2016) · Chinese Medical Journal · doi:10.4103/0366-6999.190667 · Cited by 546
Metadata
- Authors
- Bangsgaard Bendtsen, K. M., Krych, L., Sørensen, D. B., Pang, W., Nielsen, D. S., Josefsen, K., Hansen, L. H., Sørensen, S. J., & Hansen, A. K.
- Affiliations
- University of Copenhagen (DK)
- Rigshospitalet (DK)
- ORCID
- Venue
- PLoS ONE
- Publisher
- Public Library of Science (PLoS)
- Published
- 2012-10-02
- Volume
- 7
- Issue
- 10
- Pages
- e46231
- ISSN
- 1932-6203 (ISSN-L)
- PMC
- PMC3462757
- OpenAlex
- W2041032345
- Cited by
- 299
- References
- 69
- Citations by year
- 2026: 7 · 2025: 13 · 2024: 29 · 2023: 26 · 2022: 35 · 2021: 25 · 2020: 32 · 2019: 30 · 2018: 16 · 2017: 17 · 2016: 17 · 2015: 23 · 2014: 18 · 2013: 10
- FWCI
- 6.55
- Type
- journal article
- Language
- en
- Open access
- gold
- doi.org
- Locations
- PLoS ONE (publishedVersion, cc-by)
- PubMed Central (publishedVersion, cc-by)
- PubMed (publishedVersion)
- Research at the University of Copenhagen (University of Copenhagen) (submittedVersion, cc-by)
- DOAJ (DOAJ: Directory of Open Access Journals) (submittedVersion, cc-by-sa)
- Figshare (submittedVersion, cc-by)
- Funders
- Villum Fonden
- Copenhagen Graduate School for Nanoscience and Nanotechnology
- Topics
- Life Sciences › Biochemistry, Genetics and Molecular Biology › Molecular Biology › Gut microbiota and health
- Health Sciences › Medicine › Gastroenterology › Gastrointestinal motility and disorders
- Life Sciences › Neuroscience › Behavioral Neuroscience › Stress Responses and Cortisol
- Keywords
- gut microbiota, housing stress, anxiety-like behavior, cecal microbiota, cytokines, blood glucose, HbA1c, elevated plus maze, light-dark box, open field, tail suspension test, burrowing behavior, Odoribacter, Alistipes, Coriobacteriaceae, Firmicutes, Ruminococcaceae, Lachnospiraceae, BALB/c mice
- MeSH terms
- Animals, Behavior, Animal, Blood Glucose, Female, Hemoglobins, Intestines, Mice, Inbred BALB C, RNA, Ribosomal, 16S, Stress, Physiological, Cytokines, Maze Learning, Mice, Metagenome
About these checks
Registry, retraction, Cites and statistics results are computed, not judged, with one exception: a printed reference that no index lists is read once by a model before it counts as a citation error. Claims are extracted by a model and kept only when their quote appears verbatim in the text; each cited source is then checked, with a model’s help, for whether it says what the claim relies on. Those verdicts can be wrong — read the claim’s quote and the cited source before relying on one.
Statistics and arithmetic are recomputed, not judged.
Confidence bands are shown only for fields calibrated on our annotated test set. None is calibrated yet, so no band is shown.
What counts as a claim ›How we measure confidence ›How we check this ›
Are you an author, or do you see a problem with this page? Request a review
