

The DOI matches its Crossref record; 65 of the 65 references it cites were found in a registry or an index.
The Distribution of Macrophages with a M1 or M2 Phenotype in Relation to Prognosis and the Molecular Characteristics of Colorectal Cancer
Abstract
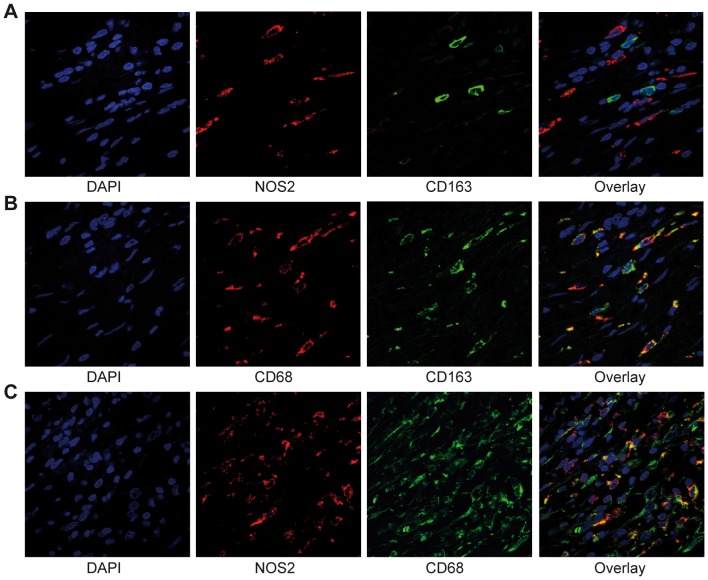
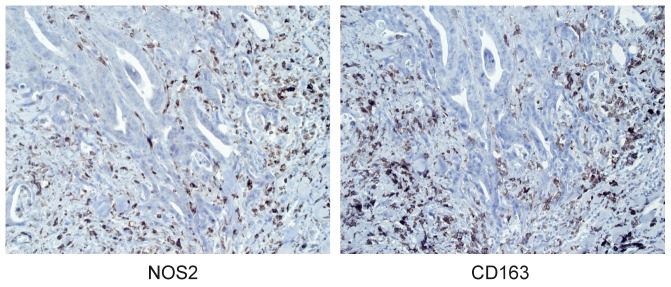
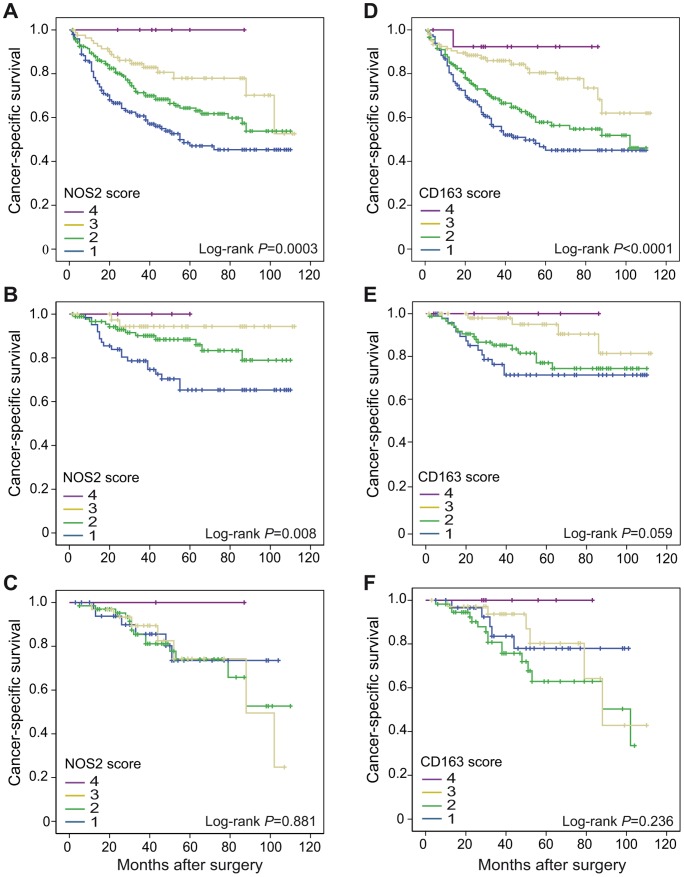
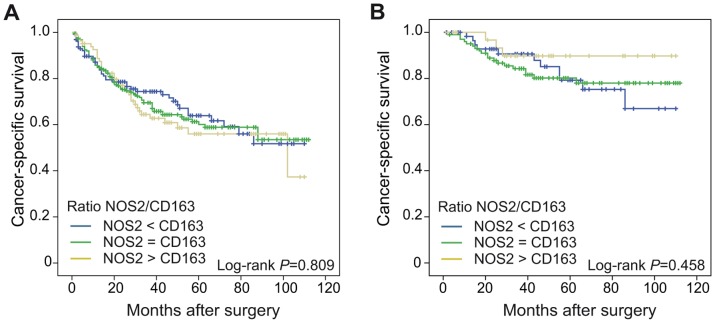
High macrophage infiltration has been correlated to improved survival in colorectal cancer (CRC). Tumor associated macrophages (TAMs) play complex roles in tumorigenesis since they are believed to hold both tumor preventing (M1 macrophages) and tumor promoting (M2 macrophages) activities. Here we have applied an immunohistochemical approach to determine the degree of infiltrating macrophages with a M1 or M2 phenotype in clinical specimens of CRC in relation to prognosis, both in CRC in general but also in subgroups of CRC defined by microsatellite instability (MSI) screening status and the CpG island methylator phenotype (CIMP). A total of 485 consecutive CRC specimens were stained for nitric oxide synthase 2 (NOS2) (also denoted iNOS) as a marker for the M1 macrophage phenotype and the scavenger receptor CD163 as a marker for the M2 macrophage phenotype. The average infiltration of NOS2 and CD163 expressing macrophages along the invasive tumor front was semi-quantitatively evaluated using a four-graded scale. Two subtypes of macrophages, displaying M1 (NOS2(+)) or M2 (CD163(+)) phenotypes, were recognized. We observed a significant correlation between the amount of NOS2(+) and CD163(+) cells (P<0.0001). A strong inverse correlation to tumor stage was found for both NOS2 (P<0.0001) and CD163 (P<0.0001) infiltration. Furthermore, patients harbouring tumors highly infiltrated by NOS2(+) cells had a significantly better prognosis than those infiltrated by few NOS2(+) cells, and this was found to be independent of MSI screening status and CIMP status. No significant difference was found on cancer-specific survival in groups of CRC with different NOS2/CD163 ratios. In conclusion, an increased infiltration of macrophages with a M1 phenotype at the tumor front is accompanied by a concomitant increase in macrophages with a M2 phenotype, and in a stage dependent manner correlated to a better prognosis in patients with CRC.
Overview
The claims and statistics of this paper haven’t been checked yet.
Run the check — free, no account needed. It reads the open-access text and checks the sources it cites.
Integrity signals
Registry
Cites
Statistics
Figures
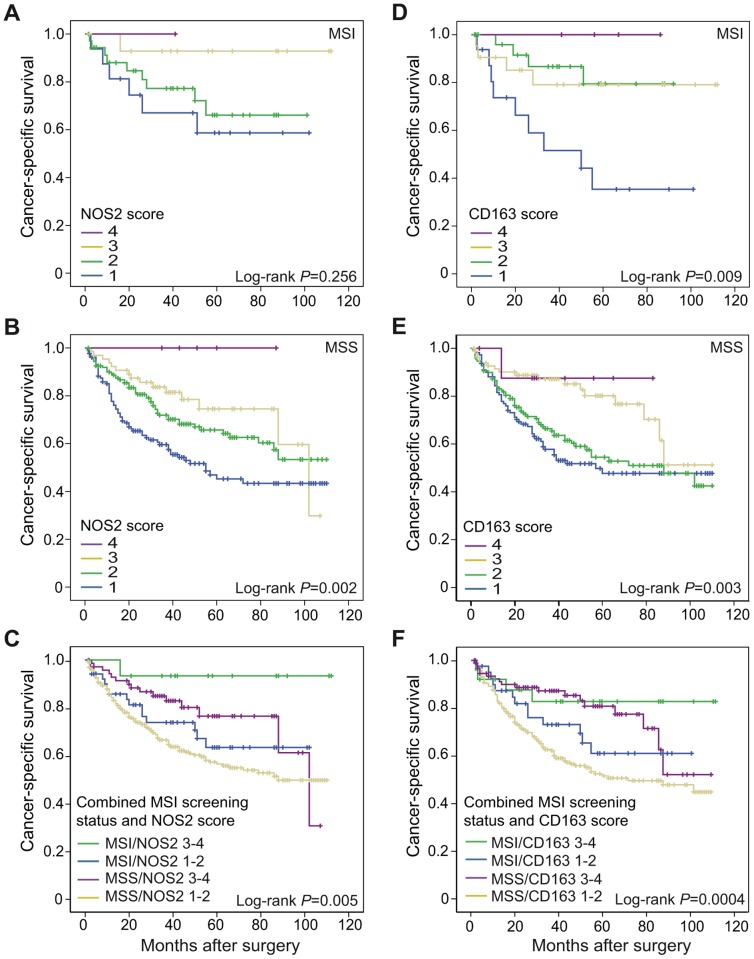
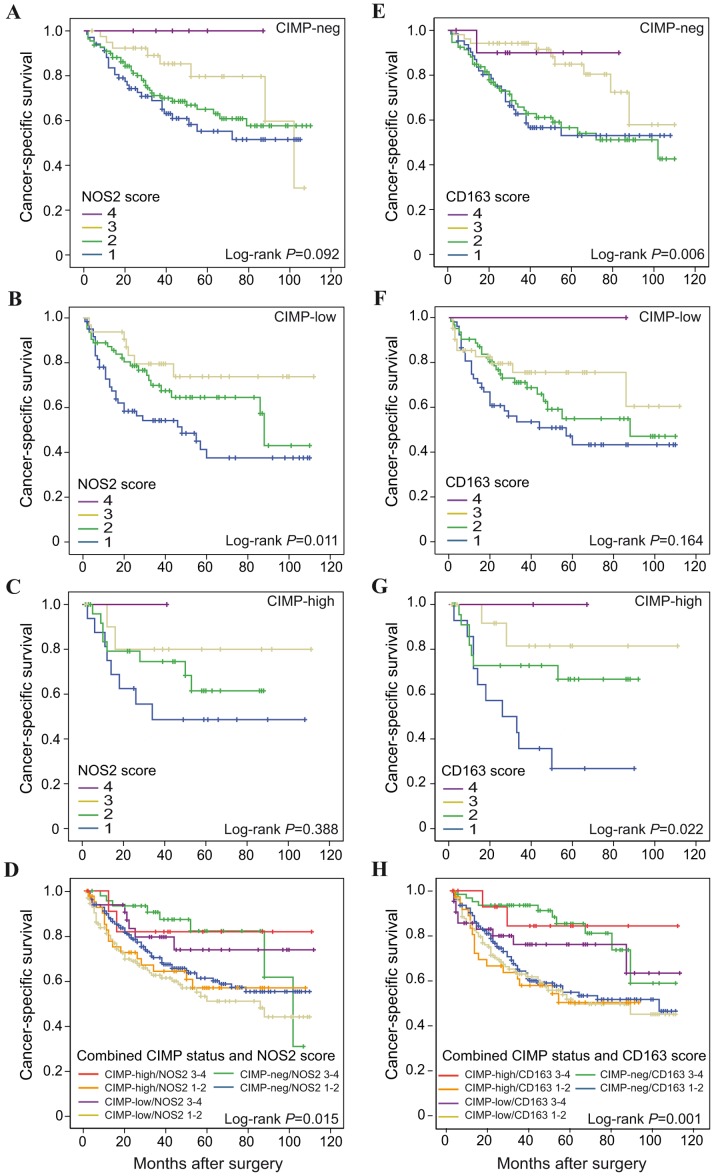
Verification
Claims the paper makes
The claims and statistics of this paper haven’t been checked yet.
Run the check — free, no account needed. It reads the open-access text and checks the sources it cites.
Claims other papers make about this one
Each is checked against this paper’s own text: does it say what the citing paper says it does?
The source backs part of the claim, not all of it — or backs it for a different population, condition or comparison.
In the citing paper
“However, observations obtained from macrophages involved in chronic inflammation, chronic infection, or cancer strongly suggest that the myeloid compartment has a much broader transcriptional repertoire depending on the different environmental signals received”
From Transcriptome-Based Network Analysis Reveals a Spectrum Model of Human Macrophage Activation (2014) · cites this paper as Edin et al., 2012
Experimental — accuracy not yet measured
Self-check
Percentages, sums and reported differences re-computed from the paper’s own numbers.
The self-check needs the paper’s full text.
Citations
Cites
Mantovani, A., Allavena, P., Sica, A., & Balkwill, F. (2008) · Nature · doi:10.1038/nature07205 · Cited by 11,399
Exploring the full spectrum of macrophage activation
Mosser, D. M., & Edwards, J. P. (2008) · Nature Reviews Immunology · doi:10.1038/nri2448 · Cited by 9,144
Macrophage Diversity Enhances Tumor Progression and Metastasis
Qian, B.-Z., & Pollard, J. W. (2010) · Cell · doi:10.1016/j.cell.2010.03.014 · Cited by 5,188
The immune contexture in human tumours: impact on clinical outcome
Fridman, W. H., Pagès, F., Sautès-Fridman, C., & Galon, J. (2012) · Nature reviews. Cancer · doi:10.1038/nrc3245 · Cited by 4,981
Cancer-related inflammation, the seventh hallmark of cancer: links to genetic instability
Colotta, F., Allavena, P., Sica, A., Garlanda, C., & Mantovani, A. (2009) · Carcinogenesis · doi:10.1093/carcin/bgp127 · Cited by 2,890
CpG island methylator phenotype in colorectal cancer
Toyota, M., Ahuja, N., Ohe-Toyota, M., Herman, J. G., Baylin, S. B., & Issa, J.-P. J. (1999) · Proceedings of the National Academy of Sciences · doi:10.1073/pnas.96.15.8681 · Cited by 2,523
Weisenberger, D. J., Siegmund, K. D., Campan, M., Young, J., Long, T. I., Faasse, M. A., Kang, G. H., Widschwendter, M., Weener, D., Buchanan, D., et al. (2006) · Nature Genetics · doi:10.1038/ng1834 · Cited by 1,990
Systematic Review of Microsatellite Instability and Colorectal Cancer Prognosis
Popat, S., Hubner, R., & Houlston, R. S. (2005) · Journal of Clinical Oncology · doi:10.1200/jco.2005.01.086 · Cited by 1,830
Sica, A., Schioppa, T., Mantovani, A., & Allavena, P. (2006) · European Journal of Cancer · doi:10.1016/j.ejca.2006.01.003 · Cited by 1,451
Tumor-associated macrophages (TAM) as major players of the cancer-related inflammation
Solinas, G., Germano, G., Mantovani, A., & Allavena, P. (2009) · Journal of Leukocyte Biology · doi:10.1189/jlb.0609385 · Cited by 1,425
Cited by
Transcriptome-Based Network Analysis Reveals a Spectrum Model of Human Macrophage Activation
Xue, J., Schmidt, S. V., Sander, J., Draffehn, A., Krebs, W., Quester, I., De Nardo, D., Gohel, T. D., Emde, M., Schmidleithner, L., et al. (2014) · Immunity · doi:10.1016/j.immuni.2014.01.006 · Cited by 2,210
Macrophages and Therapeutic Resistance in Cancer
Ruffell, B., & Coussens, L. M. (2015) · Cancer Cell · doi:10.1016/j.ccell.2015.02.015 · Cited by 1,474
Metabolism of tissue macrophages in homeostasis and pathology
Wculek, S. K., Dunphy, G., Heras-Murillo, I., Mastrangelo, A., & Sancho, D. (2022) · Cellular & Molecular Immunology · doi:10.1038/s41423-021-00791-9 · Cited by 501
Wang, H., Tian, T., & Zhang, J. (2021) · International Journal of Molecular Sciences · doi:10.3390/ijms22168470 · Cited by 364
Yin, Y., Yao, S., Hu, Y., Feng, Y., Li, M., Bian, Z., Zhang, J., Qin, Y., Qi, X., Zhou, L., et al. (2017) · Clinical Cancer Research · doi:10.1158/1078-0432.ccr-17-1283 · Cited by 296
Metadata
- Authors
- Edin, S., Wikberg, M. L., Dahlin, A. M., Rutegård, J., Öberg, Å., Oldenborg, P.-A., & Palmqvist, R.
- Venue
- PLoS ONE
- Publisher
- Public Library of Science (PLoS)
- Published
- 2012-10-15
- Volume
- 7
- Issue
- 10
- Pages
- e47045
- ISSN
- 1932-6203
- PMC
- PMC3471949
- Cited by
- 454
- References
- 65
- Language
- en
About these checks
Registry, retraction, Cites and statistics results are computed, not judged, with one exception: a printed reference that no index lists is read once by a model before it counts as a citation error. Claims are extracted by a model and kept only when their quote appears verbatim in the text; each cited source is then checked, with a model’s help, for whether it says what the claim relies on. Those verdicts can be wrong — read the claim’s quote and the cited source before relying on one.
Statistics and arithmetic are recomputed, not judged.
Confidence bands are shown only for fields calibrated on our annotated test set. None is calibrated yet, so no band is shown.
What counts as a claim ›How we measure confidence ›How we check this ›
Are you an author, or do you see a problem with this page? Request a review
How to cite
Cite CoChat for the checks on this page, and the paper for its own findings.
- This page
- CoChat. (2026). Citation check: The Distribution of Macrophages with a M1 or M2 Phenotype in Relation to Prognosis and the Molecular Characteristics of Colorectal Cancer. https://app.cochat.ai/papers/10.1371/journal.pone.0047045
- The paper
- Edin, S., Wikberg, M. L., Dahlin, A. M., Rutegård, J., Öberg, Å., Oldenborg, P.-A., & Palmqvist, R. (2012). The Distribution of Macrophages with a M1 or M2 Phenotype in Relation to Prognosis and the Molecular Characteristics of Colorectal Cancer. PLoS ONE. https://doi.org/10.1371/journal.pone.0047045
Data sources
Bibliographic data: Semantic Scholar, OpenAlex, Crossref.
Contains information from the Semantic Scholar Academic Graph Datasets, made available under the ODC Attribution License (ODC-BY 1.0).
Semantic Scholar’s data is described in: Kinney, R., et al. (2023). The Semantic Scholar Open Data Platform. arXiv:2301.10140.
