

The DOI matches its Crossref record; 66 of the 67 references it cites were found in a registry or an index.
Early Activation of Rat Skeletal Muscle IL-6/STAT1/STAT3 Dependent Gene Expression in Resistance Exercise Linked to Hypertrophy
Open accessAbstract
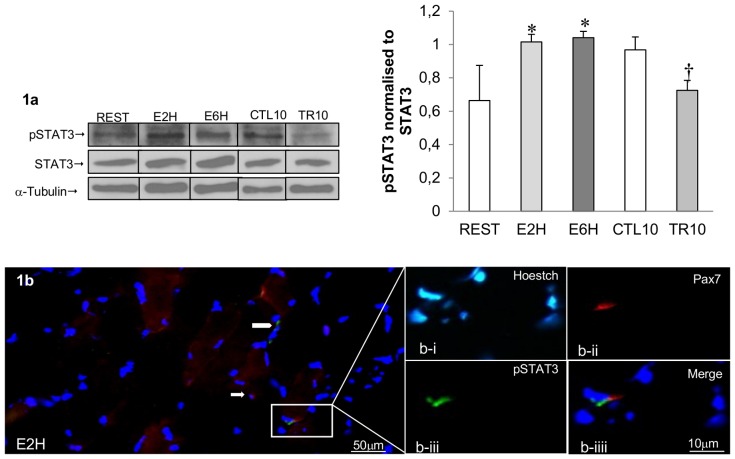
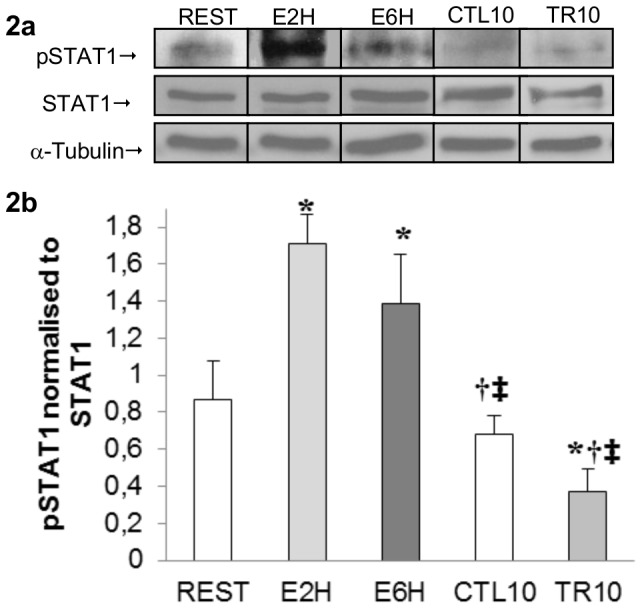
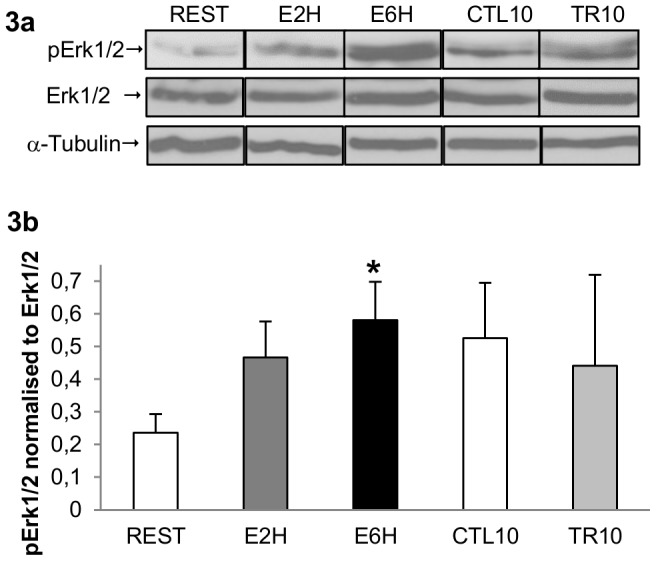
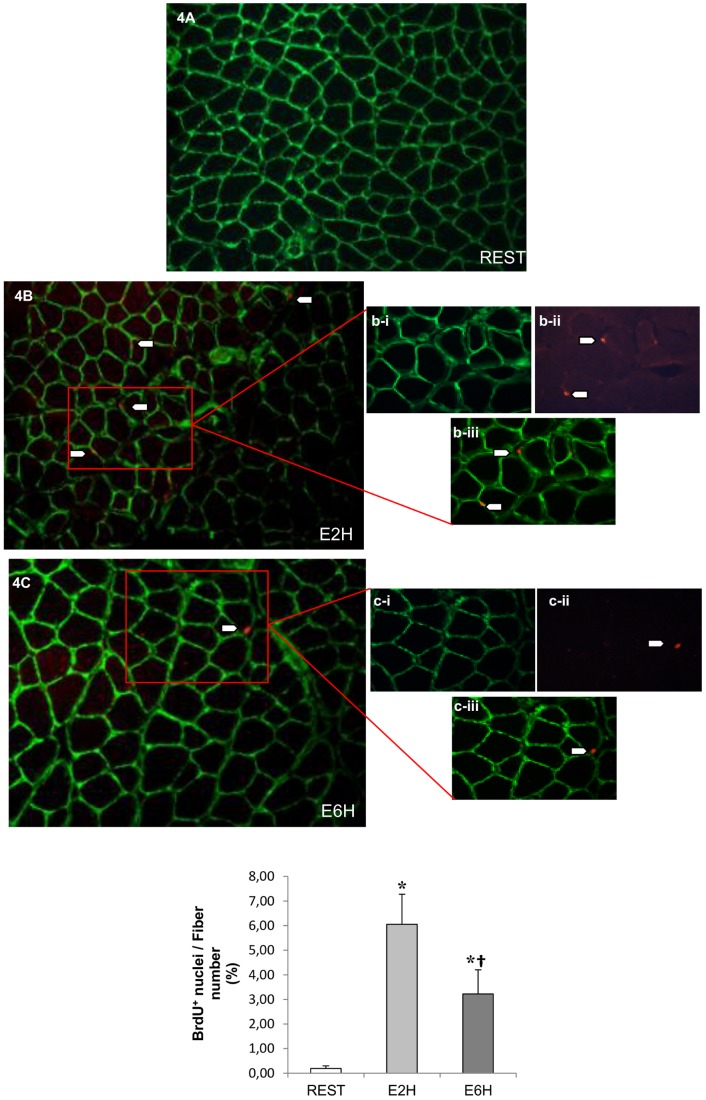
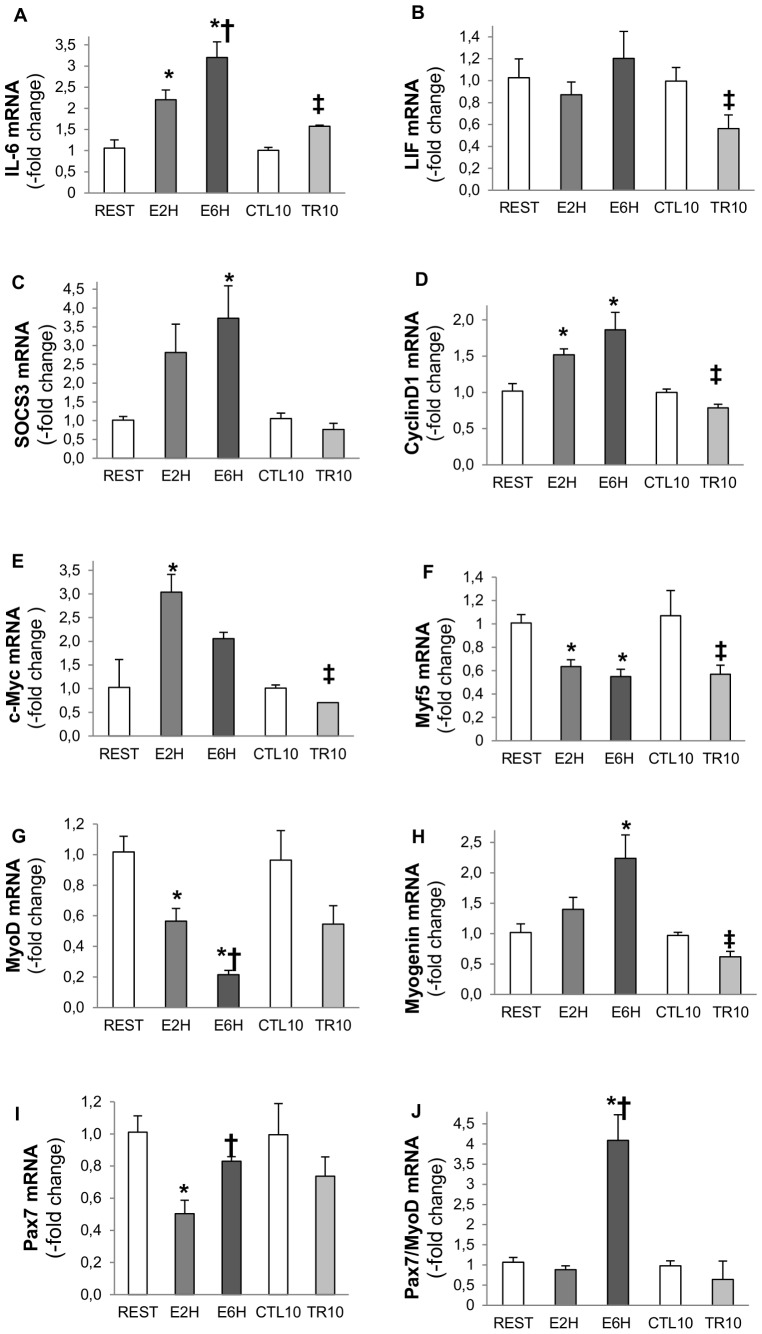
Cytokine interleukin-6 (IL-6) is an essential regulator of satellite cell-mediated hypertrophic muscle growth through the transcription factor signal transducer and activator of transcription 3 (STAT3). The importance of this pathway linked to the modulation of myogenic regulatory factors expression in rat skeletal muscle undergoing hypertrophy following resistance exercise, has not been investigated. In this study, the phosphorylation and nuclear localization of STAT3, together with IL-6/STAT3-responsive gene expression, were measured after both a single bout of resistance exercise and 10 weeks of training. Flexor Digitorum Profundus muscle samples from Wistar rats were obtained 2 and 6 hours after a single bout of resistance exercise and 72 h after the last bout of either 2, 4, or 10 weeks of resistance training. We observed an increase in IL-6 and SOCS3 mRNAs concomitant with phosphorylation of STAT1 and STAT3 after 2 and 6 hours of a single bout of exercise (p<0.05). STAT3-dependent early responsive genes such as CyclinD1 and cMyc were also upregulated whereas MyoD and Myf5 mRNAs were downregulated (p<0.05). BrdU-positive satellite cells increased at 2 and 6 hours after exercise (p<0.05). Muscle fiber hypertrophy reached up to 100% after 10 weeks of training and the mRNA expression of Myf5, c-Myc and Cyclin-D1 decreased, whereas IL-6 mRNA remained upregulated. We conclude that the IL-6/STAT1/STAT3 signaling pathway and its responsive genes after a single bout of resistance exercise are an important event regulating the SC pool and behavior involved in muscle hypertrophy after ten weeks of training in rat skeletal muscle.
Overview
The claims and statistics of this paper haven’t been checked yet.
Run the check — free, no account needed. It reads the open-access text and checks the sources it cites.
Integrity signals
Registry
Cites
Statistics
Figures
Verification
Claims the paper makes
The claims and statistics of this paper haven’t been checked yet.
Run the check — free, no account needed. It reads the open-access text and checks the sources it cites.
Claims other papers make about this one
Each is checked against this paper’s own text: does it say what the citing paper says it does?
The source backs part of the claim, not all of it — or backs it for a different population, condition or comparison.
In the citing paper
“However, in a previous study that used rats of the same age and weight, we showed that the non-exercised control group had a mean FDP CSA value of 1440 ± 84 μm2 [14], which is notably lower than the value of 2291 ± 182 μm2 of the present trained control group.”
From Acute and chronic effects of Rhaponticum carthamoides and Rhodiola rosea extracts supplementation coupled to resistance exercise on muscle protein synthesis and mechanical power in rats (2020) · cites this paper as [14]
Experimental — accuracy not yet measuredThe source backs part of the claim, not all of it — or backs it for a different population, condition or comparison.
In the citing paper
“We used a rat model of resistance exercise known to increase MPS [14].”
From Acute and chronic effects of Rhaponticum carthamoides and Rhodiola rosea extracts supplementation coupled to resistance exercise on muscle protein synthesis and mechanical power in rats (2020) · cites this paper as [14]
Experimental — accuracy not yet measured
Self-check
Percentages, sums and reported differences re-computed from the paper’s own numbers.
The self-check needs the paper’s full text.
Citations
Cites
1 retracted
Immunohistochemical detection of interleukin‐6 in human skeletal muscle fibers following exercise
Penkowa, M., Keller, C., Keller, P., Jauffred, S., & Pedersen, B. K. (2003) · The FASEB Journal · doi:10.1096/fj.03-0311fje · Cited by 157
RetractedA new mathematical model for relative quantification in real-time RT-PCR
Pfaffl, M. W. (2001) · Nucleic Acids Research · doi:10.1093/nar/29.9.e45 · Cited by 34,610
SATELLITE CELL OF SKELETAL MUSCLE FIBERS
Mauro, A. (1961) · The Journal of Cell Biology · doi:10.1083/jcb.9.2.493 · Cited by 3,683
Muscle as an Endocrine Organ: Focus on Muscle-Derived Interleukin-6
Pedersen, B. K., & Febbraio, M. A. (2008) · Physiological Reviews · doi:10.1152/physrev.90100.2007 · Cited by 2,388
The JAK/STAT signaling pathway
Rawlings, J. S., Rosler, K. M., & Harrison, D. A. (2004) · Journal of Cell Science · doi:10.1242/jcs.00963 · Cited by 1,858
Interleukin-6 in Biology and Medicine
Akira, S., Taga, T., & Kishimoto, T. (1993) · Advances in immunology · doi:10.1016/s0065-2776(08)60532-5 · Cited by 1,402
O’Shea, J. J., Gadina, M., & Schreiber, R. D. (2002) · Cell · doi:10.1016/s0092-8674(02)00701-8 · Cited by 1,137
IL-6 enhances plasma IL-1ra, IL-10, and cortisol in humans
Steensberg, A., Fischer, C. P., Keller, C., Møller, K., & Pedersen, B. K. (2003) · American Journal of Physiology-Endocrinology and Metabolism · doi:10.1152/ajpendo.00074.2003 · Cited by 1,135
Mixed muscle protein synthesis and breakdown after resistance exercise in humans
Phillips, S. M., Tipton, K. D., Aarsland, A., Wolf, S. E., & Wolfe, R. R. (1997) · American Journal of Physiology-Endocrinology and Metabolism · doi:10.1152/ajpendo.1997.273.1.e99 · Cited by 1,132
Campos, G., Luecke, T., Wendeln, H., Toma, K., Hagerman, F., Murray, T., Ragg, K., Ratamess, N., Kraemer, W., & Staron, R. (2002) · European Journal of Applied Physiology · doi:10.1007/s00421-002-0681-6 · Cited by 1,066
Cited by
Sorted by citations
Bilski, J., Pierzchalski, P., Szczepanik, M., Bonior, J., & Zoladz, J. A. (2022) · Cells · doi:10.3390/cells11010160 · Cited by 271
Rupert, J. E., Narasimhan, A., Jengelley, D. H. A., Jiang, Y., Liu, J., Au, E. D., Silverman, L. M., Sandusky, G. E., Bonetto, A., Cao, S., et al. (2021) · The Journal of Experimental Medicine · doi:10.1084/jem.20190450 · Cited by 225
Role of interleukin-6 in cachexia
Narsale, A. A., & Carson, J. A. (2014) · Current Opinion in Supportive and Palliative Care · doi:10.1097/spc.0000000000000091 · Cited by 205
Brett, J. O., Arjona, M., Ikeda, M., Quarta, M., de Morrée, A., Egner, I. M., Perandini, L. A., Ishak, H. D., Goshayeshi, A., Benjamin, D. I., et al. (2020) · Nature Metabolism · doi:10.1038/s42255-020-0190-0 · Cited by 162
Farup, J., Madaro, L., Puri, P., & Mikkelsen, U. R. (2015) · Cell Death and Disease · doi:10.1038/cddis.2015.198 · Cited by 162
The JAK/STAT Pathway in Skeletal Muscle Pathophysiology
Moresi, V., Adamo, S., & Berghella, L. (2019) · Frontiers in Physiology · doi:10.3389/fphys.2019.00500 · Cited by 145
Turner, D. C., Seaborne, R. A. E., & Sharples, A. P. (2019) · Scientific Reports · doi:10.1038/s41598-019-40787-0 · Cited by 135
Satellite cells in ageing: use it or lose it
Chen, W., Datzkiw, D., & Rudnicki, M. A. (2020) · Open Biology · doi:10.1098/rsob.200048 · Cited by 122
Short‐term disuse promotes fatty acid infiltration into skeletal muscle
Pagano, A. F., Brioche, T., Arc-Chagnaud, C., Demangel, R., Chopard, A., & Py, G. (2017) · Journal of Cachexia, Sarcopenia and Muscle · doi:10.1002/jcsm.12259 · Cited by 99
Self-citationAdvances and Challenges in Cell Biology for Cultured Meat
Martins, B., Bister, A., Dohmen, R. G. J., Gouveia, M. A., Hueber, R., Melzener, L., Meßmer, T., Papadopoulos, J., Pimenta, J., Raina, D., et al. (2023) · Annual Review of Animal Biosciences · doi:10.1146/annurev-animal-021022-055132 · Cited by 121
STAT3 in Skeletal Muscle Function and Disorders
Guadagnin, E., Mázala, D. A. G., & Chen, Y. (2018) · International Journal of Molecular Sciences · doi:10.3390/ijms19082265 · Cited by 93
Steyn, P. J., Dzobo, K., Smith, R., & Myburgh, K. H. (2019) · International Journal of Molecular Sciences · doi:10.3390/ijms20215273 · Cited by 95
Exercise as an anti-inflammatory therapy for cancer cachexia: a focus on interleukin-6 regulation
Daou, H. N. (2019) · American Journal of Physiology-Regulatory, Integrative and Comparative Physiology · doi:10.1152/ajpregu.00147.2019 · Cited by 93
The Role of the Skeletal Muscle Secretome in Mediating Endurance and Resistance Training Adaptations
Leuchtmann, A. B., Adak, V., Dilbaz, S., & Handschin, C. (2021) · Frontiers in Physiology · doi:10.3389/fphys.2021.709807 · Cited by 84
Effect of Various Exercise Regimens on Selected Exercise-Induced Cytokines in Healthy People
Domin, R., Dadej, D., Pytka, M., Zybek-Kocik, A., Ruchała, M., & Guzik, P. (2021) · International Journal of Environmental Research and Public Health · doi:10.3390/ijerph18031261 · Cited by 79
“IL-6 also facilitates muscle growth, regulating the function of satellite cells [10,11].”
BackgroundAcute myotube protein synthesis regulation by IL-6-related cytokines
Gao, S., Durstine, J. L., Koh, H.-J., Carver, W. E., Frizzell, N., & Carson, J. A. (2017) · American Journal of Physiology-Cell Physiology · doi:10.1152/ajpcell.00112.2017 · Cited by 69
The IL-6 Paradox: Context Dependent Interplay of SOCS3 and AMPK
Sarvas, J. L. (2013) · Journal of Diabetes & Metabolism · doi:10.4172/2155-6156.s13-003 · Cited by 69
CX 3 CR1 deficiency delays acute skeletal muscle injury repair by impairing macrophage functions
Zhao, W., Lu, H., Wang, X., Ransohoff, R. M., & Zhou, L. (2015) · The FASEB Journal · doi:10.1096/fj.14-270090 · Cited by 70
Regeneration, rejuvenation, and replacement: turning back the clock on tissue aging
Rando, T. A., & Jones, D. L. (2021) · Cold Spring Harbor Perspectives in Biology · doi:10.1101/cshperspect.a040907 · Cited by 63
Wang, X., Zhao, W., Ransohoff, R. M., & Zhou, L. (2018) · Journal of Neuroimmunology · doi:10.1016/j.jneuroim.2018.01.004 · Cited by 58
Myokines: Metabolic regulation in obesity and type 2 diabetes
Chen, Z.-T., Weng, Z.-X., Lin, J. D., & Meng, Z.-X. (2024) · Life Metabolism · doi:10.1093/lifemeta/loae006 · Cited by 58
Hardee, J. P., Counts, B. R., Gao, S., VanderVeen, B. N., Fix, D. K., Koh, H., & Carson, J. A. (2017) · Journal of Cachexia Sarcopenia and Muscle · doi:10.1002/jcsm.12271 · Cited by 50
The role of local IL6/JAK2/STAT3 signaling in high glucose–induced podocyte hypertrophy
Jo, H. A., Kim, J., Yang, S. H., Han, S. S., Joo, K. W., Kim, Y. S., & Kim, D. K. (2016) · Kidney Research and Clinical Practice · doi:10.1016/j.krcp.2016.09.003 · Cited by 48
Kwon, I., Jang, Y., Cho, J., Jang, Y. C., & Lee, Y. (2017) · The Journal of Physiological Sciences · doi:10.1007/s12576-017-0531-2 · Cited by 45
Cornish, S. M., Bugera, E. M., Duhamel, T. A., Peeler, J. D., & Anderson, J. E. (2020) · European Journal of Applied Physiology · doi:10.1007/s00421-020-04337-1 · Cited by 43
Gao, S., & Carson, J. (2016) · American Journal of Physiology - Cell Physiology · doi:10.1152/ajpcell.00052.2015 · Cited by 43
Modeling the Responses to Resistance Training in an Animal Experiment Study
Philippe, A. G., Py, G., Favier, F. B., Sanchez, A. M. J., Bonnieu, A., Busso, T., & Candau, R. B. (2015) · BioMed Research International · doi:10.1155/2015/914860 · Cited by 32
Self-citationTraining load responses modelling and model generalisation in elite sports
Imbach, F., Perrey, S., Chailan, R., Méline, T., & Candau, R. B. (2022) · Scientific Reports · doi:10.1038/s41598-022-05392-8 · Cited by 34
Self-citationNarsale, A. A., Puppa, M., Hardee, J. P., VanderVeen, B. N., Enos, R. T., Murphy, E. A., & Carson, J. A. (2016) · Oncotarget · doi:10.18632/oncotarget.10699 · Cited by 33
Britto, F. A., Gnimassou, O., Groote, E. D., Balan, E., Warnier, G., Everard, A., Cani, P. D., & Deldicque, L. (2019) · The FASEB Journal · doi:10.1096/fj.201902244r · Cited by 30
Shamsi, M. M., Hassan, Z. M., Quinn, L. S., Gharakhanlou, R., Baghersad, L., & Mahdavi, M. (2014) · Endocrine · doi:10.1007/s12020-014-0501-x · Cited by 30
Lira, F. S., de Freitas, M. C., Gerosa-Neto, J., Cholewa, J. M., & Rossi, F. E. (2018) · The Journal of Strength and Conditioning Research · doi:10.1519/jsc.0000000000002653 · Cited by 29
Resistance Training Attenuates Activation of STAT3 and Muscle Atrophy in Tumor-Bearing Mice
Testa, M. T. D. J., Cella, P. S., Marinello, P. C., Frajácomo, F. T. T., Padilha, C. S., Perandini, P. C., Moura, F. A., Duarte, J. A., Cecchini, R., Guarnier, F. A., et al. (2022) · Frontiers in Oncology · doi:10.3389/fonc.2022.880787 · Cited by 31
Yahia, S., Khalil, I. A. H., & El-sherbiny, I. M. (2022) · International Journal of Biological Macromolecules · doi:10.1016/j.ijbiomac.2022.11.136 · Cited by 28
Kwon, I., Lee, Y., Cosío-Lima, L., Cho, J., & Yeom, D.-C. (2015) · Physical Activity and Nutrition · doi:10.5717/jenb.2015.15090710 · Cited by 27
Roumanille, R., Vernus, B., Brioche, T., Descossy, V., Van Ba, C. T., Campredon, S., Philippe, A. G., Delobel, P., Bertrand-Gaday, C., Chopard, A., et al. (2020) · Journal of the International Society of Sports Nutrition · doi:10.1186/s12970-020-00390-5 · Cited by 26
Self-citationWang, B. Y., Chen, Y., Hsiao, A. W., Chen, W., Lee, C., & Lee, O. K. (2023) · Journal of Cachexia Sarcopenia and Muscle · doi:10.1002/jcsm.13228 · Cited by 26
Long-lasting effect of obesity on skeletal muscle transcriptome
Messaoudi, I., Handu, M., Rais, M., Sureshchandra, S., Park, B. S., Fei, S. S., Wright, H., White, A. E., Jain, R., Cameron, J. L., et al. (2017) · BMC Genomics · doi:10.1186/s12864-017-3799-y · Cited by 26
Ginkgolide B increases healthspan and lifespan of female mice
Lee, C., Wang, B. Y., Wong, S. H., Chen, Y., Cao, Q., Hsiao, A. W., Fung, S.-H., Chen, Y.-F., Wu, H.-H., Cheng, P.-Y., et al. (2025) · Nature Aging · doi:10.1038/s43587-024-00802-0 · Cited by 26
Littiere, T. D. O., Castro, G. H. F., Rodriguez, M. D. P. R., Bonafé, C. M., Magalhães, A. F. B., Faleiros, R. R., Vieira, J. I. G., dos Santos, C. G., & Verardo, L. L. (2020) · Animals · doi:10.3390/ani10071173 · Cited by 23
Fontelonga, T. M., Jordan, B., Nunes, A. M., Barraza‐Flores, P., Bolden, N. C., Wuebbles, R. D., Griner, L. A. M., Hu, X., Ferrer, M., Marugán, J., et al. (2019) · Human Molecular Genetics · doi:10.1093/hmg/ddz044 · Cited by 21
Hor, Y.-Y., Ooi, C. H., Lew, L.-C., Jaafar, M. H., Lau, A. S.-Y., Lee, B. ‐., Azlan, A., Choi, S. B., Azzam, G., & Liong, M. (2020) · Journal of Applied Microbiology · doi:10.1111/jam.14776 · Cited by 21
The Impact of CB1 Receptor on Inflammation in Skeletal Muscle Cells
Haddad, M. (2021) · Journal of Inflammation Research · doi:10.2147/jir.s322247 · Cited by 20
Yamamoto, A., Honda, S., Ogura, M., Kato, M., Tanigawa, R., Fujino, H., & Kawamoto, S. (2022) · Nutrients · doi:10.3390/nu14051078 · Cited by 20
HORSE SPECIES SYMPOSIUM: The aging horse: Effects of inflammation on muscle satellite cells
Reed, S. A., LaVigne, E. K., Jones, A. K., Patterson, D. F., & Schauer, A. L. (2014) · Journal of Animal Science · doi:10.2527/jas.2014-8448 · Cited by 18
Sente, T., Berendoncks, A. M. V., Jonckheere, A. I., Rodenburg, R. J., Lauwers, P., Hoof, V. O. V., Wouters, A., Lardon, F., Hoymans, V. Y., & Vrints, C. J. (2016) · BMC Cardiovascular Disorders · doi:10.1186/s12872-016-0278-3 · Cited by 18
Shatoor, A. S., & Humayed, S. A. (2019) · Cardiovascular Toxicology · doi:10.1007/s12012-019-09534-9 · Cited by 18
Effect of Resistance Exercise on Muscle Metabolism and Autophagy in sIBM
Jeong, J., YANG, D.-S., Koo, J., Hwang, D.-J., Cho, J., & Kang, E. (2017) · Medicine & Science in Sports & Exercise · doi:10.1249/mss.0000000000001286 · Cited by 17
Gonzalez, A. M., Hoffman, J. R., Townsend, J. R., Jajtner, A. R., Boone, C. H., Beyer, K. S., Baker, K. M., Wells, A. J., Mangine, G. T., Robinson, E. H., et al. (2016) · European Journal of Applied Physiology · doi:10.1007/s00421-016-3417-8 · Cited by 17
SOCS3 expression in SF1 cells regulates adrenal differentiation and exercise performance
Pedroso, J. A. B., de Mendonça, P. O. R., Fortes, M. A. S., Tomaz, I., Pecorali, V. L., Auricino, T. B., Costa, I. C., Lima, L. B., Furigo, I. C., Bueno, D. N., et al. (2017) · Journal of Endocrinology · doi:10.1530/joe-17-0255 · Cited by 17
Philippe, A. G., Borrani, F., Sanchez, A. M. J., Py, G., & Candau, R. B. (2018) · Journal of Sports Sciences · doi:10.1080/02640414.2018.1494909 · Cited by 17
Self-citationZhou, J., Yang, J., Wang, Y., Ding, H., Li, T., Liu, Z.-H., Chen, L., Jiao, R., Zhang, D., & Kong, L. (2021) · Cellular Signalling · doi:10.1016/j.cellsig.2021.110082 · Cited by 16
Cytokine Mediated Control of Muscle Stem Cell Function
Joanisse, S., & Parise, G. (2016) · Advances in experimental medicine and biology · doi:10.1007/978-3-319-27511-6_2 · Cited by 17
Ahtiainen, J. P., Lensu, S., Ruotsalainen, I., Schumann, M., Ihalainen, J. K., Fachada, V., Mendias, C. L., Brook, M. S., Smith, K., Atherton, P. J., et al. (2018) · Experimental Physiology · doi:10.1113/ep087144 · Cited by 16
Tyrosine 705 Phosphorylation of STAT3 Is Associated with Phenotype Severity in TGFβ1 Transgenic Mice
Guadagnin, E., Narola, J., Bonnemann, C., & Chen, Y.-W. (2015) · BioMed Research International · doi:10.1155/2015/843743 · Cited by 16
Neto, W. K., Silva, W. D. A., Ciena, A. P., Bocalini, D. S., Nucci, R. A. B., Anaruma, C. A., & Gama, E. F. (2017) · The Aging Male · doi:10.1080/13685538.2017.1365832 · Cited by 16
Cordingley, D. M., Anderson, J. E., & Cornish, S. M. (2022) · Journal of Science in Sport and Exercise · doi:10.1007/s42978-022-00164-2 · Cited by 18
Antônio-Santos, J., Ferreira, D. J. S., Costa, G. L. G., de Matos, R. J. B., Toscano, A. E., Manhães‐de‐Castro, R., & Leandro, C. G. (2016) · The Journal of Strength and Conditioning Research · doi:10.1519/jsc.0000000000001449 · Cited by 15
Muscle growth in young horses: Effects of age, cytokines, and growth factors1
LaVigne, E. K., Jones, A. K., Londoño, A. S., Schauer, A., Patterson, D. F., Nadeau, J., & Reed, S. A. (2015) · Journal of Animal Science · doi:10.2527/jas.2015-9634 · Cited by 15
Time Course of Inflammatory Gene Expression Following Crush Injury in Murine Skeletal Muscle
Voss, J. G., Shagal, A., Tsuji, J. M., MacDonald, J. W., Bammler, T. K., Farin, F. M., & Schneider, B. S. P. (2017) · Nursing Research · doi:10.1097/nnr.0000000000000209 · Cited by 14
Effects of SW033291 on the myogenesis of muscle-derived stem cells and muscle regeneration
Dong, Y., Li, Y., Zhang, C., Chen, H., Liu, L., & Chen, S. (2020) · Stem Cell Research & Therapy · doi:10.1186/s13287-020-1574-5 · Cited by 15
Agostinete, R. R., Rossi, F. E., Magalhães, A. J. B., Rocha, A. P. R., Parmezzani, S. S., Gerosa-Neto, J., Cholewa, J. M., & Lira, F. S. (2016) · Frontiers in Physiology · doi:10.3389/fphys.2016.00444 · Cited by 14
Chen, T., Moore, T. M., Ebbert, M. T. W., McVey, N. L., Madsen, S. R., Hallowell, D. M., Harris, A. M., Char, R. E., Mackay, R. P., Hancock, C. R., et al. (2016) · Journal of Applied Physiology · doi:10.1152/japplphysiol.00727.2015 · Cited by 14
Neuropathology of distinct diaphragm areas following mid-cervical spinal cord contusion in the rat
Lee, K. (2022) · The Spine Journal · doi:10.1016/j.spinee.2022.05.016 · Cited by 13
Neto, W. K., Silva, W. D. A., Ciena, A. P., Anaruma, C. A., & Gama, E. F. (2016) · International Journal of Sports Science · Cited by 13
P2Y1R and P2Y2R: potential molecular triggers in muscle regeneration
Wang, M., Yang, B., Jing, X.-Y., Wang, Y., Lu, K., Ren, K., & Kang, L. (2022) · Purinergic Signalling · doi:10.1007/s11302-022-09885-z · Cited by 12
Li, J., Zhang, W., Liu, A., Lu, Y., Yu, L., Liu, X., Sun, L., Zhao, B., Tong, X., Liu, T., et al. (2024) · Advanced Functional Materials · doi:10.1002/adfm.202401564 · Cited by 13
Nakaoka, K., Yamada, A., Noda, S., & Goseki-Sone, M. (2019) · Nutrition (Burbank, Los Angeles County, Calif.) · doi:10.1016/j.nut.2018.09.001 · Cited by 12
Philippe, A. G., Lionne, C., Sanchez, A. M. J., Pagano, A. F., & Candau, R. (2019) · Experimental Physiology · doi:10.1113/ep087071 · Cited by 11
Self-citationCCN2 participates in overload-induced skeletal muscle hypertrophy
Petrosino, J. M., Longenecker, J. Z., Angell, C. D., Hinger, S. A., Martens, C. R., & Accornero, F. (2022) · Matrix Biology · doi:10.1016/j.matbio.2022.01.003 · Cited by 11
Brandt, A. M., Kania, J., Reinholt, B. M., & Johnson, S. (2017) · Domestic Animal Endocrinology · doi:10.1016/j.domaniend.2017.08.004 · Cited by 11
Spielman, L. J., Estaki, M., Ghosh, S., Gibson, D. L., & Klegeris, A. (2017) · Molecular and Cellular Neuroscience · doi:10.1016/j.mcn.2016.12.009 · Cited by 11
Overload-mediated skeletal muscle hypertrophy is not impaired by loss of myofiber STAT3
Pérez‐Schindler, J., Esparza, M. C., McKendry, J., Breen, L., Philp, A., & Schenk, S. (2017) · American Journal of Physiology-Cell Physiology · doi:10.1152/ajpcell.00100.2017 · Cited by 10
Teo, W., Lo, J., Fann, Y., Huang, C., & Huang, T.-F. (2020) · PLoS ONE · doi:10.1371/journal.pone.0244791 · Cited by 10
Shen, J., Zhen, H., Li, L., Zhang, Y., Wang, J., Hu, J., Liu, X., Li, S., Hao, Z., Li, M., et al. (2022) · Molecular Genetics and Genomics · doi:10.1007/s00438-022-01887-1 · Cited by 10
The Influence and Delivery of Cytokines and their Mediating Effect on Muscle Satellite Cells
Nederveen, J. P., Joanisse, S., Snijders, T., & Parise, G. (2017) · Current Stem Cell Reports · doi:10.1007/s40778-017-0089-1 · Cited by 10
Kheira, H. S., El‒Sayed, S. A. E., El‐Sayed, G., & Rizk, M. A. (2018) · Comparative Clinical Pathology · doi:10.1007/s00580-018-2871-6 · Cited by 9
Sarvas, J. L., Niccoli, S., Walser, E., Khaper, N., & Lees, S. J. (2014) · Physiological Reports · doi:10.14814/phy2.12064 · Cited by 9
A systematic review of “myokines and metabolic regulation”
Leon‐Ariza, H. H., Mendoza-Navarrete, M. P., Maldonado-Arango, M. I., & Botero‐Rosas, D. A. (2018) · Apunts Sports Medicine · doi:10.1016/j.apunts.2018.09.003 · Cited by 8
Dual antituberculosis drugs-loaded gelatin hydrogel bioimplant for treating spinal tuberculosis
Yahia, S., Khalil, I. A. H., & El-sherbiny, I. M. (2023) · International Journal of Pharmaceutics · doi:10.1016/j.ijpharm.2023.122609 · Cited by 8
Bonafiglia, J. T., Menzies, K. J., & Gurd, B. J. (2019) · Experimental Physiology · doi:10.1113/ep087436 · Cited by 8
Minari, A. L. A., Avila, F., Oyama, L. M., & dos Santos, R. V. T. (2019) · American Journal of Physiology-Regulatory, Integrative and Comparative Physiology · doi:10.1152/ajpregu.00163.2019 · Cited by 9
Exercise Partially Rejuvenates Muscle Stem Cells
Larrick, J. W., & Mendelsohn, A. R. (2020) · Rejuvenation Research · doi:10.1089/rej.2020.2359 · Cited by 8
Chi, C.-P., Hou, C.-W., Wu, Y.-Y., Wang, T., & Yu, S.-H. (2020) · General Physiology and Biophysics · doi:10.4149/gpb_2019047 · Cited by 8
Jorda, A., Campos-Campos, J., Aldasoro, C., Campo-Palacio, I., Alvarez-Gamez, K., Blasco, M. C., Aldasoro, M., & Vallés, S. L. (2022) · PLoS ONE · doi:10.1371/journal.pone.0276634 · Cited by 10
Silva, C. M. S., Vieira, R. C., Trombeta, J. C. D. S., Lima, T. R., Fraga, G. A., Sena, M. D. S., Ávila, E. T. P., Tibana, R. A., Prestes, J., Navalta, J. W., et al. (2016) · Revista Andaluza de Medicina del Deporte · doi:10.1016/j.ramd.2016.02.005 · Cited by 8
Adenosine A2B Receptors - Mediated Induction of Interleukin-6 in Skeletal Muscle Cells
Haddad, M. (2017) · Turkish Journal of Pharmaceutical Sciences · doi:10.4274/tjps.08108 · Cited by 6
Neto, W. K., Silva, W. D. A., Ciena, A. P., Anaruma, C. A., & Gama, E. F. (2017) · Experimental Gerontology · doi:10.1016/j.exger.2017.08.018 · Cited by 6
Cinnamic acid-GPR109A pathway improves skeletal muscle hypertrophy and metabolism
Ma, Z., Li, P., Feng, X., Zhu, Y., Fan, L., Xu, G., Wang, L., Wang, S., Wu, R., Zhu, C., et al. (2025) · Phytomedicine · doi:10.1016/j.phymed.2025.156851 · Cited by 4
Abdel-Rahman, R. F., Alsugoor, M. H., Alsuhaymi, N., Fayed, H. M., Mahmoud, S. S., Ibrahim, F. A., & Elbaset, M. A. (2025) · Saudi Pharmaceutical Journal · doi:10.1007/s44446-025-00039-x · Cited by 4
Kaneguchi, A., Azuma, Y., Ishinaka, K., Sunagawa, S., Takagi, R., Umehara, T., Yamaoka, K., & Ozawa, J. (2025) · Histochemistry and Cell Biology · doi:10.1007/s00418-025-02428-8 · Cited by 4
Zar, A., Ahmadi, F., Karimi, F., Ahmadi, M., & Ramsbottom, R. (2022) · Molecular & cellular biomechanics · doi:10.32604/mcb.2022.018345 · Cited by 4
Muscle-to-organ cross-talk mediated by interleukin 6 during exercise: a review
Rad, R. S., & Panahzadeh, F. (2023) · Sport Sciences for Health · doi:10.1007/s11332-023-01102-7 · Cited by 5
Dent, J. R., Hetrick, B., Tahvilian, S., Sathe, A., Greyslak, K. T., LaBarge, S. A., Svensson, K., McCurdy, C. E., & Schenk, S. (2019) · Journal of Applied Physiology · doi:10.1152/japplphysiol.00003.2019 · Cited by 5
Effect of electrochemotherapy on myogenesis of mouse C2C12 cells in vitro
Kranjc, S., Medved, A., Matkovič, U., Serša, G., Markelc, B., Božič, T., Jurdana, M., & Čemažar, M. (2023) · Bioelectrochemistry · doi:10.1016/j.bioelechem.2023.108487 · Cited by 3
Inflammatory response of the peripheral neuroendocrine system following downhill running
Minari, A. L. A., Avila, F., Oyama, L. M., & dos Santos, R. V. T. (2021) · Cytokine · doi:10.1016/j.cyto.2021.155746 · Cited by 3
Amorese, A. J., & Spangenburg, E. E. (2017) · American Journal of Physiology-Cell Physiology · doi:10.1152/ajpcell.00165.2017 · Cited by 3
Kwon, I. (2025) · Physical Activity and Nutrition · doi:10.20463/pan.2025.0022 · Cited by 3
G-CSF treatment can attenuate dexamethasone-induced reduction in C2C12 myotube protein synthesis
Wright, C. R., Brown, E. L., Ward, A. C., & Russell, A. P. (2015) · Cytokine · doi:10.1016/j.cyto.2015.01.012 · Cited by 2
RESISTANCE TRANING PROTOCOLS PROMOTE STRENGTH INCREASE WITHOUT MORPHOLOGICAL CHANGES
Damiani, A. P. L., Caldas, L. C., Melo, A. B., Contreiro, C. D. E., Estevam, W. M., Nogueira, B. V., Guimarães‐Ferreira, L., Leopoldo, A. S., & Lima‐Leopoldo, A. P. (2020) · Revista Brasileira de Medicina do Esporte · doi:10.1590/1517-869220202603209955 · Cited by 2
Metadata
- Authors
- Begue, G., Douillard, A., Galbes, O., Rossano, B., Vernus, B., Candau, R., & Py, G.
- Affiliations
- Institut National de Recherche pour l'Agriculture, l'Alimentation et l'Environnement (FR)
- Corresponding author
- Py, Guillaume
- Venue
- PLoS ONE
- Publisher
- Public Library of Science (PLoS)
- Published
- 2013-02-22
- Volume
- 8
- Issue
- 2
- Pages
- e57141
- ISSN
- 1932-6203 (ISSN-L)
- PMC
- PMC3579782
- OpenAlex
- W2031180727
- Cited by
- 124
- References
- 67
- Citations by year
- 2026: 6 · 2025: 10 · 2024: 4 · 2023: 6 · 2022: 15 · 2021: 8 · 2020: 14 · 2019: 11 · 2018: 8 · 2017: 16 · 2016: 11 · 2015: 9 · 2014: 4 · 2013: 2
- FWCI
- 3.88
- Type
- journal article
- Language
- en
- Open access
- gold
- doi.org
- Locations
- PLoS ONE (publishedVersion, cc-by)
- Europe PMC (PubMed Central) (publishedVersion, other-oa)
- PubMed Central (publishedVersion, cc-by)
- PubMed (publishedVersion)
- HAL (submittedVersion, other-oa)
- DOAJ (DOAJ: Directory of Open Access Journals) (submittedVersion, cc-by-sa)
- Funders
- Institut National de la Santé et de la Recherche Médicale
- World Anti-Doping Agency
- Topics
- Life Sciences › Biochemistry, Genetics and Molecular Biology › Molecular Biology › Muscle Physiology and Disorders
- Health Sciences › Medicine › Physiology (medical) › Exercise and Physiological Responses
- Life Sciences › Immunology and Microbiology › Immunology › Cytokine Signaling Pathways and Interactions
- Keywords
- interleukin-6, STAT3, STAT1, resistance training, skeletal muscle hypertrophy, satellite cells, SOCS3, myogenic regulatory factors, MyoD, Myf5, c-Myc, cyclin D1, flexor digitorum profundus, exercise-induced gene expression, muscle fiber hypertrophy
- MeSH terms
- Animals, Gene Expression Regulation, Male, Muscle Proteins, Physical Conditioning, Animal, RNA, Messenger, Interleukin-6, Polymerase Chain Reaction, Rats, Wistar, DNA Primers, Muscle, Skeletal, Cell Proliferation, STAT1 Transcription Factor, STAT3 Transcription Factor, Rats
About these checks
Registry, retraction, Cites and statistics results are computed, not judged, with one exception: a printed reference that no index lists is read once by a model before it counts as a citation error. Claims are extracted by a model and kept only when their quote appears verbatim in the text; each cited source is then checked, with a model’s help, for whether it says what the claim relies on. Those verdicts can be wrong — read the claim’s quote and the cited source before relying on one.
Statistics and arithmetic are recomputed, not judged.
Confidence bands are shown only for fields calibrated on our annotated test set. None is calibrated yet, so no band is shown.
What counts as a claim ›How we measure confidence ›How we check this ›
Are you an author, or do you see a problem with this page? Request a review
