

The DOI matches its Crossref record; 32 of the 32 references it cites were found in a registry or an index.
Impact of the 3D Microenvironment on Phenotype, Gene Expression, and EGFR Inhibition of Colorectal Cancer Cell Lines
Open accessAbstract
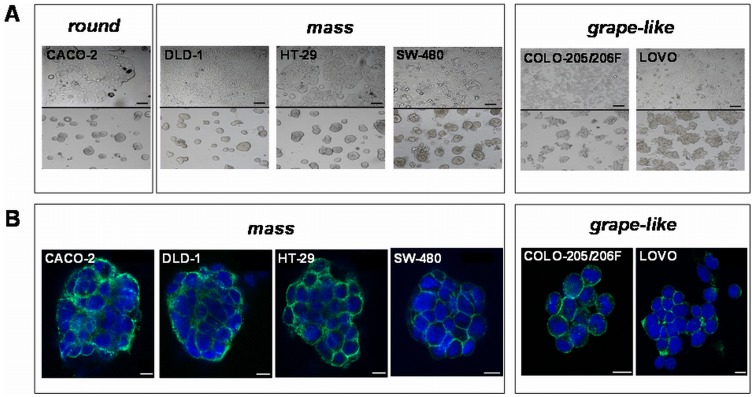
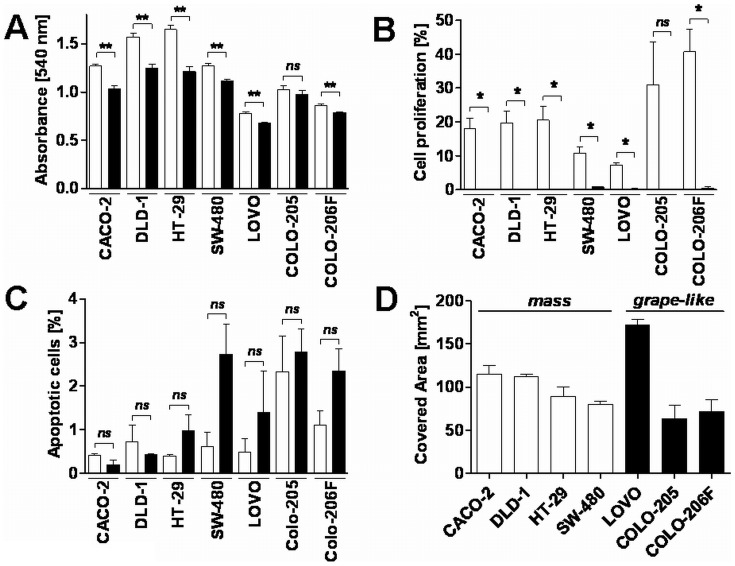
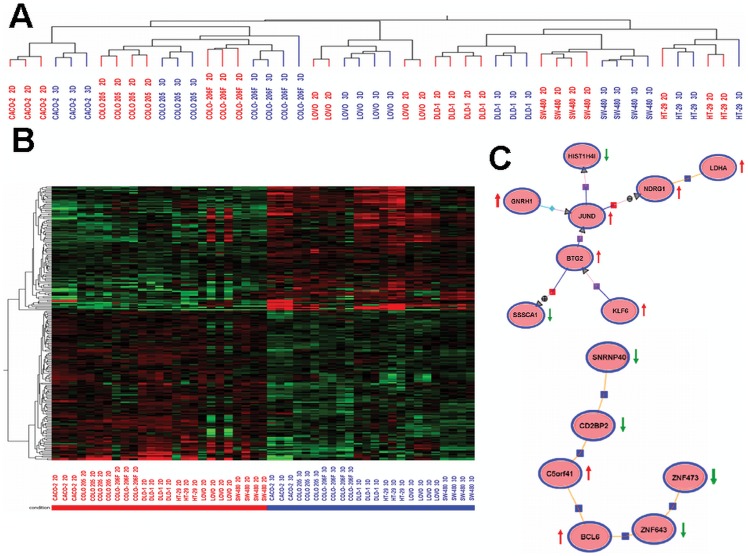
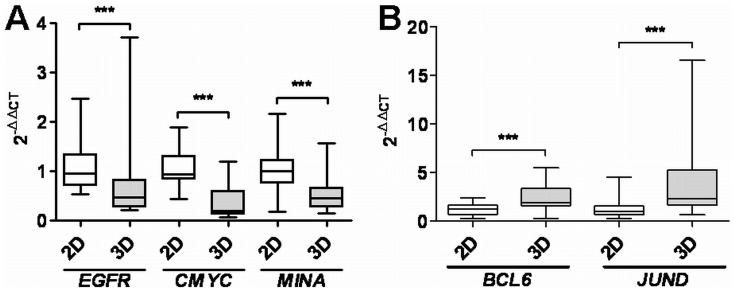
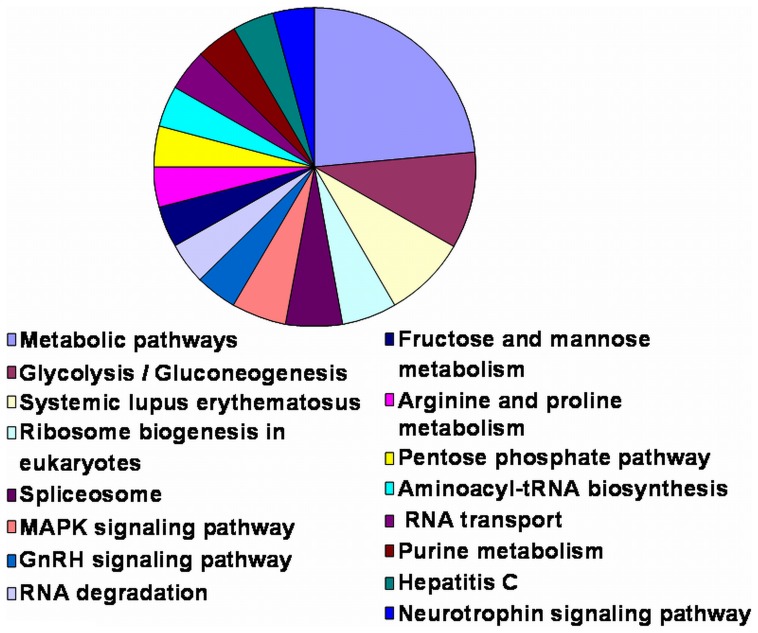
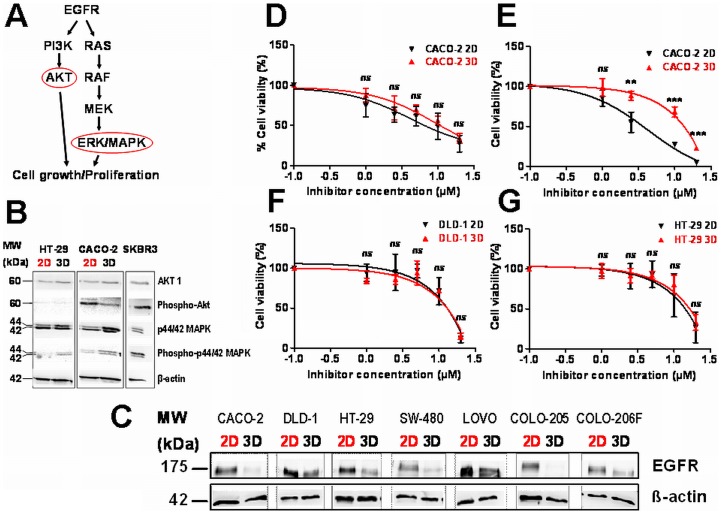
Three-dimensional (3D) tumor cell cultures grown in laminin-rich-extracellular matrix (lrECM) are considered to reflect human tumors more realistic as compared to cells grown as monolayer on plastic. Here, we systematically investigated the impact of ECM on phenotype, gene expression, EGFR signaling pathway, and on EGFR inhibition in commonly used colorectal cancer (CRC) cell lines. LrECM on-top (3D) culture assays were performed with the CRC cell lines SW-480, HT-29, DLD-1, LOVO, CACO-2, COLO-205 and COLO-206F. Morphology of lrECM cultivated CRC cell lines was determined by phase contrast and confocal laser scanning fluorescence microscopy. Proliferation of cells was examined by MTT assay, invasive capacity of the cell lines was assayed using Matrigel-coated Boyden chambers, and migratory activity was determined employing the Fence assay. Differential gene expression was analyzed at the transcriptional level by the Agilent array platform. EGFR was inhibited by using the specific small molecule inhibitor AG1478. A specific spheroid growth pattern was observed for all investigated CRC cell lines. DLD-1, HT-29 and SW-480 and CACO-2 exhibited a clear solid tumor cell formation, while LOVO, COLO-205 and COLO-206F were characterized by forming grape-like structures. Although the occurrence of a spheroid morphology did not correlate with an altered migratory, invasive, or proliferative capacity of CRC cell lines, gene expression was clearly altered in cells grown on lrECM as compared to 2D cultures. Interestingly, in KRAS wild-type cell lines, inhibition of EGFR was less effective in lrECM (3D) cultures as compared to 2D cell cultures. Thus, comparing both 2D and 3D cell culture models, our data support the influence of the ECM on cancer growth. Compared to conventional 2D cell culture, the lrECM (3D) cell culture model offers the opportunity to investigate permanent CRC cell lines under more physiological conditions, i.e. in the context of molecular therapeutic targets and their pharmacological inhibition.
Overview
The claims and statistics of this paper haven’t been checked yet.
Run the check — free, no account needed. It reads the open-access text and checks the sources it cites.
Integrity signals
Registry
Cites
Statistics
Figures
Verification
Claims the paper makes
The claims and statistics of this paper haven’t been checked yet.
Run the check — free, no account needed. It reads the open-access text and checks the sources it cites.
Claims other papers make about this one
Each is checked against this paper’s own text: does it say what the citing paper says it does?
The source backs part of the claim, not all of it — or backs it for a different population, condition or comparison.
In the citing paper
“The proliferation rates of cells cultured in 3D and 2D are usually different, and are cell line and matrix dependent.”
From Three-dimensional cell culture systems and their applications in drug discovery and cell-based biosensors (2014) · cites this paper as [29]
Experimental — accuracy not yet measuredThe cited source says what the claim attributes to it.
In the citing paper
“Overall, the morphological appearance of 3D spheroids is primarily cell line dependent. 29,35,37”
From Three-dimensional cell culture systems and their applications in drug discovery and cell-based biosensors (2014) · cites this paper as [29]
The cited source says what the claim attributes to it.
In the citing paper
“A variety of cell lines showed reduced proliferation rate in 3D cultures compared to those cultured in 2D. 17,27-31”
From Three-dimensional cell culture systems and their applications in drug discovery and cell-based biosensors (2014) · cites this paper as [29]
The check wasn’t confident either way, so it gives no verdict — never disputed.
In the citing paper
“A similar trend was observed in hepatocellular carcinoma models, where monolayers showed enrichment in structural gene expression, whereas spheroids upregulated genes related to metabolism and biosynthesis [196,197,198].”
From Modeling Tumor Microenvironment Complexity In Vitro: Spheroids as Physiologically Relevant Tumor Models and Strategies for Their Analysis (2025) · cites this paper as [197]
Experimental — accuracy not yet measured
Self-check
Percentages, sums and reported differences re-computed from the paper’s own numbers.
The self-check needs the paper’s full text.
Citations
Cites
Analysis of Relative Gene Expression Data Using Real-Time Quantitative PCR and the 2−ΔΔCT Method
Livak, K. J., & Schmittgen, T. D. (2001) · Methods · doi:10.1006/meth.2001.1262 · Cited by 180,860
Integrins: Versatility, modulation, and signaling in cell adhesion
Hynes, R. O. (1992) · Cell · doi:10.1016/0092-8674(92)90115-s · Cited by 9,857
Wild-Type BRAF Is Required for Response to Panitumumab or Cetuximab in Metastatic Colorectal Cancer
Di Nicolantonio, F., Martini, M., Molinari, F., Sartore-Bianchi, A., Arena, S., Saletti, P., De Dosso, S., Mazzucchelli, L., Frattini, M., Siena, S., et al. (2008) · Journal of Clinical Oncology · doi:10.1200/jco.2008.18.0786 · Cited by 1,591 · cited 1×
“KRAS and BRAF mutational status of patients is usually assessed before EGFR treatment on the basis that only patients exhibiting BRAF and KRAS wild type profit from treatments with anti-EGFR therapies [29,30].”
BackgroundBasement membrane complexes with biological activity
Kleinman, H. K., McGarvey, M. L., Hassell, J. R., Star, V. L., Cannon, F. B., Laurie, G. W., & Martin, G. R. (1986) · Biochemistry · doi:10.1021/bi00350a005 · Cited by 1,502
Three-dimensional culture models of normal and malignant breast epithelial cells
Lee, G. Y., Kenny, P. A., Lee, E. H., & Bissell, M. J. (2007) · Nature Methods · doi:10.1038/nmeth1015 · Cited by 1,336
Kleinman, H. K., McGarvey, M. L., Liotta, L. A., Robey, P. G., Tryggvason, K., & Martin, G. R. (1982) · Biochemistry · doi:10.1021/bi00267a025 · Cited by 1,231
PETERSEN, O. W., Rønnov‐Jessen, L., Howlett, A. R., & Bissell, M. J. (1992) · Proceedings of the National Academy of Sciences · doi:10.1073/pnas.89.19.9064 · Cited by 1,096
Kenny, P. A., Lee, G. Y., Myers, C. A., Neve, R. M., Semeiks, J. R., Spellman, P. T., Lorenz, K., Lee, E. H., Barcellos‐Hoff, M. H., PETERSEN, O. W., et al. (2008) · eScholarship (California Digital Library) · Cited by 1,039
Benvenuti, S., Sartore-Bianchi, A., Di Nicolantonio, F., Zanon, C., Moroni, M., Veronese, S., Siena, S., & Bardelli, A. (2007) · Cancer Research · doi:10.1158/0008-5472.can-06-4158 · Cited by 830
Weaver, V. M., Lelièvre, S. A., Lakins, J. N., Chrenek, M. A., Jones, J., Giancotti, F. G., Werb, Z., & Bissell, M. J. (2002) · Cancer Cell · doi:10.1016/s1535-6108(02)00125-3 · Cited by 794
Research works printed but not linked: 1
- PD Yurchenco, 1992, Laminin forms an independent network in basement membranes, J Cell Biol, 117, 1119
Cited by
Sorted by citations
Edmondson, R., Broglie, J. J., Adcock, A. F., & Yang, L. (2014) · ASSAY and Drug Development Technologies · doi:10.1089/adt.2014.573 · Cited by 2,515
3D Cell Culture Systems: Advantages and Applications
Ravi, M., Paramesh, V., Kaviya, S. R., Anuradha, E., & Solomon, F. D. P. (2015) · Journal of Cellular Physiology · doi:10.1002/jcp.24683 · Cited by 1,206
3D tumor spheroids: an overview on the tools and techniques used for their analysis
Costa, E. C., Moreira, A. F., de Melo-Diogo, D., Gaspar, V. M., Carvalho, M. P., & Correia, I. J. (2016) · Biotechnology Advances · doi:10.1016/j.biotechadv.2016.11.002 · Cited by 929
In Vitro Tumor Models: Advantages, Disadvantages, Variables, and Selecting the Right Platform
Katt, M. E., Placone, A. L., Wong, A. D., Xu, Z. S., & Searson, P. C. (2016) · Frontiers in Bioengineering and Biotechnology · doi:10.3389/fbioe.2016.00012 · Cited by 754
3D In Vitro Model (R)evolution: Unveiling Tumor–Stroma Interactions
Rodrigues, J., Heinrich, M. A., Teixeira, L. M., & Prakash, J. (2021) · Trends in Cancer · doi:10.1016/j.trecan.2020.10.009 · Cited by 405
“Gene expression Cell adhesion-, proliferation-, and survival-related genes are usually modified Accurate representation of gene expression patterns [16,85,86]”
BackgroundRiedl, A., Schlederer, M., Pudelko, K., Stadler, M., Walter, S., Unterleuthner, D., Unger, C., Kramer, N., Hengstschläger, M., Kenner, L., et al. (2016) · Journal of Cell Science · doi:10.1242/jcs.188102 · Cited by 389
Białkowska, K., Komorowski, P., Bryszewska, M. J., & Miłowska, K. (2020) · International Journal of Molecular Sciences · doi:10.3390/ijms21176225 · Cited by 416
Hickman, J. A., Graeser, R., Hoogt, R. D., Vidic, S., Brito, C., Gutekunst, M., & van der Kuip, H. (2014) · Biotechnology Journal · doi:10.1002/biot.201300492 · Cited by 405
Liao, J., Qian, F., Tchabo, N. E., Mhawech-Fauceglia, P. Y., Beck, A. F., Zikun, Q., Wang, X., Huss, W. J., Lele, S., Morrison, C. D., et al. (2014) · PLoS ONE · doi:10.1371/journal.pone.0084941 · Cited by 365
Doxorubicin resistance in breast cancer cells is mediated by extracellular matrix proteins
Lovitt, C. J., Shelper, T., & Avery, V. M. (2018) · BMC Cancer · doi:10.1186/s12885-017-3953-6 · Cited by 358
Scaffold-based 3D cell culture models in cancer research
Abuwatfa, W. H., Pitt, W. G., & Husseini, G. A. (2024) · Journal of Biomedical Science · doi:10.1186/s12929-024-00994-y · Cited by 372
Focal adhesion signaling and therapy resistance in cancer
Eke, I., & Cordes, N. (2014) · Seminars in Cancer Biology · doi:10.1016/j.semcancer.2014.07.009 · Cited by 339
Engineering cancer microenvironments for in vitro 3-D tumor models
Asghar, W., El Assal, R., Shafiee, H., Pitteri, S., Paulmurugan, R., & Demirci, U. (2015) · Materials Today · doi:10.1016/j.mattod.2015.05.002 · Cited by 316
Breslin, S., & O’Driscoll, L. (2016) · Oncotarget · doi:10.18632/oncotarget.9935 · Cited by 331
Däster, S., Amatruda, N., Calabrese, D., Ivanek, R., Turrini, E., Droeser, R. A., Zajac, P., Fimognari, C., Spagnoli, G. C., Iezzi, G., et al. (2017) · Oncotarget · doi:10.18632/oncotarget.13857 · Cited by 281
Melissaridou, S., Wiechec, E., Magan, M., Jain, M. V., Chung, M. K., Farnebo, L., & Roberg, K. (2019) · Cancer Cell International · doi:10.1186/s12935-019-0733-1 · Cited by 262
do Amaral, R. L. F., Miranda, M. A., Marcato, P. D., & Swiech, K. (2017) · Frontiers in Physiology · doi:10.3389/fphys.2017.00605 · Cited by 227
Piperine inhibits the growth and motility of triple-negative breast cancer cells
Greenshields, A. L., Doucette, C. D., Sutton, K. M., Madera, L., Annan, H. G., Yaffe, P. B., Knickle, A. F., Dong, Z., & Hoskin, D. W. (2014) · Cancer Letters · doi:10.1016/j.canlet.2014.11.017 · Cited by 219
Three‐dimensional cell culture models for anticancer drug screening: Worth the effort?
Verjans, E., Doijen, J., Luyten, W., Landuyt, B., & Schoofs, L. (2018) · Journal of Cellular Physiology · doi:10.1002/jcp.26052 · Cited by 212
Breast cancer models: Engineering the tumor microenvironment
Bahcecioglu, G., Basara, G., Ellis, B. W., Ren, X., & Zorlutuna, P. (2020) · Acta Biomaterialia · doi:10.1016/j.actbio.2020.02.006 · Cited by 213
3D tumor models: History, advances and future perspectives
Benien, P., & Swami, A. (2014) · Future Oncology · doi:10.2217/fon.13.274 · Cited by 208
Yaffe, P. B., Coombs, M. R. P., Doucette, C. D., Walsh, M. J., & Hoskin, D. W. (2014) · Molecular Carcinogenesis · doi:10.1002/mc.22176 · Cited by 195
Advances in Engineering Human Tissue Models
Moysidou, C., Barberio, C., & Owens, R. M. (2021) · Frontiers in Bioengineering and Biotechnology · doi:10.3389/fbioe.2020.620962 · Cited by 193
Ware, M. J., Colbert, K. L., Keshishian, V., Ho, J., Corr, S. J., Curley, S. A., & Godin, B. (2016) · Tissue Engineering Part C Methods · doi:10.1089/ten.tec.2015.0280 · Cited by 182
Mazzocchi, A. R., Söker, S., & Skardal, A. (2019) · Applied Physics Reviews · doi:10.1063/1.5056188 · Cited by 179
Mouse models of colorectal cancer: Past, present and future perspectives
Bürtin, F., Mullins, C. S., & Linnebacher, M. (2020) · World Journal of Gastroenterology · doi:10.3748/wjg.v26.i13.1394 · Cited by 183
Hydrogels for 3D mammalian cell culture: a starting guide for laboratory practice
Rüdinger, F., Lavrentieva, A. V., Blume, C. A., Pepelanova, I., & Scheper, T. H. (2014) · Applied Microbiology and Biotechnology · doi:10.1007/s00253-014-6253-y · Cited by 174
Ekert, J. E., Johnson, K., Strake, B., Pardinas, J. R., Jarantow, S. W., Perkinson, R. A., & Colter, D. C. (2014) · PLoS ONE · doi:10.1371/journal.pone.0092248 · Cited by 172
Liquid-like Solids Support Cells in 3D
Bhattacharjee, T., Gil, C. J., Marshall, S. L., Urueña, J. M., O’Bryan, C. S., Carstens, M. R., Keselowsky, B. G., Palmer, G. D., Ghivizzani, S. C., Gibbs, C. P., et al. (2016) · ACS Biomaterials Science & Engineering · doi:10.1021/acsbiomaterials.6b00218 · Cited by 165
Sánchez‐Martínez, R., Cruz-Gil, S., de Cedrón, M. G., Álvarez‐Fernández, M., Vargas, T., Molina, S., García, B., Herránz, J., Moreno‐Rubio, J., Reglero, G., et al. (2015) · Oncotarget · doi:10.18632/oncotarget.5340 · Cited by 160
Abbas, Z. N., Al‐Saffar, A. Z., Jasim, S. M., & Sulaiman, G. M. (2023) · Scientific Reports · doi:10.1038/s41598-023-45144-w · Cited by 170
A novel 3D human glioblastoma cell culture system for modeling drug and radiation responses
Gomez-Roman, N., Stevenson, K. H., Gilmour, L., Hamilton, G. M., & Chalmers, A. J. (2016) · Neuro-Oncology · doi:10.1093/neuonc/now164 · Cited by 144
Biomaterials‐Based Approaches to Tumor Spheroid and Organoid Modeling
Thakuri, P. S., Liu, C., Luker, G. D., & Tavana, H. (2017) · Advanced Healthcare Materials · doi:10.1002/adhm.201700980 · Cited by 142
The multiple facets of drug resistance: one history, different approaches
Niero, E. L. D. O., Rocha-Sales, B., Lauand, C., Cortez, B. A., de Souza, M. M., Teixeira, P. R., Urabayashi, M. S., Martens, A. A., Neves, J. H., & Machado‐Santelli, G. M. (2014) · Journal of Experimental & Clinical Cancer Research · doi:10.1186/1756-9966-33-37 · Cited by 138
Organic Bioelectronics for In Vitro Systems
Pitsalidis, C., Pappa, A., Boys, A. J., Fu, Y., Moysidou, C., van Niekerk, D. C., Sáez, J., Savva, A., Iandolo, D., & Owens, R. M. (2021) · Chemical Reviews · doi:10.1021/acs.chemrev.1c00539 · Cited by 141
Ruppen, J., Wildhaber, F. D., Strub, C., Hall, S. R. R., Schmid, R. A., Geiser, T., & Guenat, O. T. (2015) · Lab on a Chip · doi:10.1039/c5lc00454c · Cited by 129
Gwon, K., Kim, E., & Tae, G. (2016) · Acta Biomaterialia · doi:10.1016/j.actbio.2016.12.001 · Cited by 126
Impact of the spheroid model complexity on drug response
Hoffmann, O. I., Ilmberger, C., Magosch, S., Joka, M., Jauch, K.-W., & Mayer, B. (2015) · Journal of Biotechnology · doi:10.1016/j.jbiotec.2015.02.029 · Cited by 125
Howes, A. L., Richardson, R. D., Finlay, D., & Vuori, K. (2014) · PLoS ONE · doi:10.1371/journal.pone.0108283 · Cited by 121
Park, Y., Huh, K. M., & Kang, S. (2021) · International Journal of Molecular Sciences · doi:10.3390/ijms22052491 · Cited by 119
Expansion and Cell-Cycle Arrest: Common Denominators of Cellular Senescence
Ogrodnik, M., Salmonowicz, H., Jurk, D., & Passos, J. F. (2019) · Trends in Biochemical Sciences · doi:10.1016/j.tibs.2019.06.011 · Cited by 104
Advancements in 3D Cell Culture Systems for Personalizing Anti-Cancer Therapies
Law, A. M. K., de la Fuente, L. R., Grundy, T. J., Fang, G., Valdés‐Mora, F., & Gallego‐Ortega, D. (2021) · Frontiers in Oncology · doi:10.3389/fonc.2021.782766 · Cited by 108
Drug screening in 3D in vitro tumor models: overcoming current pitfalls of efficacy read‐outs
Santo, V. E., Rebelo, S. P., Estrada, M. F., Alves, P. M., Boghaert, E. R., & Brito, C. (2016) · Biotechnology Journal · doi:10.1002/biot.201600505 · Cited by 110
Two-Dimensional (2D) and Three-Dimensional (3D) Cell Culturing in Drug Discovery
Joseph, J. S., Malindisa, S. T., & Ntwasa, M. M. (2019) · IntechOpen eBooks · doi:10.5772/intechopen.81552 · Cited by 107
Natural and Synthetic Biomaterials for Engineering Multicellular Tumor Spheroids
Kamatar, A., Gunay, G., & Acar, H. (2020) · Polymers · doi:10.3390/polym12112506 · Cited by 104
Three dimensional spheroid cell culture for nanoparticle safety testing
Sambale, F., Lavrentieva, A. V., Stahl, F., Blume, C. A., Stiesch, M., Kasper, C., Bahnemann, D. W., & Scheper, T. H. (2015) · Journal of Biotechnology · doi:10.1016/j.jbiotec.2015.01.001 · Cited by 98
Routine Optical Clearing of 3D-Cell Cultures: Simplicity Forward
Nürnberg, E., Vitacolonna, M., Klicks, J., von Molitor, E., Cesetti, T., Keller, F., Bruch, R., Ertongur-Fauth, T., Riedel, K., Scholz, P., et al. (2020) · Frontiers in Molecular Biosciences · doi:10.3389/fmolb.2020.00020 · Cited by 93
Chwalek, K., Bray, L. J., & Werner, C. (2014) · Advanced Drug Delivery Reviews · doi:10.1016/j.addr.2014.05.006 · Cited by 91
Galassi, C., Musella, M., Manduca, N., Maccafeo, E., & Sistigu, A. (2021) · Cells · doi:10.3390/cells10092361 · Cited by 93
Fan, T. M., Roberts, R. D., & Lizardo, M. M. (2020) · Frontiers in Oncology · doi:10.3389/fonc.2020.00013 · Cited by 90
Contributions of 3D Cell Cultures for Cancer Research
Ravi, M., Ramesh, A., & Pattabhi, A. (2017) · Journal of Cellular Physiology · doi:10.1002/jcp.25664 · Cited by 90
Polymeric Biomaterials for In Vitro Cancer Tissue Engineering and Drug Testing Applications
Pradhan, S., Hassani, I., Clary, J. M., & Lipke, E. A. (2016) · Tissue Engineering Part B Reviews · doi:10.1089/ten.teb.2015.0567 · Cited by 87
Resveratrol Regulates Colorectal Cancer Cell Invasion by Modulation of Focal Adhesion Molecules
Buhrmann, C., Shayan, P., Goel, A., & Shakibaei, M. (2017) · Nutrients · doi:10.3390/nu9101073 · Cited by 84
In Vitro Modeling of Mechanics in Cancer Metastasis
Malandrino, A., Kamm, R. D., & Moeendarbary, E. (2017) · ACS Biomaterials Science & Engineering · doi:10.1021/acsbiomaterials.7b00041 · Cited by 78
Glioblastoma’s Next Top Model: Novel Culture Systems for Brain Cancer Radiotherapy Research
Caragher, S. P., Chalmers, A. J., & Gomez-Roman, N. (2019) · Cancers · doi:10.3390/cancers11010044 · Cited by 80
Implications of Three-Dimensional Cell Culture in Cancer Therapeutic Research
Poornima, K. N., Francis, A. P., Hoda, M., Eladl, M. A., Subramanian, S., Veeraraghavan, V. P., El‐Sherbiny, M., Asseri, S. M., Hussamuldin, A. B. A., Surapaneni, K. M., et al. (2022) · Frontiers in Oncology · doi:10.3389/fonc.2022.891673 · Cited by 83
Devarasetty, M., Mazzocchi, A. R., & Skardal, A. (2018) · BioDrugs · doi:10.1007/s40259-017-0258-x · Cited by 77
Ruiz-Garcia, H. J., Alvarado-Estrada, K., Schiapparelli, P. V., Quiñones‐Hinojosa, A., & Trifiletti, D. M. (2020) · Frontiers in Cellular Neuroscience · doi:10.3389/fncel.2020.558381 · Cited by 76
Engineered Tools to Study Intercellular Communication
Yang, B. A., Westerhof, T. M., Sabin, K., Merajver, S. D., & Aguilar, C. A. (2020) · Advanced Science · doi:10.1002/advs.202002825 · Cited by 78
Bagher, Z., Azami, M., Ebrahimi‐Barough, S., Mirzadeh, H., Solouk, A., Soleimani, M., Ai, J., Nourani, M. R., & Joghataei, M. T. (2015) · Molecular Neurobiology · doi:10.1007/s12035-015-9199-x · Cited by 71
Edmondson, R., Adcock, A. F., & Yang, L. (2016) · PLoS ONE · doi:10.1371/journal.pone.0158116 · Cited by 69
Shah, S., & D’Souza, G. G. M. (2025) · Cells · doi:10.3390/cells14100732 · Cited by 83
Ritter, A., Kreis, N., Hoock, S. C., Solbach, C., Louwen, F., & Yuan, J. (2022) · Cancers · doi:10.3390/cancers14163908 · Cited by 69
A morphospace for synthetic organs and organoids: the possible and the actual
Ollé-Vila, A., Duran‐Nebreda, S., Pueyo, N. C., Montañez, R., & Solé, R. V. (2016) · Integrative Biology · doi:10.1039/c5ib00324e · Cited by 66
Adipocytes in the Tumour Microenvironment
Pallegar, N. K., & Christian, S. L. (2020) · Advances in experimental medicine and biology · doi:10.1007/978-3-030-37184-5_1 · Cited by 63
The role of the microenvironment in the biophysics of cancer
Rianna, C., Kumar, P., & Radmacher, M. (2017) · Seminars in Cell and Developmental Biology · doi:10.1016/j.semcdb.2017.07.022 · Cited by 62
Matrix Stiffness and Colorectal Cancer
Liu, C., Pei, H., & Tan, F. (2020) · OncoTargets and Therapy · doi:10.2147/ott.s231010 · Cited by 67
Three-dimensional bioactive hydrogel-based scaffolds for bone regeneration in implant dentistry
Sordi, M. B., da Cruz, A. C. C., Fredel, M. C., Magini, R. D. S., & Sharpe, P. T. (2021) · Materials Science and Engineering C · doi:10.1016/j.msec.2021.112055 · Cited by 60
Grunewald, L., Lam, T., Andersch, L., Klaus, A., Schwiebert, S., Winkler, A., Gauert, A., Hagemann, A. I. H., Astrahantseff, K., Klironomos, F., et al. (2021) · Frontiers in Immunology · doi:10.3389/fimmu.2021.689697 · Cited by 60
Akasov, R., Zaytseva‐Zotova, D., Burov, S. V., Leko, M. V., Dontenwill, M., Chiper, M., Vandamme, T., & Арнольдовна, М. Е. (2016) · International Journal of Pharmaceutics · doi:10.1016/j.ijpharm.2016.04.005 · Cited by 59
Castro, F., Pereira, C. L., Macedo, M. H., Almeida, A., Silveira, M. J., Dias, S., Cardoso, A. P., Oliveira, M. J., & Sarmento, B. F. C. C. (2021) · Advanced Drug Delivery Reviews · doi:10.1016/j.addr.2021.06.001 · Cited by 62
April-Monn, S., Wiedmer, T., Skowronska, M., Maire, R., Lena, M. S., Trippel, M., Domenico, A. D., Muffatti, F., Andreasi, V., Capurso, G., et al. (2020) · Neuroendocrinology · doi:10.1159/000507669 · Cited by 59
Monteiro, C. F., Custódio, C. A., & Mano, J. F. (2021) · Acta Biomaterialia · doi:10.1016/j.actbio.2021.07.034 · Cited by 57
3D Cancer Models: Depicting Cellular Crosstalk within the Tumour Microenvironment
Franchi-Mendes, T., Eduardo, R., Domenici, G., & Brito, C. (2021) · Cancers · doi:10.3390/cancers13184610 · Cited by 59
Cucurbitacins from the Leaves of Citrullus colocynthis (L.) Schrad
Chawech, R., Jarraya, R. M., Girardi, C., Vansteelandt, M., Marti, G., Nasri, I., Racaud‐Sultan, C., & Fabre, N. (2015) · Molecules · doi:10.3390/molecules201018001 · Cited by 56
Yoshida, T., Sopko, N. A., Kates, M. R., Liu, X., Joice, G. A., McConkey, D. J., & Bivalacqua, T. J. (2018) · Oncotarget · doi:10.18632/oncotarget.24308 · Cited by 55
Park, S.-R., Kim, S., Lee, J. W., Park, C. H., Yu, W., Lee, S., Chon, S. J., Lee, D. H., & Hong, I. (2020) · Biofabrication · doi:10.1088/1758-5090/abbd29 · Cited by 56
Shamloo, A., Mohammadaliha, N., & Mohseni, M. (2015) · Journal of Biotechnology · doi:10.1016/j.jbiotec.2015.08.005 · Cited by 57
Lou, Y.-F., Zou, Z., Chen, P., Huang, G., Li, B., Zheng, D.-Q., Yu, X., & Luo, X. (2014) · PLoS ONE · doi:10.1371/journal.pone.0097719 · Cited by 55
Roy, V., Magne, B., Vaillancourt-Audet, M., Blais, M., Chabaud, S., Grammond, E., Piquet, L., Fradette, J., Laverdière, I., Moulin, V. J., et al. (2020) · BioMed Research International · doi:10.1155/2020/6051210 · Cited by 57
Kim, H. N., Habbit, N. L., Su, C., Choi, N., Ahn, E. H., Lipke, E. A., & Kim, D. (2019) · Advanced Functional Materials · doi:10.1002/adfm.201807553 · Cited by 55
Bioink: a 3D-bioprinting tool for anticancer drug discovery and cancer management
Pandey-Tiwari, A., Thorat, N. D., Pricl, S., Patil, R. M., Rohiwal, S. S., & Townley, H. E. (2021) · Drug Discovery Today · doi:10.1016/j.drudis.2021.03.010 · Cited by 58
Al‐Lamki, R. S., Bradley, J. R., & Pober, J. S. (2017) · Frontiers in Medicine · doi:10.3389/fmed.2017.00148 · Cited by 53
Faber, S. C., & McCullough, S. D. (2018) · Applied In Vitro Toxicology · doi:10.1089/aivt.2018.0002 · Cited by 57
Oliveira, R. C., Abrantes, A. M., Tralhão, J. G., & Botelho, M. F. (2020) · Animal Models and Experimental Medicine · doi:10.1002/ame2.12102 · Cited by 50
Torras, N., Zabalo, J., Abril, E., Carré, A., García-Díaz, M., & Martínez, E. (2023) · Biomaterials Advances · doi:10.1016/j.bioadv.2023.213534 · Cited by 58
In-depth phenotypic characterization of multicellular tumor spheroids: Effects of 5-Fluorouracil
Virgone‐Carlotta, A., Lemasson, M., Mertani, H. C., Diaz, J., Monnier, S., Dehoux, T., Delanoë‐Ayari, H., Rivière, C., & Rieu, J.-P. (2017) · PLoS ONE · doi:10.1371/journal.pone.0188100 · Cited by 49
Paper as a scaffold for cell cultures: Teaching an old material new tricks
Wu, X., Suvarnapathaki, S., Walsh, K., & Camci‐Unal, G. (2018) · MRS Communications · doi:10.1557/mrc.2018.8 · Cited by 48
3D matrix-based cell cultures: Automated analysis of tumor cell survival and proliferation
Eke, I., Hehlgans, S., Sandfort, V., & Cordes, N. (2015) · International Journal of Oncology · doi:10.3892/ijo.2015.3230 · Cited by 50
Fridman, I. B., Kostas, J. C., Greguš, M., Ray, S., Sullivan, M. R., Ivanov, A. R., Cohen, S., & Konry, T. (2021) · Acta Biomaterialia · doi:10.1016/j.actbio.2021.06.025 · Cited by 46
Bisphenol S and Bisphenol A disrupt morphogenesis of MCF-12A human mammary epithelial cells
Atlas, E., & Dimitrova, V. (2019) · Scientific Reports · doi:10.1038/s41598-019-52505-x · Cited by 46
Al-Kabani, A., Huda, B., Haddad, J., Yousuf, M., Bhurka, F., Ajaz, F., Patnaik, R., Jannati, S., & Banerjee, Y. (2025) · Cancers · doi:10.3390/cancers17132163 · Cited by 53
Funayama, R., Taniguchi, H., Mizuma, M., Fujishima, F., Kobayashi, M., Ohnuma, S., Unno, M., & Nakayama, K. (2017) · Cancer Science · doi:10.1111/cas.13179 · Cited by 45
Anti-Cancer Drug Validation: the Contribution of Tissue Engineered Models
Carvalho, M. R., Lima, D., Reis, R. L., Oliveira, J. M., & Correlo, V. M. (2017) · Stem Cell Reviews and Reports · doi:10.1007/s12015-017-9720-x · Cited by 45
Living Cell Microarrays: An Overview of Concepts
Jonczyk, R., Kurth, T., Lavrentieva, A. V., Walter, J., Scheper, T. H., & Stahl, F. (2016) · Microarrays · doi:10.3390/microarrays5020011 · Cited by 42
Jacobi, N., Seeboeck, R., Hofmann, E., Schweiger, H., Smolinska, V., Mohr, T., Boyer, A., Sommergruber, W., Lechner, P., Pichler-Huebschmann, C., et al. (2017) · Oncotarget · doi:10.18632/oncotarget.22475 · Cited by 43
Kleine‐Brüggeney, H., van Vliet, L., Mulas, C., Gielen, F., Agley, C. C., Silva, J., Smith, A. G., Chalut, K. J., & Hollfelder, F. (2018) · Small · doi:10.1002/smll.201804576 · Cited by 40
Forsythe, S. D., Mehta, N. U., Devarasetty, M., Sivakumar, H., Gmeiner, W. H., Söker, S., Votanopoulos, K. I., & Skardal, A. (2019) · Annals of Biomedical Engineering · doi:10.1007/s10439-019-02269-2 · Cited by 42
Bioengineered Submucosal Organoids for In Vitro Modeling of Colorectal Cancer
Devarasetty, M., Skardal, A., Cowdrick, K., Marini, F., & Soker, S. (2017) · Tissue Engineering Part A · doi:10.1089/ten.tea.2017.0397 · Cited by 41
Arpin, C. C., Mac, S., Jiang, Y., Cheng, H., Grimard, M., Page, B. D. G., Kamocka, M. M., Haftchenary, S., Su, H., Ball, D. P., et al. (2016) · Molecular Cancer Therapeutics · doi:10.1158/1535-7163.mct-15-0003 · Cited by 42
Metadata
- Authors
- Luca, A. C., Mersch, S., Deenen, R., Schmidt, S., Messner, I., Schäfer, K.-L., Baldus, S. E., Huckenbeck, W., Piekorz, R. P., Knoefel, W. T., Krieg, A., & Stoecklein, N. H.
- Affiliations
- Düsseldorf University Hospital (DE)
- Heinrich Heine University Düsseldorf (DE)
- Corresponding author
- Krieg, Andreas
- Stoecklein, Nikolas H.
- ORCID
- Venue
- PLoS ONE
- Publisher
- Public Library of Science (PLoS)
- Published
- 2013-03-26
- Volume
- 8
- Issue
- 3
- Pages
- e59689
- ISSN
- 1932-6203 (ISSN-L)
- PMC
- PMC3608563
- OpenAlex
- W1983051794
- Cited by
- 341
- References
- 31
- Citations by year
- 2026: 11 · 2025: 14 · 2024: 18 · 2023: 29 · 2022: 27 · 2021: 39 · 2020: 40 · 2019: 29 · 2018: 25 · 2017: 33 · 2016: 29 · 2015: 18 · 2014: 25 · 2013: 4
- FWCI
- 13.56
- Type
- journal article
- Language
- en
- Open access
- gold
- doi.org
- Locations
- PLoS ONE (publishedVersion, cc-by)
- Europe PMC (PubMed Central) (publishedVersion, other-oa)
- PubMed Central (publishedVersion, cc-by)
- PubMed (publishedVersion)
- DOAJ (DOAJ: Directory of Open Access Journals) (submittedVersion, cc-by-sa)
- Univ. Duesseldorf: Duesseldorfer Dokumenten- und Publikationsserver (submittedVersion)
- Figshare (submittedVersion, cc-by)
- Funders
- Deutsche Forschungsgemeinschaft (SFB728)
- Topics
- Health Sciences › Medicine › Oncology › Cancer Cells and Metastasis
- Life Sciences › Biochemistry, Genetics and Molecular Biology › Cell Biology › Cellular Mechanics and Interactions
- Physical Sciences › Engineering › Biomedical Engineering › 3D Printing in Biomedical Research
- Keywords
- colorectal cancer, 3D cell culture, tumor microenvironment, EGFR signaling, EGFR inhibition, AG1478, gene expression, cell morphology, spheroid formation, cell invasion, cell migration, KRAS wild-type, 2D vs 3D culture comparison, colorectal cancer cell lines
- MeSH terms
- Extracellular Matrix, Humans, Laminin, Phenotype, Colorectal Neoplasms, Gene Expression Regulation, Neoplastic, Spheroids, Cellular, Cell Culture Techniques, Cell Line, Tumor, Protein Kinase Inhibitors, Cell Proliferation, Tumor Microenvironment, ErbB Receptors
About these checks
Registry, retraction, Cites and statistics results are computed, not judged, with one exception: a printed reference that no index lists is read once by a model before it counts as a citation error. Claims are extracted by a model and kept only when their quote appears verbatim in the text; each cited source is then checked, with a model’s help, for whether it says what the claim relies on. Those verdicts can be wrong — read the claim’s quote and the cited source before relying on one.
Statistics and arithmetic are recomputed, not judged.
Confidence bands are shown only for fields calibrated on our annotated test set. None is calibrated yet, so no band is shown.
What counts as a claim ›How we measure confidence ›How we check this ›
Are you an author, or do you see a problem with this page? Request a review
