

The DOI matches its Crossref record; 33 of the 33 references it cites were found in a registry or an index.
Glial Promoter Selectivity following AAV-Delivery to the Immature Brain
Open accessAbstract
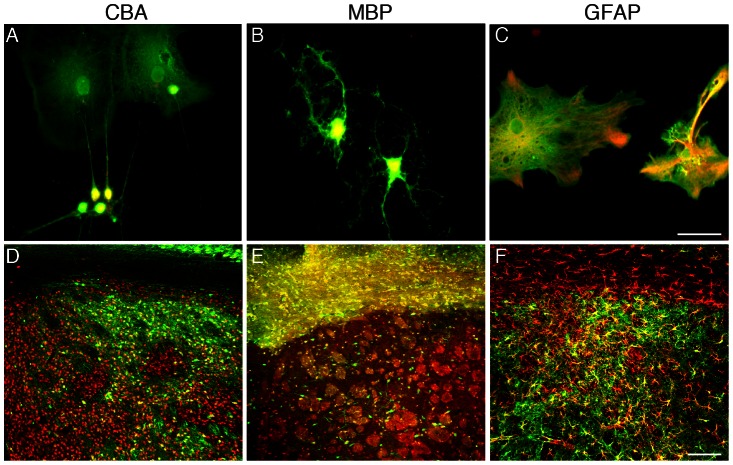
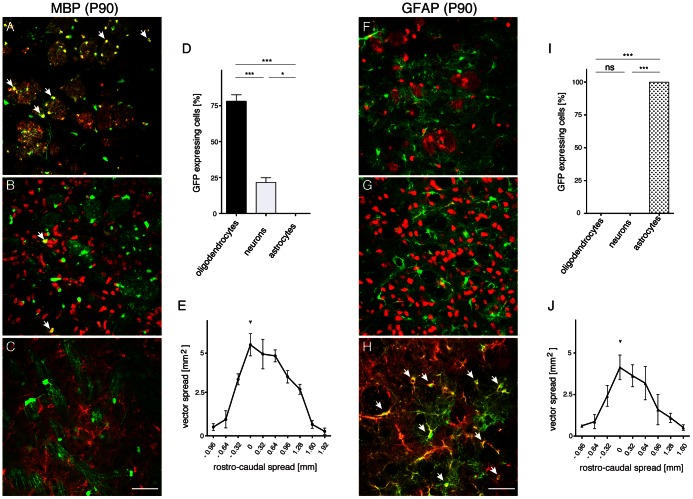
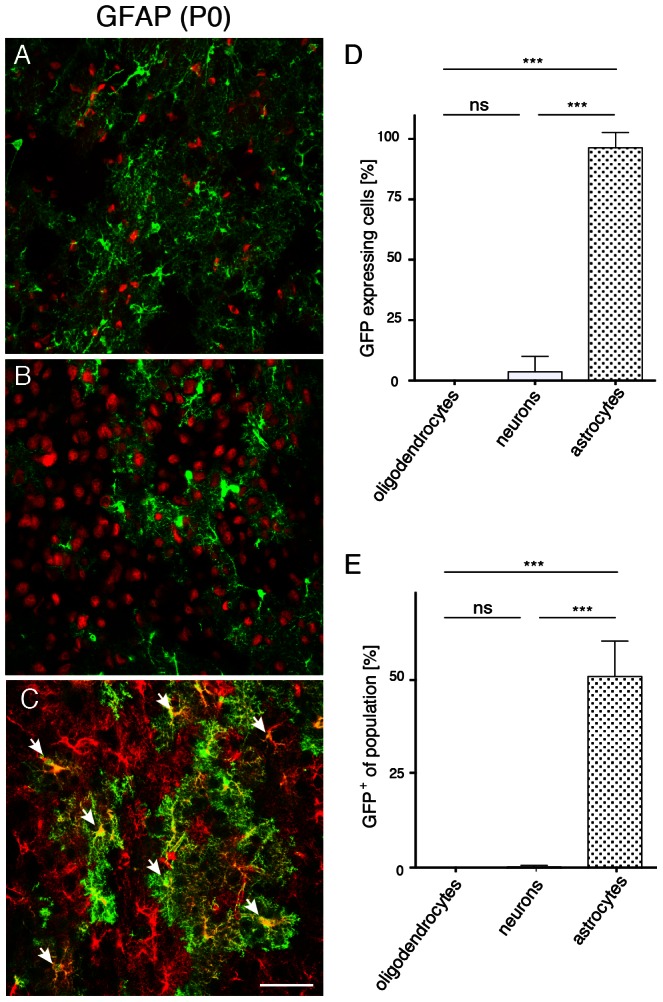
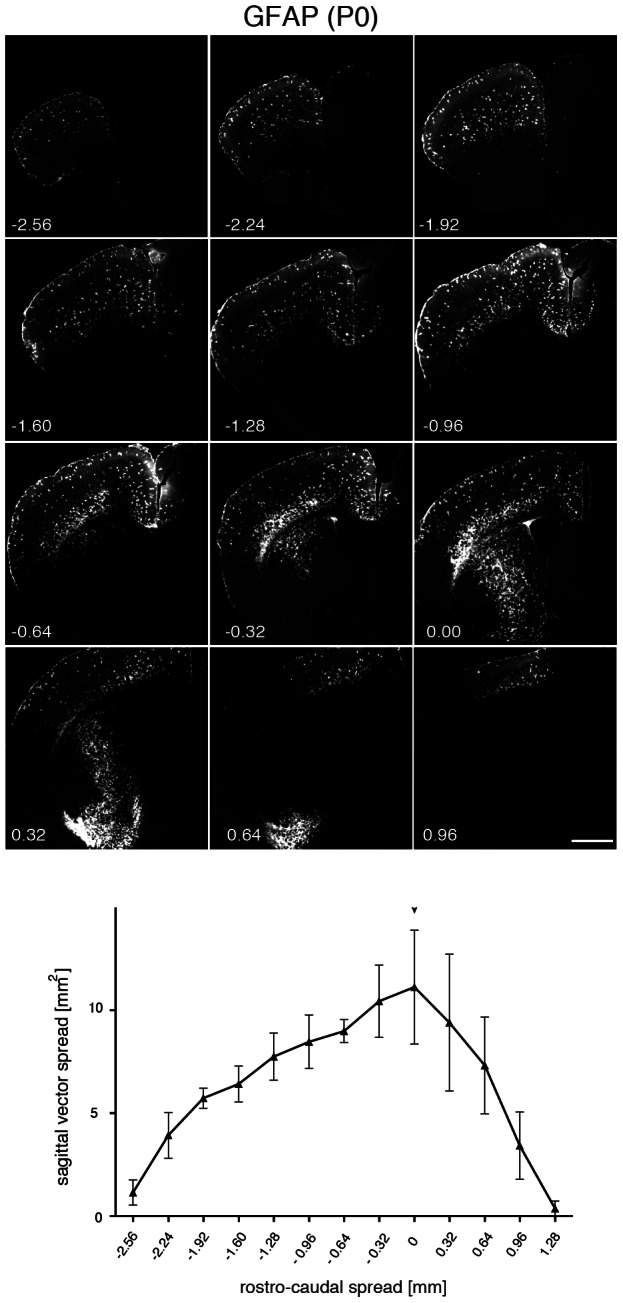
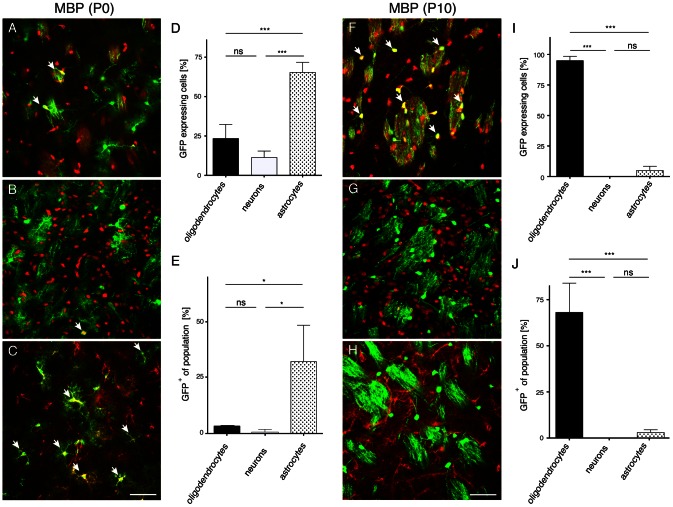
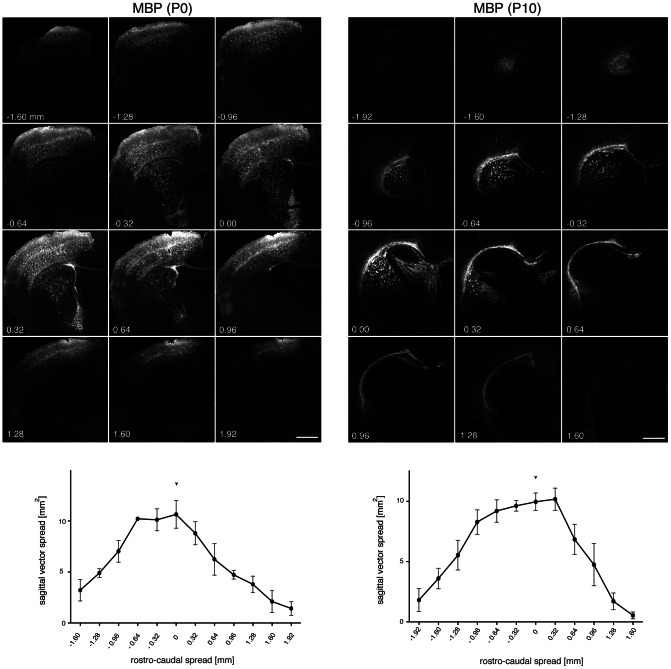
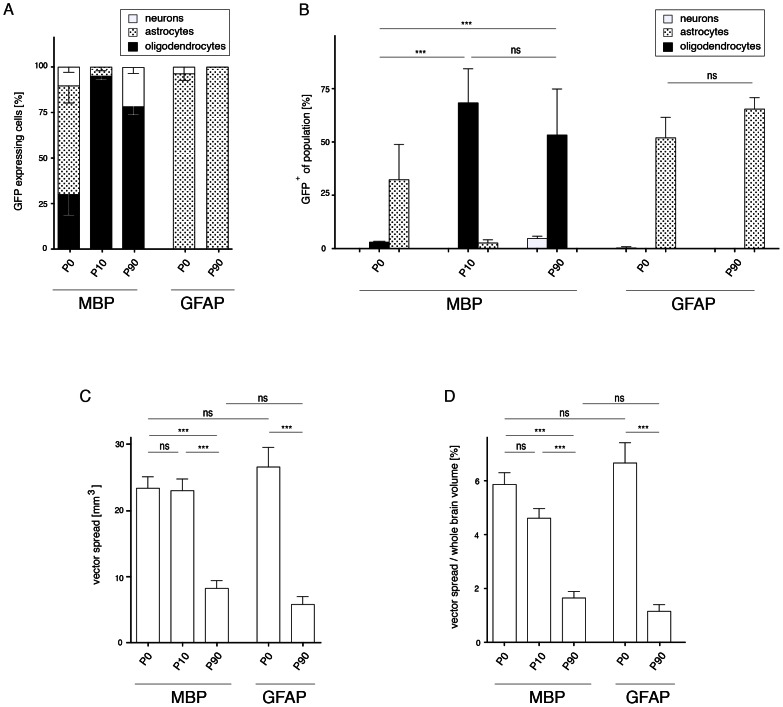
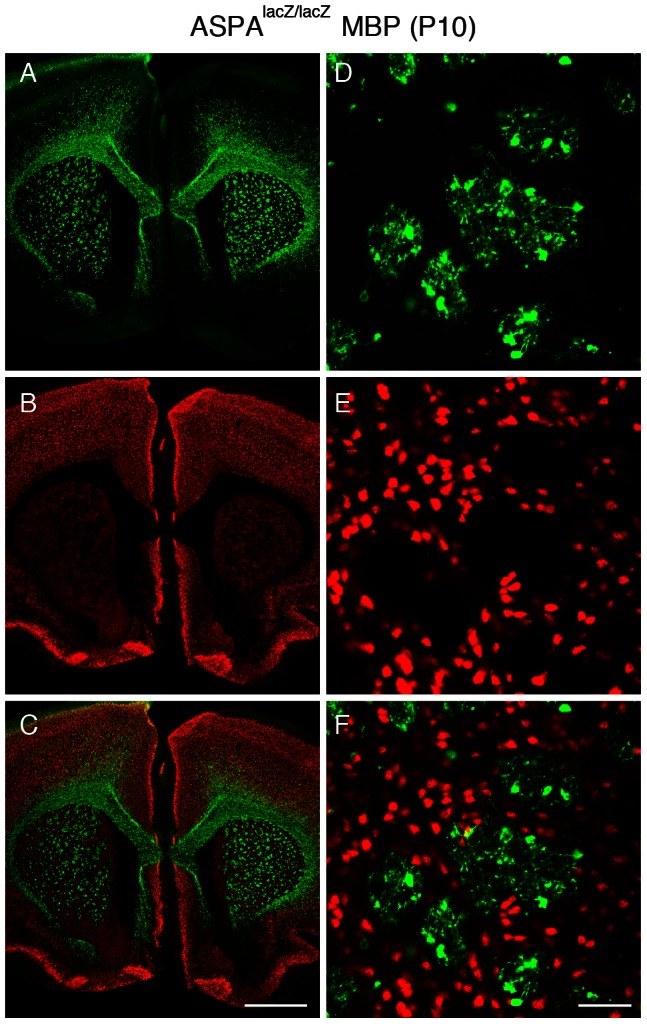
Recombinant adeno-associated virus (AAV) vectors are versatile tools for gene transfer to the central nervous system (CNS) and proof-of-concept studies in adult rodents have shown that the use of cell type-specific promoters is sufficient to target AAV-mediated transgene expression to glia. However, neurological disorders caused by glial pathology usually have an early onset. Therefore, modelling and treatment of these conditions require expanding the concept of targeted glial transgene expression by promoter selectivity for gene delivery to the immature CNS. Here, we have investigated the AAV-mediated green fluorescent protein (GFP) expression driven by the myelin basic protein (MBP) or glial fibrillary acidic protein (GFAP) promoters in the developing mouse brain. Generally, the extent of transgene expression after infusion at immature stages was widespread and higher than in adults. The GFAP promoter-driven GFP expression was found to be highly specific for astrocytes following vector infusion to the brain of neonates and adults. In contrast, the selectivity of the MBP promoter for oligodendrocytes was poor following neonatal AAV delivery, but excellent after vector injection at postnatal day 10. To extend these findings obtained in naïve mice to a disease model, we performed P10 infusions of AAV-MBP-GFP in aspartoacylase (ASPA)-deficient mouse mutants presenting with early onset oligodendrocyte pathology. Spread of GFP expression and selectivity for oligodendrocytes in ASPA-mutants was comparable with our observations in normal animals. Our data suggest that direct AAV infusion to the developing postnatal brain, utilising cellular promoters, results in targeted and long-term transgene expression in glia. This approach will be relevant for disease modelling and gene therapy for the treatment of glial pathology.
Overview
The claims and statistics of this paper haven’t been checked yet.
Run the check — free, no account needed. It reads the open-access text and checks the sources it cites.
Integrity signals
Registry
Cites
Statistics
Figures
Verification
Claims the paper makes
The claims and statistics of this paper haven’t been checked yet.
Run the check — free, no account needed. It reads the open-access text and checks the sources it cites.
Claims other papers make about this one
Each is checked against this paper’s own text: does it say what the citing paper says it does?
The source backs part of the claim, not all of it — or backs it for a different population, condition or comparison.
In the citing paper
“While the Mbp promoter holds promise for potential clinical applications, its murine origin, relative big size and poor specificity following neonatal vector delivery, are potential caveats (von Jonquieres et al., 2013).”
From Recombinant Human Myelin-Associated Glycoprotein Promoter Drives Selective AAV-Mediated Transgene Expression in Oligodendrocytes (2016) · cites this paper as von Jonquieres et al., 2013
Experimental — accuracy not yet measuredThe source backs part of the claim, not all of it — or backs it for a different population, condition or comparison.
In the citing paper
“To date, the only cellular promoter used for AAV-mediated transgene expression in oligodendrocytes is the murine 1.9 kb Mbp cis-regulating element and a truncated version spanning the proximal 1.3 kb upstream region including parts of Mbp exon 1 (Chen et al., 1998; Lawlor et al., 2009; von Jonquieres et al., 2013).”
From Recombinant Human Myelin-Associated Glycoprotein Promoter Drives Selective AAV-Mediated Transgene Expression in Oligodendrocytes (2016) · cites this paper as von Jonquieres et al., 2013
Experimental — accuracy not yet measuredThe cited source says what the claim attributes to it.
In the citing paper
“Preclinical proof-of-concept studies showing successful modification of the AAV system towards selective transgene expression in oligodendrocytes used “neurotropic” serotypes but employed the promoter of the mouse myelin basic protein (Mbp) gene (Chen et al., 1998; Lawlor et al., 2009; von Jonquieres et al., 2013).”
From Recombinant Human Myelin-Associated Glycoprotein Promoter Drives Selective AAV-Mediated Transgene Expression in Oligodendrocytes (2016) · cites this paper as von Jonquieres et al., 2013
The cited source says what the claim attributes to it.
In the citing paper
“Although a comparison between the transduction profiles of the vectors carrying the MAG promoter (this study) and the Mbp promoter (von Jonquieres et al., 2013) is not feasible, it appears that in neonates the MAG promoter might be better suited for transgene expression targeted to oligodendrocytes (90%) than the Mbp promoter (25%).”
From Recombinant Human Myelin-Associated Glycoprotein Promoter Drives Selective AAV-Mediated Transgene Expression in Oligodendrocytes (2016) · cites this paper as von Jonquieres et al., 2013
The cited source says what the claim attributes to it.
In the citing paper
“We have shown previously that the vector spread depends on the developmental stage of the target tissue at the time of infusion but not on the cellular promoter used in the expression cassette (von Jonquieres et al., 2013).”
From Recombinant Human Myelin-Associated Glycoprotein Promoter Drives Selective AAV-Mediated Transgene Expression in Oligodendrocytes (2016) · cites this paper as von Jonquieres et al., 2013
The cited source says what the claim attributes to it.
In the citing paper
“Moreover, we have previously reported a largely superior vector spread following neonatal compared with adult AAV delivery to the CNS (von Jonquieres et al., 2013).”
From Recombinant Human Myelin-Associated Glycoprotein Promoter Drives Selective AAV-Mediated Transgene Expression in Oligodendrocytes (2016) · cites this paper as von Jonquieres et al., 2013
Self-check
Percentages, sums and reported differences re-computed from the paper’s own numbers.
The self-check needs the paper’s full text.
Citations
Cites
Cahoy, J. D., Emery, B., Kaushal, A., Foo, L. C., Zamanian, J. L., Christopherson, K. S., Xing, Y., Lubischer, J. L., Krieg, P. A., Krupenko, S. A., et al. (2008) · The Journal of Neuroscience · doi:10.1523/jneurosci.4178-07.2008 · Cited by 3,129
Intravascular AAV9 preferentially targets neonatal neurons and adult astrocytes
Foust, K. D., Nurre, E., Montgomery, C. L., Hernandez, A., Chan, C. M., & Kaspar, B. K. (2009) · Nature Biotechnology · doi:10.1038/nbt.1515 · Cited by 1,456 · cited 15×
“This developmental stage of the mouse CNS translates to the start of the last prenatal trimester in humans [32].”
BackgroundInfluentialTranslating developmental time across mammalian species
Clancy, B., Darlington, R. B., & Finlay, B. L. (2001) · Neuroscience · doi:10.1016/s0306-4522(01)00171-3 · Cited by 1,221
Quantitative analysis of the packaging capacity of recombinant adeno-associated virus
Dong, J.-Y., Fan, P.-D., & Frizzell, R. A. (1996) · Human Gene Therapy · doi:10.1089/hum.1996.7.17-2101 · Cited by 583
Gray, S. J., Matagne, V., Bachaboina, L., Yadav, S., Ojeda, S. R., & Samulski, R. J. (2011) · Molecular Therapy · doi:10.1038/mt.2011.72 · Cited by 501
Comparative Analysis of Adeno-Associated Viral Vector Serotypes 1, 2, 5, 7, And 8 in Mouse Brain
Taymans, J.-M., Vandenberghe, L. H., Haute, C. V. D., Thiry, I., Deroose, C. M., Mortelmans, L., Wilson, J. M., Debyser, Z., & Baekelandt, V. (2007) · Human Gene Therapy · doi:10.1089/hum.2006.178 · Cited by 305
Zhang, H., Yang, B., Mu, X., Ahmed, S. S., Su, Q., He, R., Wang, H., Mueller, C., Sena-Esteves, M., Brown, R., et al. (2011) · Molecular Therapy · doi:10.1038/mt.2011.98 · Cited by 291
Klein, R. L., Meyer, E. M., Peel, A. L., Zolotukhin, S., Meyers, C., Muzyczka, N., & King, M. A. (1998) · Experimental Neurology · doi:10.1006/exnr.1997.6736 · Cited by 252
Recent developments in adeno‐associated virus vector technology
Büning, H., Perabò, L., Coutelle, O., Quadt‐Humme, S., & Hallek, M. J. (2008) · The Journal of Gene Medicine · doi:10.1002/jgm.1205 · Cited by 204
Klugmann, M., Symes, C. W., Leichtlein, C. B., Klaussner, B. K., Dunning, J., Fong, D. M., Young, D., & During, M. J. (2004) · Molecular and Cellular Neuroscience · doi:10.1016/j.mcn.2004.10.002 · Cited by 198
Self-citation
Cited by
Sorted by citations
Neurotransmitter-Triggered Transfer of Exosomes Mediates Oligodendrocyte–Neuron Communication
Frühbeis, C., Fröhlich, D., Kuo, W. P., Amphornrat, J., Thilemann, S., Saab, A. S., Kirchhoff, F., Möbius, W., Goebbels, S., Nave, K.-A., et al. (2013) · PLoS Biology · doi:10.1371/journal.pbio.1001604 · Cited by 902
Self-citationImmune cell regulation of glia during CNS injury and disease
Greenhalgh, A. D., David, S., & Bennett, F. C. (2020) · Nature reviews. Neuroscience · doi:10.1038/s41583-020-0263-9 · Cited by 411
Gene therapy for neurological disorders: progress and prospects
Deverman, B. E., Ravina, B. M., Bankiewicz, K. S., Paul, S. M., & Sah, D. W. Y. (2018) · Nature Reviews Drug Discovery · doi:10.1038/nrd.2018.110 · Cited by 306
Adeno-Associated Virus-Based Gene Therapy for CNS Diseases
Hocquemiller, M., Giersch, L., Audrain, M., Parker, S., & Cartier, N. (2016) · Human Gene Therapy · doi:10.1089/hum.2016.087 · Cited by 291
Site-specific phosphorylation of tau inhibits amyloid-β toxicity in Alzheimer’s mice
Ittner, A., Chua, S. W., Bertz, J., Volkerling, A., van der Hoven, J., Gladbach, A., Przybyla, M., Bi, M., van Hummel, A., Stevens, C. H., et al. (2016) · Science · doi:10.1126/science.aah6205 · Cited by 263
TFEB enhances astroglial uptake of extracellular tau species and reduces tau spreading
Martini-Stoica, H., Cole, A. L., Swartzlander, D. B., Chen, F., Wan, Y.-W., Bajaj, L., Bader, D. A., Lee, V. M. Y., Trojanowski, J. Q., Liu, Z., et al. (2018) · Journal of Experimental Medicine · doi:10.1084/jem.20172158 · Cited by 253
Erratum: Gene therapy for neurological disorders: progress and prospects
Deverman, B. E., Ravina, B. M., Bankiewicz, K. S., Paul, S. M., & Sah, D. W. Y. (2018) · Nature Reviews Drug Discovery · doi:10.1038/nrd.2018.158 · Cited by 248
Protective Functions of Reactive Astrocytes Following Central Nervous System Insult
Linnerbauer, M., & Rothhammer, V. (2020) · Frontiers in Immunology · doi:10.3389/fimmu.2020.573256 · Cited by 235
Progresses towards safe and efficient gene therapy vectors
Chira, S., Jackson, C. S., Oprea, I. I., Öztürk, F., Pepper, M. S., Diaconu, I., Braicu, C., Ráduly, L., Călin, G. A., & Berindan‐Neagoe, I. (2015) · Oncotarget · doi:10.18632/oncotarget.5169 · Cited by 227
Adeno-Associated Virus Technologies and Methods for Targeted Neuronal Manipulation
Haery, L., Deverman, B. E., Matho, K. S., Cetin, A. H., Woodard, K., Cepko, C. L., Guerin, K. I., Rego, M. A., Ersing, I., Bächle, S. M., et al. (2019) · Frontiers in Neuroanatomy · doi:10.3389/fnana.2019.00093 · Cited by 220
Tau exacerbates excitotoxic brain damage in an animal model of stroke
Bi, M., Gladbach, A., van Eersel, J., Ittner, A., Przybyla, M., van Hummel, A., Chua, S. W., van der Hoven, J., Lee, W. S., Müller, J., et al. (2017) · Nature Communications · doi:10.1038/s41467-017-00618-0 · Cited by 167
Self-citationHammond, S. L., Leek, A. N., Richman, E. H., & Tjalkens, R. B. (2017) · PLoS ONE · doi:10.1371/journal.pone.0188830 · Cited by 171
Gene Therapy Tools for Brain Diseases
Ingusci, S., Verlengia, G., Soukupova, M., Zucchini, S., & Simonato, M. (2019) · Frontiers in Pharmacology · doi:10.3389/fphar.2019.00724 · Cited by 158
Controlling AAV Tropism in the Nervous System with Natural and Engineered Capsids
Castle, M. J., Turunen, H. T., Vandenberghe, L. H., & Wolfe, J. H. (2016) · Methods in Molecular Biology · doi:10.1007/978-1-4939-3271-9_10 · Cited by 151
Adeno-Associated Virus Vectors and Neurological Gene Therapy
Ojala, D. S., Amara, D. P., & Schaffer, D. V. (2014) · The Neuroscientist · doi:10.1177/1073858414521870 · Cited by 143
Messing, A., & Brenner, M. (2020) · ASN NEURO · doi:10.1177/1759091420949680 · Cited by 120
Gutiérrez‐Rodrίguez, A., Río, I. B., Puente, N., Gómez‐Urquijo, S., Fontaine, C. J., Huguet, J. E., Elezgarai, I., Ruehle, S., Lutz, B., Robin, L. M., et al. (2018) · Glia · doi:10.1002/glia.23314 · Cited by 127
Self-citationChoudhury, S., Harris, A. F., Cabral, D. J., Keeler, A. M., Sapp, E., Ferreira, J. S., Gray‐Edwards, H. L., Johnson, J. A., Johnson, A. K., Su, Q., et al. (2015) · Molecular Therapy · doi:10.1038/mt.2015.231 · Cited by 117
Current trends in mouse models of glioblastoma
Miyai, M., Tomita, H., Soeda, A., Yano, H., Iwama, T., & Hara, A. (2017) · Journal of Neuro-Oncology · doi:10.1007/s11060-017-2626-2 · Cited by 109
Fractalkine Over Expression Suppresses α-Synuclein-mediated Neurodegeneration
Nash, K. R., Moran, P., Finneran, D. J., Hudson, C., Robinson, J., Morgan, D., & Bickford, P. C. (2014) · Molecular Therapy · doi:10.1038/mt.2014.175 · Cited by 107
O’Carroll, S. J., Cook, W. H., & Young, D. (2021) · Frontiers in Molecular Neuroscience · doi:10.3389/fnmol.2020.618020 · Cited by 112
Gene Therapy for ALS—A Perspective
Cappella, M., Ciotti, C., Cohen-Tannoudji, M., & Biferi, M. G. (2019) · International Journal of Molecular Sciences · doi:10.3390/ijms20184388 · Cited by 103
Gene Therapy for the Nervous System: Challenges and New Strategies
Maguire, C. A., Ramirez, S. H., Merkel, S. F., Sena‐Esteves, M., & Breakefield, X. O. (2014) · Neurotherapeutics · doi:10.1007/s13311-014-0299-5 · Cited by 99
Harasta, A. E., Power, J., von Jonquières, G., Karl, T., Drucker, D. J., Housley, G. D., Schneider, M., & Klugmann, M. (2015) · Neuropsychopharmacology · doi:10.1038/npp.2015.47 · Cited by 92
Self-citationDiversity of Reactive Astrogliosis in CNS Pathology: Heterogeneity or Plasticity?
Moulson, A. J., Squair, J. W., Franklin, R. J. M., Tetzlaff, W., & Assinck, P. (2021) · Frontiers in Cellular Neuroscience · doi:10.3389/fncel.2021.703810 · Cited by 97
Pagé, N., Klimek, B., Roo, M. D., Steinbach, K., Soldati, H., Lemeille, S., Wagner, I., Kreutzfeldt, M., Liberto, G. D., Vincenti, I., et al. (2018) · Immunity · doi:10.1016/j.immuni.2018.04.005 · Cited by 85
Astrocytes: Emerging Therapeutic Targets in Neurological Disorders
Valori, C. F., Guidotti, G., Brambilla, L., & Rossi, D. (2019) · Trends in Molecular Medicine · doi:10.1016/j.molmed.2019.04.010 · Cited by 77
Adenoassociated virus serotype 9-mediated gene therapy for x-linked adrenoleukodystrophy
Gong, Y., Mu, D., Prabhakar, S., Moser, A., Musolino, P., Ren, J., Breakefield, X. O., Maguire, C. A., & Eichler, F. S. (2015) · Molecular Therapy · doi:10.1038/mt.2015.6 · Cited by 74
New tools for investigating astrocyte-to-neuron communication
Li, D., Agulhon, C., Schmidt, E. M., Oheim, M., & Ropert, N. (2013) · Frontiers in Cellular Neuroscience · doi:10.3389/fncel.2013.00193 · Cited by 76
von Jonquieres, G., Fröhlich, D., Klugmann, C. B., Wen, X., Harasta, A. E., Ramkumar, R., Spencer, Z. H. T., Housley, G. D., & Klugmann, M. (2016) · Frontiers in Molecular Neuroscience · doi:10.3389/fnmol.2016.00013 · Cited by 61
“We have shown previously that the vector spread depends on the developmental stage of the target tissue at the time of infusion but not on the cellular promoter used in the expression cassette (von Jonquieres et al., 2013).”
BackgroundMethodInfluentialSelf-citationUncoupling N-acetylaspartate from brain pathology: implications for Canavan disease gene therapy
von Jonquières, G., Spencer, Z. H. T., Rowlands, B. D., Klugmann, C. B., Bongers, A., Harasta, A. E., Parley, K. E., Cederholm, J. M. E., Teahan, O., Pickford, R., et al. (2017) · Acta Neuropathologica · doi:10.1007/s00401-017-1784-9 · Cited by 58
Self-citationDestination Brain: the Past, Present, and Future of Therapeutic Gene Delivery
Joshi, C. R., Labhasetwar, V., & Ghorpade, A. (2017) · Journal of Neuroimmune Pharmacology · doi:10.1007/s11481-016-9724-3 · Cited by 55
CNS myelination requires VAMP2/3-mediated membrane expansion in oligodendrocytes
Lam, M., Takeo, K., Almeida, R., Cooper, M. H., Wu, K., Iyer, M., Kantarci, H., & Zuchero, J. B. (2022) · Nature Communications · doi:10.1038/s41467-022-33200-4 · Cited by 59
Intravenous AAV9 efficiently transduces myenteric neurons in neonate and juvenile mice
Gombash, S. E., Cowley, C. J., Fitzgerald, J. A., Hall, J. C. E., Mueller, C., Christofi, F. L., & Foust, K. D. (2014) · Frontiers in Molecular Neuroscience · doi:10.3389/fnmol.2014.00081 · Cited by 55
Taschenberger, G., Tereshchenko, J., & Kügler, S. (2017) · Molecular Therapy — Nucleic Acids · doi:10.1016/j.omtn.2017.03.009 · Cited by 57
Dayton, R. D., Grames, M. S., & Klein, R. L. (2018) · Gene Therapy · doi:10.1038/s41434-018-0028-5 · Cited by 57
Gene therapy targeting oligodendrocytes provides therapeutic benefit in a leukodystrophy model
Georgiou, E., Sidiropoulou, K., Richter, J., Papaneophytou, C. P., Sargiannidou, I., Kagiava, A., von Jonquières, G., Christodoulou, C., Klugmann, M., & Kleopa, K. A. (2016) · Brain · doi:10.1093/brain/aww351 · Cited by 48
Self-citationViral‐mediated oligodendroglial alpha‐synuclein expression models multiple system atrophy
Bassil, F., Guerin, P. A., Dutheil, N., Li, Q., Klugmann, M., Meissner, W. G., Bézard, E., & Fernagut, P. (2017) · Movement Disorders · doi:10.1002/mds.27041 · Cited by 49
Self-citationMotor Neuron Gene Therapy: Lessons from Spinal Muscular Atrophy for Amyotrophic Lateral Sclerosis
Tosolini, A. P., & Sleigh, J. N. (2017) · Frontiers in Molecular Neuroscience · doi:10.3389/fnmol.2017.00405 · Cited by 48
Strategies for targeting primate neural circuits with viral vectors
El-Shamayleh, Y., Ni, A. M., & Horwitz, G. D. (2016) · Journal of Neurophysiology · doi:10.1152/jn.00087.2016 · Cited by 47
Guggenhuber, S., Alpár, A., Chen, R., Schmitz, N., Wickert, M., Mattheus, T., Harasta, A. E., Purrio, M., Kaiser, N., Elphick, M. R., et al. (2015) · Brain Structure and Function · doi:10.1007/s00429-015-1027-6 · Cited by 45
Self-citationPetrosyan, H. A., Alessi, V., Singh, V., Hunanyan, A. S., Levine, J. M., & Arvanian, V. L. (2014) · Gene Therapy · doi:10.1038/gt.2014.74 · Cited by 43
Gene therapy approaches targeting Schwann cells for demyelinating neuropathies
Sargiannidou, I., Kagiava, A., & Kleopa, K. A. (2019) · Brain Research · doi:10.1016/j.brainres.2019.146572 · Cited by 38
Rapid initiation of cell cycle reentry processes protects neurons from amyloid-β toxicity
Ippati, S., Deng, Y., van der Hoven, J., Heu, C., van Hummel, A., Chua, S. W., Parić, E., Chan, G., Feiten, A., Fath, T., et al. (2021) · Proceedings of the National Academy of Sciences · doi:10.1073/pnas.2011876118 · Cited by 39
The Application of Adeno-Associated Viral Vector Gene Therapy to the Treatment of Fragile X Syndrome
Hampson, D. R., Hooper, A. W. M., & Niibori, Y. (2019) · Brain Sciences · doi:10.3390/brainsci9020032 · Cited by 38
Challenges and Opportunities of Targeting Astrocytes to Halt Neurodegenerative Disorders
Valori, C. F., Possenti, A., Brambilla, L., & Rossi, D. (2021) · Cells · doi:10.3390/cells10082019 · Cited by 39
Adenosine kinase, glutamine synthetase and EAAT2 as gene therapy targets for temporal lobe epilepsy
Young, D., Fong, D. M., Lawlor, P. A., Wu, A. J., Mouravlev, A., McRae, M., Glass, M., Dragunow, M., & During, M. J. (2014) · Gene Therapy · doi:10.1038/gt.2014.82 · Cited by 38
Schäfer, I., Müller, C., Luhmann, H. J., & White, R. (2016) · Journal of Cell Science · doi:10.1242/jcs.172148 · Cited by 36
Adeno‐associated virus‐based Alzheimer's disease mouse models and potential new therapeutic avenues
Ittner, L. M., Klugmann, M., & Ke, Y. D. (2019) · British Journal of Pharmacology · doi:10.1111/bph.14637 · Cited by 36
Self-citationGene suppressing therapy for Pelizaeus-Merzbacher disease using artificial microRNA
Li, H., Okada, H., Suzuki, S., Sakai, K., Izumi, H., Matsushima, Y., Ichinohe, N., Goto, Y., Okada, T., & Inoue, K. (2019) · JCI Insight · doi:10.1172/jci.insight.125052 · Cited by 35
Optogenetics and its application in pain and anxiety research
Jarrin, S., & Finn, D. P. (2019) · Neuroscience & Biobehavioral Reviews · doi:10.1016/j.neubiorev.2019.08.007 · Cited by 34
Guo, Y., Wang, D., Qiao, T., Yang, C., Su, Q., Gao, G., & Xu, Z. (2015) · Molecular Neurobiology · doi:10.1007/s12035-015-9223-1 · Cited by 34
Ribas, V. T., & Costa, M. R. (2017) · Frontiers in Cellular Neuroscience · doi:10.3389/fncel.2017.00231 · Cited by 34
Feng, L., Chao, J., Ye, P., Luong, Q., Sun, G., Liu, W., Cui, Q., Flores, S. M., Jackson, N., Shayento, A. N. H., et al. (2023) · Advanced Science · doi:10.1002/advs.202206910 · Cited by 34
Intramuscular Delivery of Gene Therapy for Targeting the Nervous System
Tosolini, A. P., & Sleigh, J. N. (2020) · Frontiers in Molecular Neuroscience · doi:10.3389/fnmol.2020.00129 · Cited by 32
A Role for PGC-1a in the Control of Abnormal Mitochondrial Dynamics in Alzheimer’s Disease
Wang, J., Liu, W., Shi, H.-Z., Zhai, H.-R., Qian, J.-J., & Zhang, W. (2022) · Cells · doi:10.3390/cells11182849 · Cited by 34
Gene Therapy Models of Alzheimer’s Disease and Other Dementias
Combs, B., Kneynsberg, A., & Kanaan, N. M. (2015) · Methods in molecular biology · doi:10.1007/978-1-4939-3271-9_25 · Cited by 33
The role of oligodendrocyte gap junctions in neuroinflammation
Papaneophytou, C. P., Georgiou, E., & Kleopa, K. A. (2019) · Channels · doi:10.1080/19336950.2019.1631107 · Cited by 30
Expression Pattern of the Aspartyl-tRNA Synthetase DARS in the Human Brain
Fröhlich, D., Suchowerska, A. K., Voss, C., He, R., Wolvetang, E. J., von Jonquières, G., Simons, C., Fath, T., Housley, G. D., & Klugmann, M. (2018) · Frontiers in Molecular Neuroscience · doi:10.3389/fnmol.2018.00081 · Cited by 29
Self-citationIn vivo characterization of the aspartyl-tRNA synthetase DARS: Homing in on the leukodystrophy HBSL
Fröhlich, D., Suchowerska, A. K., Spencer, Z. H. T., von Jonquières, G., Klugmann, C. B., Bongers, A., Delerue, F., Stefen, H., Ittner, L. M., Fath, T., et al. (2016) · Neurobiology of Disease · doi:10.1016/j.nbd.2016.10.008 · Cited by 28
Self-citationPowell, K. L., Fitzgerald, X., Shallue, C., Jovanovska, V., Klugmann, M., von Jonquières, G., O'Brien, T. J., & Morris, M. J. (2018) · Neurobiology of Disease · doi:10.1016/j.nbd.2018.01.016 · Cited by 28
Self-citationGene therapy approaches in the non-human primate model of Parkinson’s disease
Pignataro, D., Sucunza, D., Rico, A. J., Dopeso‐Reyes, I. G., Roda, E., Rodriguez-Perez, A. I., Labandeira-García, J. L., Broccoli, V., Kato, S., Kobayashi, K., et al. (2017) · Journal of Neural Transmission · doi:10.1007/s00702-017-1681-3 · Cited by 26
Eykens, C., Rossaert, E., Duqué, S. I., Rué, L., Bento‐Abreu, A., Hersmus, N., Lenaerts, A., Kerstens, A., Corthout, N., Munck, S., et al. (2021) · Molecular Therapy — Methods & Clinical Development · doi:10.1016/j.omtm.2021.01.006 · Cited by 24
Self-citationGenetic Constructs for the Control of Astrocytes’ Activity
Borodinova, A. A., Balaban, P. M., Борисович, Б. И., Salmina, A. B., & Власова, О. Л. (2021) · Cells · doi:10.3390/cells10071600 · Cited by 22
Evaluation of Gene Therapy as an Intervention Strategy to Treat Brain Injury from Stroke
Craig, A. J., & Housley, G. D. (2016) · Frontiers in Molecular Neuroscience · doi:10.3389/fnmol.2016.00034 · Cited by 22
Self-citationKe, Y. D., van Hummel, A., Au, C. G., Chan, G., Lee, W. S., van der Hoven, J., Przybyla, M., Deng, Y., Sabale, M., Morey, N., et al. (2024) · Neuron · doi:10.1016/j.neuron.2024.01.022 · Cited by 21
Mouse Models of Experimental Glioblastoma
Jin, F., Jin‐Lee, H. J., & Johnson, A. J. (2021) · Exon Publications eBooks · doi:10.36255/exonpublications.gliomas.2021.chapter2 · Cited by 18
Dual-function AAV gene therapy reverses late-stage Canavan disease pathology in mice
Fröhlich, D., Kalotay, E., von Jonquières, G., Bongers, A., Lee, B., Suchowerska, A. K., Housley, G. D., & Klugmann, M. (2022) · Frontiers in Molecular Neuroscience · doi:10.3389/fnmol.2022.1061257 · Cited by 20
Self-citationCanavan Disease as a Model for Gene Therapy-Mediated Myelin Repair
Lotun, A., Gessler, D. J., & Gao, G. (2021) · Frontiers in Cellular Neuroscience · doi:10.3389/fncel.2021.661928 · Cited by 20
Serguera, C., & Bemelmans, A. (2014) · Revue Neurologique · doi:10.1016/j.neurol.2014.09.004 · Cited by 21
Tosolini, A. P., & Morris, R. (2016) · Scientific Reports · doi:10.1038/srep33058 · Cited by 19
Hoshino, Y., Nishide, K., Nagoshi, N., Shibata, S., Moritoki, N., Kojima, K., Tsuji, O., Matsumoto, M., Kohyama, J., Nakamura, M., et al. (2019) · Scientific Reports · doi:10.1038/s41598-019-46069-z · Cited by 20
Jollé, C., Déglon, N., Pythoud, C., Bouzier‐Sore, A., & Pellerin, L. (2019) · Frontiers in Molecular Neuroscience · doi:10.3389/fnmol.2019.00201 · Cited by 18
Heller, G., Bradbury, A. M., Sands, M. S., & Bongarzone, E. R. (2022) · Molecular Therapy · doi:10.1016/j.ymthe.2022.09.017 · Cited by 17
Meng, X., Yang, F., Ou-Yang, T.-P., Liu, B., Wu, C. H., & Jiang, W. (2015) · Neuroscience Letters · doi:10.1016/j.neulet.2015.03.022 · Cited by 19
Wang, J., Ma, S.-F., Yun, Q., Liu, W.-J., Zhai, H.-R., Shi, H.-Z., Xie, L.-G., Qian, J.-J., Zhao, C.-J., & Zhang, W.-N. (2022) · Journal of Alzheimer s Disease · doi:10.3233/jad-215144 · Cited by 17
Xiang, H., Xu, H., Fan, F., Shin, S., Hogan, Q. H., & Yu, H. (2017) · Journal of Neuroscience Research · doi:10.1002/jnr.24183 · Cited by 15
Cellular and molecular mechanisms of aspartoacylase and its role in Canavan disease
Grønbæk-Thygesen, M., & Hartmann‐Petersen, R. (2024) · Cell & Bioscience · doi:10.1186/s13578-024-01224-6 · Cited by 17
Gene therapy of adeno‐associated virus ( AAV ) vectors in preclinical models of ischemic stroke
Wang, J., Zhu, M., Sun, J., Feng, L., Yang, M., Sun, B., & Mao, L. (2023) · CNS Neuroscience & Therapeutics · doi:10.1111/cns.14392 · Cited by 14
The Astrogenic Balance in the Aging Brain
Andromidas, F., Atashpanjeh, S., Myers, A. J., MacKinnon, B., Shaffer, M. M., & Koob, A. O. (2021) · Current Neuropharmacology · doi:10.2174/1570159x19666210420095118 · Cited by 13
A Hypomorphic Dars1D367Y Model Recapitulates Key Aspects of the Leukodystrophy HBSL
Fröhlich, D., Mendes, M. I. S., Kueh, A. J., Bongers, A., Herold, M. J., Salomons, G. S., Housley, G. D., & Klugmann, M. (2021) · Frontiers in Cellular Neuroscience · doi:10.3389/fncel.2020.625879 · Cited by 13
Self-citationKagiava, A., Sargiannidou, I., Bashiardes, S., Richter, J., Schiza, N., Christodoulou, C., Gritti, A., & Kleopa, K. A. (2014) · The Journal of Gene Medicine · doi:10.1002/jgm.2813 · Cited by 12
Heterogeneity of mature oligodendrocytes in the central nervous system
Weng, C., Groh, A. M. R., Yaqubi, M., Cui, Q., Stratton, J. A., Moore, G. R. W., & Antel, J. P. (2024) · Neural Regeneration Research · doi:10.4103/nrr.nrr-d-24-00055 · Cited by 16
Cerebellar Astrocyte Transduction as Gene Therapy for Megalencephalic Leukoencephalopathy
Sánchez, A., García-Lareu, B., Puig, M., Prat, E., Ruberte, J., Chillón, M., Nunes, V., Estévez, R., & Bosch, A. (2020) · Neurotherapeutics · doi:10.1007/s13311-020-00865-y · Cited by 12
Gene therapy for leukodystrophy: progress, challenges and opportunities
Aubourg, P. R. (2016) · Expert Opinion on Orphan Drugs · doi:10.1517/21678707.2016.1151352 · Cited by 11
Herstine, J. A., Chang, P.-K., Chornyy, S., Stevenson, T. J., Sunshine, A. C., Nokhrina, K., Rediger, J., Wentz, J., Vetter, T. A., Scholl, E. A., et al. (2024) · Molecular Therapy · doi:10.1016/j.ymthe.2024.03.034 · Cited by 11
A brief guide for gene delivery to the brain using adeno-associated viral vectors
Han, S., Yang, E. M., & Hur, E. (2025) · Molecules and Cells · doi:10.1016/j.mocell.2025.100189 · Cited by 13
Uchitel, J., Kantor, B., Smith, E. C., & Mikati, M. A. (2020) · Pediatric Neurology · doi:10.1016/j.pediatrneurol.2020.04.010 · Cited by 11
Emerging Concepts in Vector Development for Glial Gene Therapy: Implications for Leukodystrophies
von Jonquières, G., Rae, C. D., & Housley, G. D. (2021) · Frontiers in Cellular Neuroscience · doi:10.3389/fncel.2021.661857 · Cited by 12
Self-citationRecessive aminoacyl-tRNA synthetase disorders: lessons learned from in vivo disease models
Kalotay, E., Klugmann, M., Housley, G. D., & Fröhlich, D. (2023) · Frontiers in Neuroscience · doi:10.3389/fnins.2023.1182874 · Cited by 10
Self-citationWang, Y., Wang, Y., Pan, W., Xu, L., Wang, J.-Q., Wang, H. X., Qian, X., Zou, C.-Z., Xu, Z., & Wang, J. (2025) · Molecular Neurobiology · doi:10.1007/s12035-025-05146-3 · Cited by 11
Stavropoulos, F., Georgiou, E., Schiza, N., Bell, S., Baloh, R. H., Kleopa, K. A., & Sargiannidou, I. (2023) · Journal of the Peripheral Nervous System · doi:10.1111/jns.12564 · Cited by 10
Optogenetics in Alzheimer’s Disease: Focus on Astrocytes
Mitroshina, Е. V., Kalinina, E. P., & Vedunova, M. V. (2023) · Antioxidants · doi:10.3390/antiox12101856 · Cited by 11
Yurek, D. M., Hasselrot, U., Cass, W. A., Sesenoglu‐Laird, O., Padegimas, L., & Cooper, M. J. (2014) · Neuroscience · doi:10.1016/j.neuroscience.2014.10.026 · Cited by 10
Loss of Central Auditory Processing in a Mouse Model of Canavan Disease
von Jonquières, G., Froud, K. E., Klugmann, C. B., Wong, A. C. Y., Housley, G. D., & Klugmann, M. (2014) · PLoS ONE · doi:10.1371/journal.pone.0097374 · Cited by 9
Self-citationFeng, G., & Sun, Y. (2022) · Frontiers in Neuroscience · doi:10.3389/fnins.2022.960149 · Cited by 9
Chornyy, S., Herstine, J. A., Holaway, C., Biddle, A., Vetter, T. A., Pyne, N. K., & Bradbury, A. M. (2025) · Molecular Therapy — Methods & Clinical Development · doi:10.1016/j.omtm.2025.101588 · Cited by 8
Luchicchi, A., Pattij, T., Viaña, J. N. M., de Kloet, S. F., & Marchant, N. J. (2020) · Journal of Neuroscience Methods · doi:10.1016/j.jneumeth.2020.109004 · Cited by 8
A Mechanistic Approach to the Development of Gene Therapy for Chronic Pain
Kibaly, C., Loh, H. H., & Law, P. (2016) · International review of cytology · doi:10.1016/bs.ircmb.2016.06.002 · Cited by 7
Gene therapy in the CNS—one size does not fit all
Andrews, M. R. (2020) · Gene Therapy · doi:10.1038/s41434-020-00196-9 · Cited by 5
Metadata
- Authors
- von Jonquieres, G., Mersmann, N., Klugmann, C. B., Harasta, A. E., Lutz, B., Teahan, O., Housley, G. D., Fröhlich, D., Krämer-Albers, E.-M., & Klugmann, M.
- Affiliations
- Johannes Gutenberg University Mainz (DE)
- UNSW Sydney (AU)
- Corresponding author
- Klugmann, Matthias
- Venue
- PLoS ONE
- Publisher
- Public Library of Science (PLoS)
- Published
- 2013-06-14
- Volume
- 8
- Issue
- 6
- Pages
- e65646
- ISSN
- 1932-6203 (ISSN-L)
- PMC
- PMC3683058
- OpenAlex
- W2009016214
- Cited by
- 133
- References
- 33
- Citations by year
- 2026: 5 · 2025: 10 · 2024: 6 · 2023: 8 · 2022: 7 · 2021: 14 · 2020: 9 · 2019: 13 · 2018: 11 · 2017: 12 · 2016: 13 · 2015: 9 · 2014: 13 · 2013: 3
- FWCI
- 8.40
- Type
- journal article
- Language
- en
- Open access
- gold
- doi.org
- Locations
- PLoS ONE (publishedVersion, cc-by)
- Europe PMC (PubMed Central) (publishedVersion, other-oa)
- PubMed Central (publishedVersion, cc-by)
- PubMed (publishedVersion)
- DOAJ (DOAJ: Directory of Open Access Journals) (submittedVersion, cc-by-sa)
- Figshare (submittedVersion, cc-by)
- Funders
- Association Européenne contre les Leucodystrophies
- Topics
- Life Sciences › Biochemistry, Genetics and Molecular Biology › Genetics › Virus-based gene therapy research
- Life Sciences › Biochemistry, Genetics and Molecular Biology › Molecular Biology › RNA Interference and Gene Delivery
- Life Sciences › Neuroscience › Neurology › Barrier Structure and Function Studies
- Keywords
- adeno-associated virus vectors, myelin basic protein promoter, glial fibrillary acidic protein promoter, astrocytes, oligodendrocytes, neonatal brain development, postnatal brain, aspartoacylase deficiency, lysosomal storage disease, glial pathology, AAV gene therapy, GFP expression
- MeSH terms
- Dependovirus, Age Factors, Animals, Animals, Newborn, Astrocytes, Brain, Cells, Cultured, Myelin Basic Protein, Genetic Vectors, Glial Fibrillary Acidic Protein, Mice, Inbred C57BL, Oligodendroglia, Organ Specificity, Promoter Regions, Genetic, Genetic Therapy, Gene Expression, Canavan Disease, Transgenes, Green Fluorescent Proteins
About these checks
Registry, retraction, Cites and statistics results are computed, not judged, with one exception: a printed reference that no index lists is read once by a model before it counts as a citation error. Claims are extracted by a model and kept only when their quote appears verbatim in the text; each cited source is then checked, with a model’s help, for whether it says what the claim relies on. Those verdicts can be wrong — read the claim’s quote and the cited source before relying on one.
Statistics and arithmetic are recomputed, not judged.
Confidence bands are shown only for fields calibrated on our annotated test set. None is calibrated yet, so no band is shown.
What counts as a claim ›How we measure confidence ›How we check this ›
Are you an author, or do you see a problem with this page? Request a review
