

The DOI matches its Crossref record; 66 of the 66 references it cites were found in a registry or an index; 13 of the 42 sources its claims cite were checked for support.
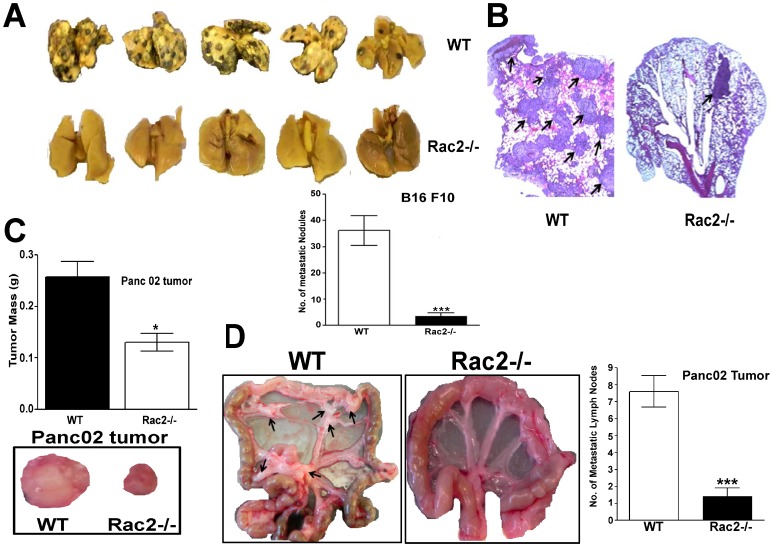
Rac2 Controls Tumor Growth, Metastasis and M1-M2 Macrophage Differentiation In Vivo
Open accessAbstract
Although it is well-established that the macrophage M1 to M2 transition plays a role in tumor progression, the molecular basis for this process remains incompletely understood. Herein, we demonstrate that the small GTPase, Rac2 controls macrophage M1 to M2 differentiation and the metastatic phenotype in vivo. Using a genetic approach, combined with syngeneic and orthotopic tumor models we demonstrate that Rac2-/- mice display a marked defect in tumor growth, angiogenesis and metastasis. Microarray, RT-PCR and metabolomic analysis on bone marrow derived macrophages isolated from the Rac2-/- mice identify an important role for Rac2 in M2 macrophage differentiation. Furthermore, we define a novel molecular mechanism by which signals transmitted from the extracellular matrix via the α4β1 integrin and MCSF receptor lead to the activation of Rac2 and potentially regulate macrophage M2 differentiation. Collectively, our findings demonstrate a macrophage autonomous process by which the Rac2 GTPase is activated downstream of the α4β1 integrin and the MCSF receptor to control tumor growth, metastasis and macrophage differentiation into the M2 phenotype. Finally, using gene expression and metabolomic data from our Rac2-/- model, and information related to M1-M2 macrophage differentiation curated from the literature we executed a systems biologic analysis of hierarchical protein-protein interaction networks in an effort to develop an iterative interactome map which will predict additional mechanisms by which Rac2 may coordinately control macrophage M1 to M2 differentiation and metastasis.
Overview
AI snapshot
Written from the paper’s full text.
TL;DR
Rac2 is required in macrophages for tumor growth, angiogenesis, invasion, metastasis, and M1-to-M2 differentiation in mouse tumor models. The authors propose a macrophage-autonomous axis in which MCSF receptor and α4β1 integrin co-signal through Rac2 to promote M2 polarization and tumor progression.
Key findings
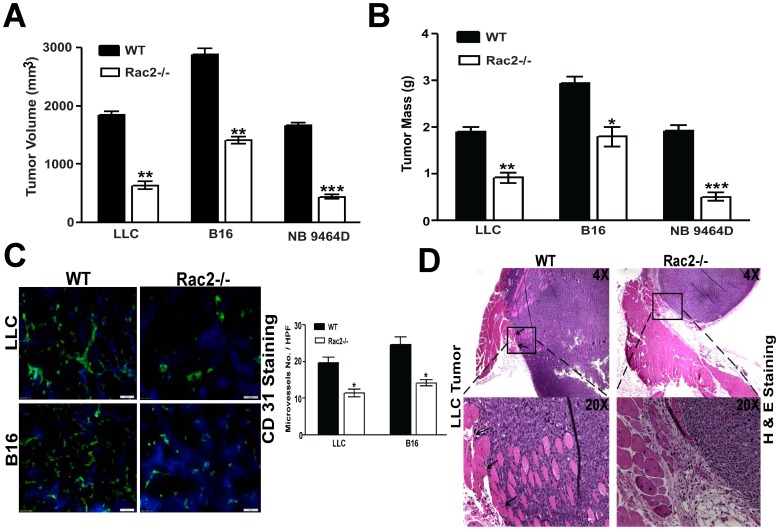
- Rac2-/- mice showed significantly reduced growth of syngeneic LLC, B16 melanoma, and NB9464D tumors (p<0.001), reduced tumor angiogenesis by CD31 microvessel density (P<0.05), and less invasion into muscularis compared with WT mice.
- Rac2-/- mice had an 80% reduction in B16F10 lung metastatic nodules (p<0.001), reduced orthotopic Panc02 pancreatic tumor growth (P<0.05), and reduced regional colonic lymph node metastasis.
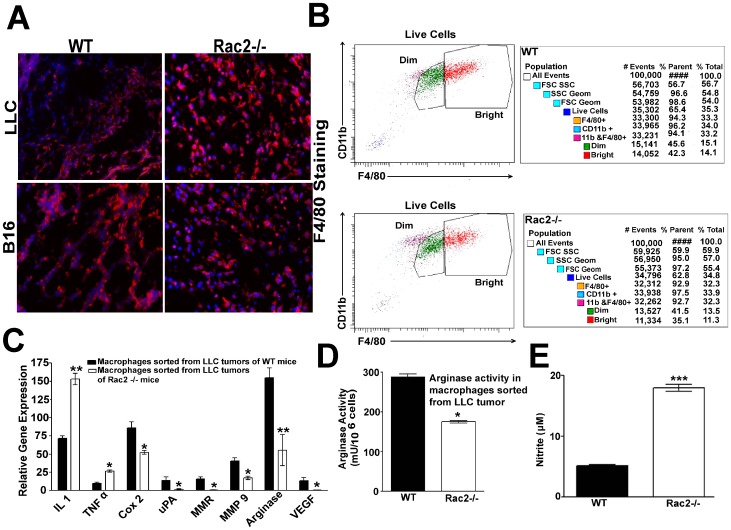
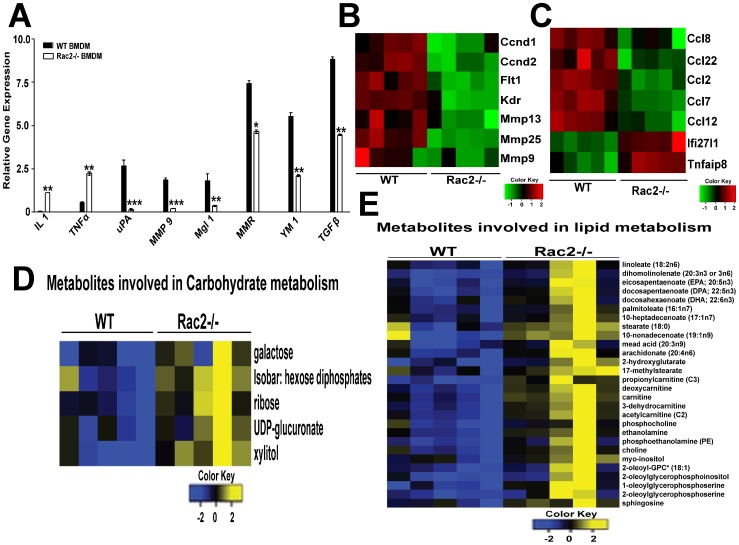
- Macrophages sorted from LLC tumors in WT mice expressed higher M2 markers (Cox2, uPA, MMP9, MMR, arginase, VEGF), while Rac2-/- tumor macrophages expressed higher M1 markers IL1 and TNFα; WT tumor macrophages also had higher arginase activity (p<0.05) and lower nitrite production (p<0.001).
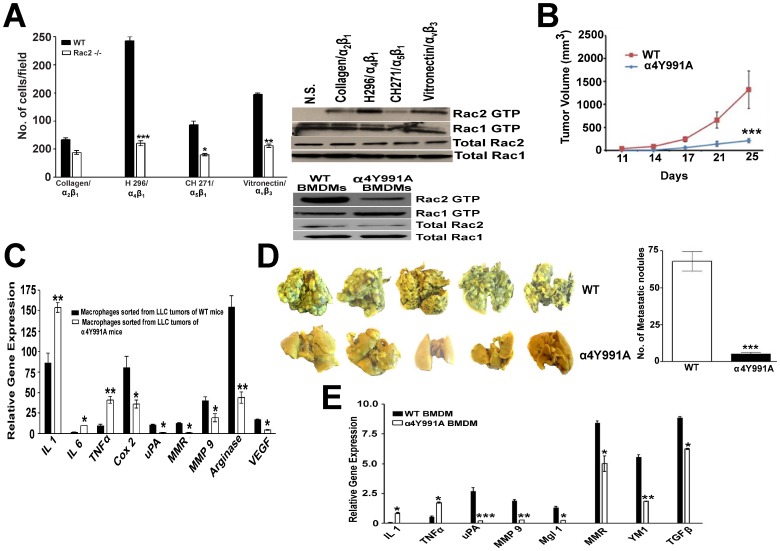
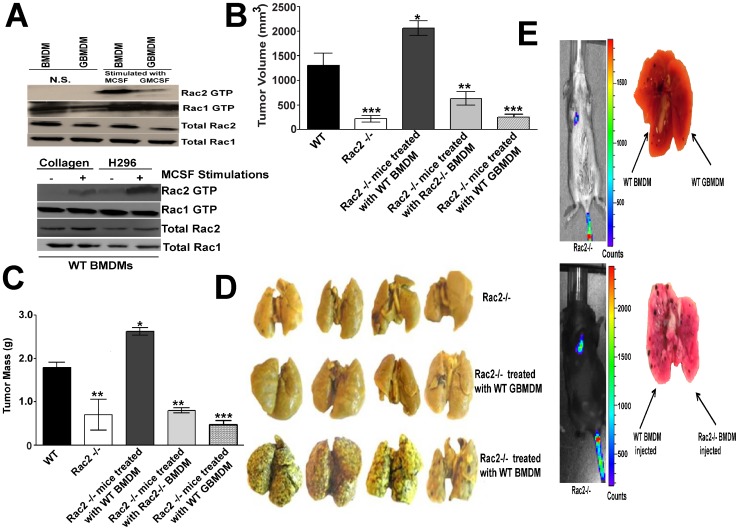
- α4Y991A knock-in mice were defective in tumor growth (p<0.001), metastasis by 90% (p<0.001), and M2 macrophage differentiation; MCSF stimulation activated Rac2 but not Rac1 about 5-fold, and injection of WT BMDMs—but not WT GBMDMs or Rac2-/- BMDMs—reversed tumor growth and metastatic defects in Rac2-/- mice.
Methods
- Genetic mouse models: Rac2-/- and α4Y991A knock-in mice, with syngeneic/orthotopic tumor implants including LLC, B16F10, NB9464D, and Panc02; tumor growth, angiogenesis, invasion, experimental metastasis, and spontaneous lymph node metastasis were assessed.
- Bone marrow-derived macrophages (BMDM) and GMCSF-cultured macrophages (GBMDM) were analyzed by RT-PCR, FACS, arginase/NOS assays, Rac2 GTP pull-down, haptotaxis/invasion assays, microarray (Affymetrix Mouse Genome 1.0 ST; FDR<5%), and metabolomic profiling (UHLC/MS/MS2 and GC/MS).
- Macrophage autonomy was tested by injecting WT, Rac2-/-, or GBMDM into Rac2-/- mice; interactome analysis used literature-curated M1/M2 drivers, BioGRID protein interactions, and network propagation.
Limitations
- The paper states that the molecular mechanisms controlling the M1-M2 transition remain incompletely understood, that M1/M2 classification is “somewhat inexact and artificial,” and that future studies are needed to validate additional cooperating signaling elements.
- Evident from the text: all experiments are in mouse models, with no human validation; some supporting data are described as “data not shown”; and the interactome map is predictive/iterative rather than fully experimentally validated.
Model-written summary. Check it against the paper before relying on it.
Integrity signals
Registry
Cites
Statistics
Figures
Verification
Claims the paper makes
47 Own result · 15 Own interpretation · 11 No full text of the sources · 6 Partly supported · 6 Own method · 3 Couldn’t confirm · 2 Supported so far · 1 Supported · 1 Not checked yet · 1 No basis given · accuracy not yet measured
A result the paper reports from its own data — it cites no other source for it, so there is none to check. The quote shows it is in the paper.
In the paper
“Rac2-/- mice orthotopically implanted with Panc02 cells in pancreas display a marked reduction in regional colonic lymph node metastasis (Figure 2D & Figure S2)”
§ Rac2 Controls Tumor Growth, Metastasis and M1-M2 Macrophage Differentiation In Vivo > Results > Rac2 promotes tumor metastasis
plaindirect- Asserted: passes — The authors put it forward as true.
- Checkable: passes — It can be checked against evidence.
- Load-bearing: passes — The paper’s conclusions depend on it.
- Based: passes — The paper gives a reason why it holds.
A result the paper reports from its own data — it cites no other source for it, so there is none to check. The quote shows it is in the paper.
In the paper
“higher arginase activity (p<0.05) and lower nitrite production (NOS) (p<0.001) was observed in macrophages isolated from LLC tumors injected into WT animals as compared to Rac2-/- mice (Figure 4D–E).”
§ Rac2 Controls Tumor Growth, Metastasis and M1-M2 Macrophage Differentiation In Vivo > Results > Rac2 promotes the differentiation of macrophages into M2 phenotype in vitro and in vivo
plaincorrelational- Asserted: passes — The authors put it forward as true.
- Checkable: passes — It can be checked against evidence.
- Load-bearing: passes — The paper’s conclusions depend on it.
- Based: passes — The paper gives a reason why it holds.
A result the paper reports from its own data — it cites no other source for it, so there is none to check. The quote shows it is in the paper.
In the paper
“Rac2-/- mice display a marked defect in tumor growth, angiogenesis and metastasis.”
- Also stated in: § Rac2 promotes tumor growth, angiogenesis and invasion · plain
“angiogenesis was greatly reduced in subcutaneously implanted LLC and B16 tumors in the Rac2-/- mice compared with WT animals (P<0.05; Figure 1C).”
§ Rac2 Controls Tumor Growth, Metastasis and M1-M2 Macrophage Differentiation In Vivo > Abstract
plaindirect- Asserted: passes — The authors put it forward as true.
- Checkable: passes — It can be checked against evidence.
- Load-bearing: passes — The paper’s conclusions depend on it.
- Based: passes — The paper gives a reason why it holds.
- Also stated in: § Rac2 promotes tumor growth, angiogenesis and invasion · plain
A result the paper reports from its own data — it cites no other source for it, so there is none to check. The quote shows it is in the paper.
In the paper
“Rac2-/- mice display a marked defect in tumor growth, angiogenesis and metastasis.”
- Also stated in: § Rac2 promotes tumor growth, angiogenesis and invasion · plain
“tumor growth of 4 different syngeneic tumors which included: Lewis lung carcinoma (LLC), B16 melanoma and neuroblastoma (9464D) was significantly reduced in the Rac2-/- mice.”
§ Rac2 Controls Tumor Growth, Metastasis and M1-M2 Macrophage Differentiation In Vivo > Abstract
plaindirect- Asserted: passes — The authors put it forward as true.
- Checkable: passes — It can be checked against evidence.
- Load-bearing: passes — The paper’s conclusions depend on it.
- Based: passes — The paper gives a reason why it holds.
- Also stated in: § Rac2 promotes tumor growth, angiogenesis and invasion · plain
A result the paper reports from its own data — it cites no other source for it, so there is none to check. The quote shows it is in the paper.
In the paper
“higher arginase activity (p<0.05) and lower nitrite production (NOS) (p<0.001) was observed in macrophages isolated from LLC tumors injected into WT animals as compared to Rac2-/- mice (Figure 4D–E).”
§ Rac2 Controls Tumor Growth, Metastasis and M1-M2 Macrophage Differentiation In Vivo > Results > Rac2 promotes the differentiation of macrophages into M2 phenotype in vitro and in vivo
plaincorrelational- Asserted: passes — The authors put it forward as true.
- Checkable: passes — It can be checked against evidence.
- Load-bearing: passes — The paper’s conclusions depend on it.
- Based: passes — The paper gives a reason why it holds.
A result the paper reports from its own data — it cites no other source for it, so there is none to check. The quote shows it is in the paper.
In the paper
“Rac2-/- mice were defective in the differentiation of macrophages into M2 phenotype in vitro (Figure 5A).”
§ Rac2 Controls Tumor Growth, Metastasis and M1-M2 Macrophage Differentiation In Vivo > Results > Rac2 promotes the differentiation of macrophages into M2 phenotype in vitro and in vivo
plaindirect- Asserted: passes — The authors put it forward as true.
- Checkable: passes — It can be checked against evidence.
- Load-bearing: passes — The paper’s conclusions depend on it.
- Based: passes — The paper gives a reason why it holds.
A result the paper reports from its own data — it cites no other source for it, so there is none to check. The quote shows it is in the paper.
In the paper
“we observed a significant reduction of tumor growth in orthotopic pancreatic Panc02 carcinoma, a model used to study spontaneous lymph node metastasis (P<0.05; Figure 2C–D).”
§ Rac2 Controls Tumor Growth, Metastasis and M1-M2 Macrophage Differentiation In Vivo > Results > Rac2 promotes tumor metastasis
plaindirect- Asserted: passes — The authors put it forward as true.
- Checkable: passes — It can be checked against evidence.
- Load-bearing: passes — The paper’s conclusions depend on it.
- Based: passes — The paper gives a reason why it holds.
A result the paper reports from its own data — it cites no other source for it, so there is none to check. The quote shows it is in the paper.
In the paper
“The expression levels of tumor promoting M2 markers: Cox 2, uPA, MMP9, MMR, arginase and VEGF are significantly higher in Mθs sorted from LLC tumors of WT while Mθs sorted from Rac2-/- mice displayed higher levels of proinflammatory cytokines, which are considered as M1 markers; IL1 and TNFα (Figure 4C).”
§ Rac2 Controls Tumor Growth, Metastasis and M1-M2 Macrophage Differentiation In Vivo > Results > Rac2 promotes the differentiation of macrophages into M2 phenotype in vitro and in vivo
plaincorrelational- Asserted: passes — The authors put it forward as true.
- Checkable: passes — It can be checked against evidence.
- Load-bearing: passes — The paper’s conclusions depend on it.
- Based: passes — The paper gives a reason why it holds.
A result the paper reports from its own data — it cites no other source for it, so there is none to check. The quote shows it is in the paper.
In the paper
“H & E staining clearly shows a marked increase in tumor invasion within the muscularis layer in WT animals as compared to Rac2-/- animals injected with LLC tumors (Figure 1D).”
§ Rac2 Controls Tumor Growth, Metastasis and M1-M2 Macrophage Differentiation In Vivo > Results > Rac2 promotes tumor growth, angiogenesis and invasion
boostedcorrelational- Asserted: passes — The authors put it forward as true.
- Checkable: passes — It can be checked against evidence.
- Load-bearing: passes — The paper’s conclusions depend on it.
- Based: passes — The paper gives a reason why it holds.
A result the paper reports from its own data — it cites no other source for it, so there is none to check. The quote shows it is in the paper.
In the paper
“Rac2 pull down experiments showed less Rac2-GTP activation under conditions of CSF1R/α4β1 engagement in α4Y991A knock-in mice as compared to WT mice (Figure 3A, right lower panel).”
§ Rac2 Controls Tumor Growth, Metastasis and M1-M2 Macrophage Differentiation In Vivo > Results > Role of Rac2 in macrophage migration, extravaseation and α4β1/CSF1 receptor signaling
plaincorrelational- Asserted: passes — The authors put it forward as true.
- Checkable: passes — It can be checked against evidence.
- Load-bearing: passes — The paper’s conclusions depend on it.
- Based: passes — The paper gives a reason why it holds.
- Rests on an assumption: The α4Y991A knock-in mutation specifically disrupts α4β1 integrin signaling relevant to Rac2 activation and does not have confounding effects on other pathways.
- Probably not a substantial claim. 26
- It may state two separate claims as one. 24
- The quote only partly states this claim. 1
The cited sources support only part of this claim — read each source’s verdict below.
In the paper
“the Rac2 knockout mice display a number of hematopoietic defects mostly in the context of blood cell-specific receptor function or hematopoietic-specific effector mechanisms and also in kinase pathway-activated cell survival [1], [2], [6], [7], [8].”
§ Rac2 Controls Tumor Growth, Metastasis and M1-M2 Macrophage Differentiation In Vivo > Introduction
What the sources say
- Partly supportedcites [1] P De, 2009, Expression of RAC2 in endothelial cells is required for the postnatal neovascular response, Exp Cell Res sourceExperimental — accuracy not yet measured
The Introduction (page unavailable) reports neutrophil, macrophage, and mast-cell defects in Rac2 knockout mice. The Results discuss integrin-directed signaling and SYK-dependent RAC2 activation, but in endothelial cells; the cited paper does not establish kinase pathway-activated cell-survival defects in the knockout mice. (LLM, conf=0.86)
- Not checked — no full text of the sourcecites [2] D Pradip, 2003, Rac2 specificity in macrophage integrin signaling: potential role for Syk kinase, J Biol Chem source
- Not checked — no full text of the sourcecites [6] AW Roberts, 1999, Deficiency of the hematopoietic cell-specific Rho family GTPase Rac2 is characterized by abnormalities in neutrophil function and host defense, Immunity source
plaindirect- Asserted: passes — The authors put it forward as true.
- Checkable: passes — It can be checked against evidence.
- Load-bearing: fails — The paper’s conclusions may not depend on it.
- Based: passes — The paper gives a reason why it holds.
Probably not a substantial claim. The paper’s conclusions may not depend on it.
- Partly supported
Every source the paper cites for this claim was checked and supports it.
In the paper
“As expected, our data demonstrate that the phenotype of the α4Y991A knock-in differs significantly from the Rac2 -/- mice in that α4Y991A knock-in mice as reported by Schmidt et al [29] display a defect in Mθ entry into the TME whereas no such defect is noted in Rac2-/- mice.”
§ Rac2 Controls Tumor Growth, Metastasis and M1-M2 Macrophage Differentiation In Vivo > Discussion
What the sources say
- Supportedcites [29] MC Schmid, 2011, Receptor tyrosine kinases and TLR/IL1Rs unexpectedly activate myeloid cell PI3kgamma, a single convergent point promoting tumor inflammation and progression, Cancer Cell source
The Results section reports reduced macrophage recruitment in mammary tumors of α4Y991A mice and suppressed myeloid-cell infiltration in other α4Y991A tumor models. The citing sentence attributes the α4Y991A entry defect to this paper; it presents the Rac2−/− comparison as the citing authors’ own finding. (LLM, conf=0.92)
boosteddirect- Asserted: passes — The authors put it forward as true.
- Checkable: passes — It can be checked against evidence.
- Load-bearing: passes — The paper’s conclusions depend on it.
- Based: passes — The paper gives a reason why it holds.
It may state two separate claims as one.
- Supported
The cited sources support only part of this claim — read each source’s verdict below.
In the paper
“Other investigators have shown that α4β1 is involved in tumor progression involving the TLR4 signaling pathway and p110γ axis.”
§ Rac2 Controls Tumor Growth, Metastasis and M1-M2 Macrophage Differentiation In Vivo > Discussion
What the sources say
- Partly supportedcites [29] MC Schmid, 2011, Receptor tyrosine kinases and TLR/IL1Rs unexpectedly activate myeloid cell PI3kgamma, a single convergent point promoting tumor inflammation and progression, Cancer Cell sourceExperimental — accuracy not yet measured
The Discussion states that TLR/IL1R signaling activates p110γ, which promotes α4β1 activation and tumor progression; the Results also link p110γ-mediated α4β1 activation to tumor growth. Our copy does not identify TLR4 specifically, so the claim's narrower receptor attribution is not established. (LLM, conf=0.85)
plaincorrelational- Asserted: passes — The authors put it forward as true.
- Checkable: passes — It can be checked against evidence.
- Load-bearing: fails — The paper’s conclusions may not depend on it.
- Based: passes — The paper gives a reason why it holds.
Probably not a substantial claim. The paper’s conclusions may not depend on it.
- Partly supported
The cited sources support only part of this claim — read each source’s verdict below.
In the paper
“Rac2 is only expressed in hematopoietic and endothelial cells whereas Rac1 and Rac3 are ubiquitously expressed in mammalian systems [3], [4], [5].”
§ Rac2 Controls Tumor Growth, Metastasis and M1-M2 Macrophage Differentiation In Vivo > Introduction
What the sources say
- Not checked — no full text of the sourcecites [3] J Didsbury, 1989, rac, a novel ras-related family of proteins that are botulinum toxin substrates, J Biol Chem source
- Partly supportedcites [4] L Haataja, 1997, Characterization of RAC3, a novel member of the Rho family, J Biol Chem sourceExperimental — accuracy not yet measured
The Results (page unavailable) report RAC1 and RAC3 mRNA in all human cell lines studied and RAC2 mRNA mainly in hematopoietic cell lines. They do not establish ubiquitous RAC1 or RAC3 expression across mammalian systems or the claimed endothelial-cell expression of RAC2; RAC3 was detected in only some of the tissues listed. (LLM, conf=0.88)
- Could not verifycites [5] D Diekmann, 1995, Rac GTPase interacts with GAPs and target proteins through multiple effector sites, EMBO J sourceExperimental — accuracy not yet measured
The Introduction discusses rac activity in phagocytic cells, and the Methods identify a human rac1 construct, but neither passage describes where the Rac isoforms are expressed. Searches for Rac2, Rac3, and tissue distribution found no passage supporting the claimed restricted or ubiquitous expression patterns. Page numbers were not available in our copy. (LLM, conf=0.76)
plain- Asserted: passes — The authors put it forward as true.
- Checkable: passes — It can be checked against evidence.
- Load-bearing: fails — The paper’s conclusions may not depend on it.
- Based: passes — The paper gives a reason why it holds.
Probably not a substantial claim. The paper’s conclusions may not depend on it. It may state two separate claims as one.
The cited sources support only part of this claim — read each source’s verdict below.
In the paper
“The α4β1/αvβ3 integrins are expressed in hematopoietic and endothelial cells [14] and play a key role in inflammation [15], [29], [46], [47].”
§ Rac2 Controls Tumor Growth, Metastasis and M1-M2 Macrophage Differentiation In Vivo > Discussion
What the sources say
- Not checked — no full text of the sourcecites [14] CJ Avraamides, 2008, Integrins in angiogenesis and lymphangiogenesis, Nat Rev Cancer source
- Not checked — no full text of the sourcecites [15] H Jin, 2006, Integrin alpha4beta1 promotes monocyte trafficking and angiogenesis in tumors, Cancer Res source
- Partly supportedcites [29] MC Schmid, 2011, Receptor tyrosine kinases and TLR/IL1Rs unexpectedly activate myeloid cell PI3kgamma, a single convergent point promoting tumor inflammation and progression, Cancer Cell sourceExperimental — accuracy not yet measured
The Introduction states that integrins play key roles in inflammation, and the Results identify α4β1 as important for myeloid-cell trafficking to tumors. The paper does not establish the same inflammatory role for αvβ3; in the Results, inhibiting αvβ3 had no effect on the myeloid-cell adhesion tested. The expression claim has a separate citation in the citing sentence. (LLM, conf=0.85)
plaindirect- Asserted: passes — The authors put it forward as true.
- Checkable: passes — It can be checked against evidence.
- Load-bearing: fails — The paper’s conclusions may not depend on it.
- Based: passes — The paper gives a reason why it holds.
Probably not a substantial claim. The paper’s conclusions may not depend on it. It may state two separate claims as one.
The sources with a verdict support this claim; the rest weren’t checked yet, have no full text we could read, or their verdicts aren’t rated yet.
In the paper
“we took advantage of the reports that M2 macrophages can be generated under conditions of MCSF stimulation in vitro [39], [40].”
§ Rac2 Controls Tumor Growth, Metastasis and M1-M2 Macrophage Differentiation In Vivo > Results > MCSF receptor co-signals through α4β1 integrin to activate Rac2 to the GTP-bound state
What the sources say
- Not checked — no full text of the sourcecites [39] AJ Fleetwood, 2009, GM-CSF- and M-CSF-dependent macrophage phenotypes display differential dependence on type I interferon signaling, J Leukoc Biol source
- Supportedcites [40] AJ Fleetwood, 2007, Granulocyte-macrophage colony-stimulating factor (CSF) and macrophage CSF-dependent macrophage phenotypes display differences in cytokine profiles and transcription factor activities: implications for CSF blockade in inflammation, J Immunol source
The introduction reports that anti-inflammatory type-2 human macrophages, termed M-2, have been generated in the presence of M-CSF. The Phenotyping section also describes this paper's in vitro culture of murine bone-marrow cells with M-CSF, and the Discussion describes the resulting cells as M2-like. (LLM, conf=0.92)
plaindirect- Asserted: passes — The authors put it forward as true.
- Checkable: passes — It can be checked against evidence.
- Load-bearing: passes — The paper’s conclusions depend on it.
- Based: passes — The paper gives a reason why it holds.
Probably not a substantial claim.
The sources with a verdict support this claim; the rest weren’t checked yet, have no full text we could read, or their verdicts aren’t rated yet.
In the paper
“The current investigation began with our initial observation that the provisional integrins, α4β1/αvβ3 induced migration requires a specific isoform of Rac, Rac2 in macrophages and endothelial cells and that this pathway regulated the postnatal angiogenic response in vivo [1], [2].”
§ Rac2 Controls Tumor Growth, Metastasis and M1-M2 Macrophage Differentiation In Vivo > Discussion
What the sources say
- Supportedcites [1] P De, 2009, Expression of RAC2 in endothelial cells is required for the postnatal neovascular response, Exp Cell Res source
The Results section reports that RAC2 deficiency markedly reduces α4β1- and αv-integrin-directed migration in bone marrow-derived endothelial cells, and it notes prior work showing RAC2-dependent integrin-directed macrophage migration. The Discussion reports that RAC2 is required for postnatal neovascularization in vivo. Page numbers were not provided in our copy. (LLM, conf=0.90)
- Not checked — no full text of the sourcecites [2] D Pradip, 2003, Rac2 specificity in macrophage integrin signaling: potential role for Syk kinase, J Biol Chem source
plaindirect- Asserted: passes — The authors put it forward as true.
- Checkable: passes — It can be checked against evidence.
- Load-bearing: passes — The paper’s conclusions depend on it.
- Based: passes — The paper gives a reason why it holds.
It may state two separate claims as one.
- Supported
The cited sources that could be checked couldn’t confirm or dispute this claim.
In the paper
“Previous findings clearly demonstrate that in the absence of Rac2, macrophages and/or neutrophils display suppressed reactive oxygen species (ROS) production, defective chemotaxis, impaired phagocytosis, and decreased microbial killing [1], [2], [6], [7], [8].”
§ Rac2 Controls Tumor Growth, Metastasis and M1-M2 Macrophage Differentiation In Vivo > Discussion
What the sources say
- Could not verifycites [1] P De, 2009, Expression of RAC2 in endothelial cells is required for the postnatal neovascular response, Exp Cell Res sourceExperimental — accuracy not yet measured
The Introduction reports neutrophil and macrophage defects in Rac2-knockout mice, and the Results mention impaired macrophage migration, but neither identifies impaired phagocytosis. A search for “phagocytosis” in our copy found no passage addressing that specific claim. (LLM, conf=0.73)
- Not checked — no full text of the sourcecites [2] D Pradip, 2003, Rac2 specificity in macrophage integrin signaling: potential role for Syk kinase, J Biol Chem source
- Not checked — no full text of the sourcecites [6] AW Roberts, 1999, Deficiency of the hematopoietic cell-specific Rho family GTPase Rac2 is characterized by abnormalities in neutrophil function and host defense, Immunity source
boosteddirect- Asserted: passes — The authors put it forward as true.
- Checkable: passes — It can be checked against evidence.
- Load-bearing: fails — The paper’s conclusions may not depend on it.
- Based: passes — The paper gives a reason why it holds.
Probably not a substantial claim. The paper’s conclusions may not depend on it.
- Could not verify
The cited sources that could be checked couldn’t confirm or dispute this claim.
In the paper
“Previous findings clearly demonstrate that in the absence of Rac2, macrophages and/or neutrophils display suppressed reactive oxygen species (ROS) production, defective chemotaxis, impaired phagocytosis, and decreased microbial killing [1], [2], [6], [7], [8].”
§ Rac2 Controls Tumor Growth, Metastasis and M1-M2 Macrophage Differentiation In Vivo > Discussion
What the sources say
- Could not verifycites [1] P De, 2009, Expression of RAC2 in endothelial cells is required for the postnatal neovascular response, Exp Cell Res sourceExperimental — accuracy not yet measured
The Results discuss RAC2-dependent macrophage migration, while the paper’s experiments concern endothelial migration and neovascularization. A References entry names a study of RAC2 and neutrophil NADPH oxidase activation, but no passage in our copy reports suppressed ROS production in RAC2-deficient macrophages or neutrophils (searched: ROS, reactive oxygen species, oxidative burst, and NADPH oxidase). (LLM, conf=0.72)
- Not checked — no full text of the sourcecites [2] D Pradip, 2003, Rac2 specificity in macrophage integrin signaling: potential role for Syk kinase, J Biol Chem source
- Not checked — no full text of the sourcecites [6] AW Roberts, 1999, Deficiency of the hematopoietic cell-specific Rho family GTPase Rac2 is characterized by abnormalities in neutrophil function and host defense, Immunity source
boosteddirect- Asserted: passes — The authors put it forward as true.
- Checkable: passes — It can be checked against evidence.
- Load-bearing: fails — The paper’s conclusions may not depend on it.
- Based: passes — The paper gives a reason why it holds.
Probably not a substantial claim. The paper’s conclusions may not depend on it.
- Could not verify
The cited sources support only part of this claim — read each source’s verdict below.
In the paper
“existing literature provides evidence that MCSF signaling activates its receptor the FMS tyrosine kinase which sequentially activates PI-3 kinase and Rac in microglia and bone marrow derived cells [48], [49].”
§ Rac2 Controls Tumor Growth, Metastasis and M1-M2 Macrophage Differentiation In Vivo > Discussion
What the sources say
- Not checked — no full text of the sourcecites [48] Y Imai, 2002, Intracellular signaling in M-CSF-induced microglia activation: role of Iba1, Glia source
- Partly supportedcites [49] V Vedham, 2005, Vav activation and function as a rac guanine nucleotide exchange factor in macrophage colony-stimulating factor-induced macrophage chemotaxis, Mol Cell Biol sourceExperimental — accuracy not yet measured
The paper identifies c-fms as the M-CSF receptor and reports that M-CSF-induced Rac activation requires PI 3-kinase in bone marrow-derived macrophages (Abstract; “Macrophages lacking SHIP display elevated chemotactic responses,” page not provided). Its Animals section identifies the cells studied as bone marrow-derived macrophages; our copy does not establish the same signaling sequence in microglia. (LLM, conf=0.88)
plaindirect- Asserted: passes — The authors put it forward as true.
- Checkable: passes — It can be checked against evidence.
- Load-bearing: fails — The paper’s conclusions may not depend on it.
- Based: passes — The paper gives a reason why it holds.
Probably not a substantial claim. The paper’s conclusions may not depend on it.
The cited sources support only part of this claim — read each source’s verdict below.
In the paper
“Previous findings clearly demonstrate that in the absence of Rac2, macrophages and/or neutrophils display suppressed reactive oxygen species (ROS) production, defective chemotaxis, impaired phagocytosis, and decreased microbial killing [1], [2], [6], [7], [8].”
§ Rac2 Controls Tumor Growth, Metastasis and M1-M2 Macrophage Differentiation In Vivo > Discussion
What the sources say
- Partly supportedcites [1] P De, 2009, Expression of RAC2 in endothelial cells is required for the postnatal neovascular response, Exp Cell Res sourceExperimental — accuracy not yet measured
The Results section states that previous work found RAC2 necessary for macrophage integrin-directed migration. That supports a related migration defect, but integrin-directed migration is not the same as chemotaxis, and this paper does not report defective chemotaxis in RAC2-deficient macrophages or neutrophils. No page number is available in our copy. (LLM, conf=0.82)
- Not checked — no full text of the sourcecites [2] D Pradip, 2003, Rac2 specificity in macrophage integrin signaling: potential role for Syk kinase, J Biol Chem source
- Not checked — no full text of the sourcecites [6] AW Roberts, 1999, Deficiency of the hematopoietic cell-specific Rho family GTPase Rac2 is characterized by abnormalities in neutrophil function and host defense, Immunity source
boosteddirect- Asserted: passes — The authors put it forward as true.
- Checkable: passes — It can be checked against evidence.
- Load-bearing: fails — The paper’s conclusions may not depend on it.
- Based: passes — The paper gives a reason why it holds.
Probably not a substantial claim. The paper’s conclusions may not depend on it.
- Partly supported
The cited sources that could be checked couldn’t confirm or dispute this claim.
In the paper
“Previous findings clearly demonstrate that in the absence of Rac2, macrophages and/or neutrophils display suppressed reactive oxygen species (ROS) production, defective chemotaxis, impaired phagocytosis, and decreased microbial killing [1], [2], [6], [7], [8].”
§ Rac2 Controls Tumor Growth, Metastasis and M1-M2 Macrophage Differentiation In Vivo > Discussion
What the sources say
- Could not verifycites [1] P De, 2009, Expression of RAC2 in endothelial cells is required for the postnatal neovascular response, Exp Cell Res sourceExperimental — accuracy not yet measured
The Results section discusses RAC2-dependent macrophage migration, while the References list a study of neutrophil function and host defense. Neither passage states that Rac2-deficient macrophages or neutrophils have decreased microbial killing. Searches for microbial killing, killing, and infection found no passage addressing that outcome. (LLM, conf=0.72)
- Not checked — no full text of the sourcecites [2] D Pradip, 2003, Rac2 specificity in macrophage integrin signaling: potential role for Syk kinase, J Biol Chem source
- Not checked — no full text of the sourcecites [6] AW Roberts, 1999, Deficiency of the hematopoietic cell-specific Rho family GTPase Rac2 is characterized by abnormalities in neutrophil function and host defense, Immunity source
boosteddirect- Asserted: passes — The authors put it forward as true.
- Checkable: passes — It can be checked against evidence.
- Load-bearing: fails — The paper’s conclusions may not depend on it.
- Based: passes — The paper gives a reason why it holds.
Probably not a substantial claim. The paper’s conclusions may not depend on it.
- Could not verify
A result the paper reports from its own data — it cites no other source for it, so there is none to check. The quote shows it is in the paper.
In the paper
“In contrast, engagement of α5β1 with CH271 and α2β1 with collagen does not result in an appreciable activation of Rac2 and there is minimal migration defect on these matrix proteins observed in Rac2-/- murine macrophages (Figure 3A, right upper panel).”
§ Rac2 Controls Tumor Growth, Metastasis and M1-M2 Macrophage Differentiation In Vivo > Results > Role of Rac2 in macrophage migration, extravaseation and α4β1/CSF1 receptor signaling
plain- Asserted: passes — The authors put it forward as true.
- Checkable: passes — It can be checked against evidence.
- Load-bearing: passes — The paper’s conclusions depend on it.
- Based: passes — The paper gives a reason why it holds.
It may state two separate claims as one.
A result the paper reports from its own data — it cites no other source for it, so there is none to check. The quote shows it is in the paper.
In the paper
“Rac2-/- mice display a marked defect in tumor growth, angiogenesis and metastasis.”
- Also stated in: § Rac2 promotes tumor metastasis · plain
“marked increase in metastatic foci in the lungs of WT mice compared with an 80% reduction in the number of nodules in Rac2-/- mice injected with B16F10 melanoma (p<0.001; Figure 2A–B).”
§ Rac2 Controls Tumor Growth, Metastasis and M1-M2 Macrophage Differentiation In Vivo > Abstract
plaindirect- Asserted: passes — The authors put it forward as true.
- Checkable: passes — It can be checked against evidence.
- Load-bearing: passes — The paper’s conclusions depend on it.
- Based: passes — The paper gives a reason why it holds.
The quote only partly states this claim.
- Also stated in: § Rac2 promotes tumor metastasis · plain
A result the paper reports from its own data — it cites no other source for it, so there is none to check. The quote shows it is in the paper.
In the paper
“The analysis confirms that BMDMs isolated from WT mice express Rac2 as compared to negative result in Rac2-/- BMDMs.”
§ Rac2 Controls Tumor Growth, Metastasis and M1-M2 Macrophage Differentiation In Vivo > Results > Genomic studies on Mθs
boosted- Asserted: passes — The authors put it forward as true.
- Checkable: passes — It can be checked against evidence.
- Load-bearing: passes — The paper’s conclusions depend on it.
- Based: passes — The paper gives a reason why it holds.
It may state two separate claims as one.
A result the paper reports from its own data — it cites no other source for it, so there is none to check. The quote shows it is in the paper.
In the paper
“The right hemithorax (injected with WT BMDMs) showed luciferase activity and B16 metastatic nodules while there was no B16 melanoma or luciferase signal and minimal metastatic nodules detected within the left hemithorax (injected with WT GBMDM vs. Rac2-/- BMDM) (Figure 6E).”
§ Rac2 Controls Tumor Growth, Metastasis and M1-M2 Macrophage Differentiation In Vivo > Results > Macrophage autonomous nature of Rac2 defect in the promotion of tumor growth, metastasis and M1-M2 transition
plain- Asserted: passes — The authors put it forward as true.
- Checkable: passes — It can be checked against evidence.
- Load-bearing: passes — The paper’s conclusions depend on it.
- Based: passes — The paper gives a reason why it holds.
It may state two separate claims as one.
A result the paper reports from its own data — it cites no other source for it, so there is none to check. The quote shows it is in the paper.
In the paper
“real time PCR analysis done on macrophages cultured in MCSF (BMDM) or GMCSF (GBMDM) demonstrated that GBMDM express higher levels of proinflammatory cytokines, while BMDM express increased levels of Mgl 1 and MMR mRNA which are considered as M2 markers (Figure S4A).”
§ Rac2 Controls Tumor Growth, Metastasis and M1-M2 Macrophage Differentiation In Vivo > Results > MCSF receptor co-signals through α4β1 integrin to activate Rac2 to the GTP-bound state
boostedcorrelational- Asserted: passes — The authors put it forward as true.
- Checkable: passes — It can be checked against evidence.
- Load-bearing: passes — The paper’s conclusions depend on it.
- Based: passes — The paper gives a reason why it holds.
It may state two separate claims as one.
None of the sources cited for this claim have been checked yet.
In the paper
“we and other laboratories have confirmed that these Rac2-/- mice do not exhibit any defects in organ development.”
§ Rac2 Controls Tumor Growth, Metastasis and M1-M2 Macrophage Differentiation In Vivo > Results > Rac2 promotes tumor growth, angiogenesis and invasion
boosted- Asserted: passes — The authors put it forward as true.
- Checkable: passes — It can be checked against evidence.
- Load-bearing: fails — The paper’s conclusions may not depend on it.
- Based: passes — The paper gives a reason why it holds.
Probably not a substantial claim. The paper’s conclusions may not depend on it.
A result the paper reports from its own data — it cites no other source for it, so there is none to check. The quote shows it is in the paper.
In the paper
“we provide evidence that MCSF receptor cosignals through α4β1 integrin to promote these events by specifically activating Rac2 (Figure 6A).”
§ Rac2 Controls Tumor Growth, Metastasis and M1-M2 Macrophage Differentiation In Vivo > Discussion
boosteddirect- Asserted: passes — The authors put it forward as true.
- Checkable: passes — It can be checked against evidence.
- Load-bearing: passes — The paper’s conclusions depend on it.
- Based: passes — The paper gives a reason why it holds.
It may state two separate claims as one.
A result the paper reports from its own data — it cites no other source for it, so there is none to check. The quote shows it is in the paper.
In the paper
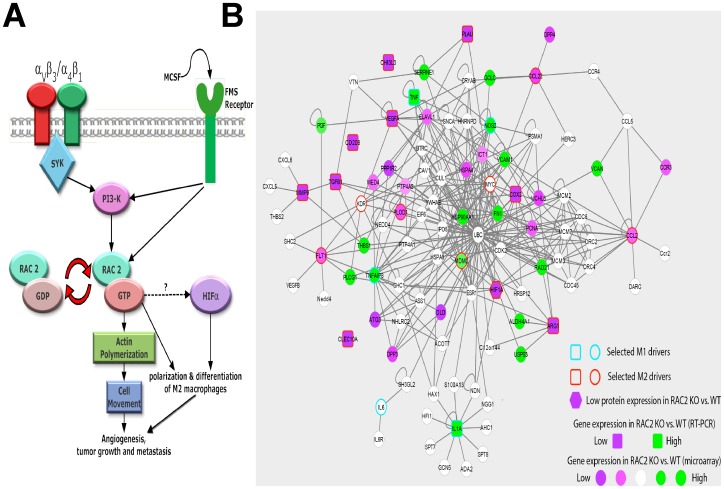
“The interaction network spanning the top 100 genes was identified and annotated with protein and gene expression changes between the Rac2-/- and WT conditions.”
§ Rac2 Controls Tumor Growth, Metastasis and M1-M2 Macrophage Differentiation In Vivo > Methods > Interactome map
plain- Asserted: passes — The authors put it forward as true.
- Checkable: passes — It can be checked against evidence.
- Load-bearing: fails — The paper’s conclusions may not depend on it.
- Based: passes — The paper gives a reason why it holds.
Probably not a substantial claim. The paper’s conclusions may not depend on it.
A result the paper reports from its own data — it cites no other source for it, so there is none to check. The quote shows it is in the paper.
In the paper
“Moreover, our results also suggest that only MCSF but not GMCSF stimulations activate Rac2 (Figure 6A).”
§ Rac2 Controls Tumor Growth, Metastasis and M1-M2 Macrophage Differentiation In Vivo > Discussion
hedgeddirect- Asserted: passes — The authors put it forward as true.
- Checkable: passes — It can be checked against evidence.
- Load-bearing: passes — The paper’s conclusions depend on it.
- Based: passes — The paper gives a reason why it holds.
It may state two separate claims as one.
A conclusion the paper draws from its own results — it cites no other source for it, so there is none to check. The quote shows it is in the paper.
In the paper
“These results further support our model that Rac2 is required to promote tumor growth, invasion, angiogenesis and metastasis potentially by promoting alternative activation of macrophages into the M2 phenotype.”
§ Rac2 Controls Tumor Growth, Metastasis and M1-M2 Macrophage Differentiation In Vivo > Results > Rac2 promotes the differentiation of macrophages into M2 phenotype in vitro and in vivo
hedgedconditional- Asserted: passes — The authors put it forward as true.
- Checkable: passes — It can be checked against evidence.
- Load-bearing: passes — The paper’s conclusions depend on it.
- Based: passes — The paper gives a reason why it holds.
It may state two separate claims as one.
A conclusion the paper draws from its own results — it cites no other source for it, so there is none to check. The quote shows it is in the paper.
In the paper
“the small GTPase, Rac2 controls macrophage M1 to M2 differentiation and the metastatic phenotype in vivo.”
§ Rac2 Controls Tumor Growth, Metastasis and M1-M2 Macrophage Differentiation In Vivo > Abstract
plaindirect- Asserted: passes — The authors put it forward as true.
- Checkable: passes — It can be checked against evidence.
- Load-bearing: passes — The paper’s conclusions depend on it.
- Based: passes — The paper gives a reason why it holds.
It may state two separate claims as one.
The paper states this without a source or data behind it here, so there is nothing to check it against. The quote shows it is in the paper.
In the paper
“A defining feature of tumor inflammation is the polarization of M1 into M2 macrophages which promotes tumor growth, angiogenesis, invasion and metastasis.”
§ Rac2 Controls Tumor Growth, Metastasis and M1-M2 Macrophage Differentiation In Vivo > Introduction
plaindirect- Asserted: passes — The authors put it forward as true.
- Checkable: passes — It can be checked against evidence.
- Load-bearing: passes — The paper’s conclusions depend on it.
- Based: passes — The paper gives a reason why it holds.
It may state two separate claims as one.
A conclusion the paper draws from its own results — it cites no other source for it, so there is none to check. The quote shows it is in the paper.
In the paper
“from our data in Rac2-/- mice, we conclude that macrophage entry into the tumor is likely necessary but not sufficient to drive M1 to M2 differentiation of TAMs.”
§ Rac2 Controls Tumor Growth, Metastasis and M1-M2 Macrophage Differentiation In Vivo > Results > Role of Rac2 in macrophage migration, extravaseation and α4β1/CSF1 receptor signaling
hedgedconditional- Asserted: passes — The authors put it forward as true.
- Checkable: passes — It can be checked against evidence.
- Load-bearing: passes — The paper’s conclusions depend on it.
- Based: passes — The paper gives a reason why it holds.
It may state two separate claims as one.
A conclusion the paper draws from its own results — it cites no other source for it, so there is none to check. The quote shows it is in the paper.
In the paper
“Our current results establish that the Rac2 GTPase controls tumor growth, invasion and metastasis and that Rac2 is activated downstream of the α4β1integrin, the CSF1 receptor and that Rac2 is required for macrophage differentiation.”
§ Rac2 Controls Tumor Growth, Metastasis and M1-M2 Macrophage Differentiation In Vivo > Results > MCSF receptor co-signals through α4β1 integrin to activate Rac2 to the GTP-bound state
boosteddirect- Asserted: passes — The authors put it forward as true.
- Checkable: passes — It can be checked against evidence.
- Load-bearing: passes — The paper’s conclusions depend on it.
- Based: passes — The paper gives a reason why it holds.
It may state two separate claims as one.
A conclusion the paper draws from its own results — it cites no other source for it, so there is none to check. The quote shows it is in the paper.
In the paper
“Our current results establish that the Rac2 GTPase controls tumor growth, invasion and metastasis and that Rac2 is activated downstream of the α4β1integrin, the CSF1 receptor and that Rac2 is required for macrophage differentiation.”
§ Rac2 Controls Tumor Growth, Metastasis and M1-M2 Macrophage Differentiation In Vivo > Results > MCSF receptor co-signals through α4β1 integrin to activate Rac2 to the GTP-bound state
boosteddirect- Asserted: passes — The authors put it forward as true.
- Checkable: passes — It can be checked against evidence.
- Load-bearing: passes — The paper’s conclusions depend on it.
- Based: passes — The paper gives a reason why it holds.
It may state two separate claims as one.
In the paper
“We transduced a nonmyeloid cell, COS7 which expresses Rac1 and α4β1 but not Rac2 or Syk kinase with Syk and/or Rac2 and were able to determine that Syk was necessary and sufficient to convert α4β1 integrin dependent migration in COS7 cells to Rac2 dependency [2].”
§ Rac2 Controls Tumor Growth, Metastasis and M1-M2 Macrophage Differentiation In Vivo > Discussion
What the sources say
- Not checked — no full text of the sourcecites [2] D Pradip, 2003, Rac2 specificity in macrophage integrin signaling: potential role for Syk kinase, J Biol Chem source
plaindirect- Asserted: passes — The authors put it forward as true.
- Checkable: passes — It can be checked against evidence.
- Load-bearing: passes — The paper’s conclusions depend on it.
- Based: passes — The paper gives a reason why it holds.
It may state two separate claims as one.
A conclusion the paper draws from its own results — it cites no other source for it, so there is none to check. The quote shows it is in the paper.
In the paper
“Figure 7A shows a schematic representation of the signaling pathway elucidated in this report. The pathway extends from the cell surface receptors MCSF receptor and integrin α4β1 to the activation of the Rac2 to control differentiation of M2 macrophage differentiation, tumor growth and metastasis in vivo.”
§ Rac2 Controls Tumor Growth, Metastasis and M1-M2 Macrophage Differentiation In Vivo > Results > Macrophage autonomous nature of Rac2 defect in the promotion of tumor growth, metastasis and M1-M2 transition
plaindirect- Asserted: passes — The authors put it forward as true.
- Checkable: passes — It can be checked against evidence.
- Load-bearing: passes — The paper’s conclusions depend on it.
- Based: passes — The paper gives a reason why it holds.
It may state two separate claims as one.
A claim is checked only against the cited paper’s full text, never its abstract, and none is available for its sources.
In the paper
“In contrast, M2 macrophages are involved in polarized Th2 inflammatory reactions and characterized by expression of arginase-1 and mannose and scavenger receptors [19], [20].”
§ Rac2 Controls Tumor Growth, Metastasis and M1-M2 Macrophage Differentiation In Vivo > Introduction
What the sources say
plaincorrelational- Asserted: passes — The authors put it forward as true.
- Checkable: passes — It can be checked against evidence.
- Load-bearing: fails — The paper’s conclusions may not depend on it.
- Based: passes — The paper gives a reason why it holds.
Probably not a substantial claim. The paper’s conclusions may not depend on it. It may state two separate claims as one.
In the paper
“Previous work from our laboratory demonstrated that specific α4β1 and αvβ3/αvβ5 integrin directed migration in macrophages requires Syk and Rac2 [2].”
§ Rac2 Controls Tumor Growth, Metastasis and M1-M2 Macrophage Differentiation In Vivo > Results > Role of Rac2 in macrophage migration, extravaseation and α4β1/CSF1 receptor signaling
What the sources say
- Not checked — no full text of the sourcecites [2] D Pradip, 2003, Rac2 specificity in macrophage integrin signaling: potential role for Syk kinase, J Biol Chem source
boosteddirect- Asserted: passes — The authors put it forward as true.
- Checkable: passes — It can be checked against evidence.
- Load-bearing: passes — The paper’s conclusions depend on it.
- Based: passes — The paper gives a reason why it holds.
Probably not a substantial claim.
A conclusion the paper draws from its own results — it cites no other source for it, so there is none to check. The quote shows it is in the paper.
In the paper
“independently support RT-PCR results generated in our knockout models that WT and Rac2-/- BMDMs are M2 and M1 skewed, respectively.”
§ Rac2 Controls Tumor Growth, Metastasis and M1-M2 Macrophage Differentiation In Vivo > Results > Genomic studies on Mθs
plaincorrelational- Asserted: passes — The authors put it forward as true.
- Checkable: passes — It can be checked against evidence.
- Load-bearing: passes — The paper’s conclusions depend on it.
- Based: passes — The paper gives a reason why it holds.
It may state two separate claims as one.
A claim is checked only against the cited paper’s full text, never its abstract, and none is available for its sources.
In the paper
“This was an important distinction since in other knockout models e.g. VEGF-/- and +/- mice were embryonic lethal or associated with profound defects in vasculogenesis and developmental angiogenesis [44], [45].”
§ Rac2 Controls Tumor Growth, Metastasis and M1-M2 Macrophage Differentiation In Vivo > Discussion
What the sources say
- Not checked — no full text of the sourcecites [44] GH Fong, 1995, Role of the Flt-1 receptor tyrosine kinase in regulating the assembly of vascular endothelium, Nature source
- Not checked — no full text of the sourcecites [45] F Shalaby, 1995, Failure of blood-island formation and vasculogenesis in Flk-1-deficient mice, Nature source
plaincorrelational- Asserted: passes — The authors put it forward as true.
- Checkable: passes — It can be checked against evidence.
- Load-bearing: passes — The paper’s conclusions depend on it.
- Based: passes — The paper gives a reason why it holds.
Probably not a substantial claim. It may state two separate claims as one.
In the paper
“M1 macrophages are IL-12high, IL-23high, IL-10low; produce high levels of inducible nitric oxide synthetase (iNOS); secrete inflammatory cytokines such as IL-1β, IL-6, and TNF; and are inducer and effector cells in Th1 type inflammatory responses [19].”
§ Rac2 Controls Tumor Growth, Metastasis and M1-M2 Macrophage Differentiation In Vivo > Introduction
What the sources say
- Not checked — no full text of the sourcecites [19] A Mantovani, 2005, Macrophage polarization comes of age, Immunity source
plain- Asserted: passes — The authors put it forward as true.
- Checkable: passes — It can be checked against evidence.
- Load-bearing: fails — The paper’s conclusions may not depend on it.
- Based: passes — The paper gives a reason why it holds.
Probably not a substantial claim. The paper’s conclusions may not depend on it. It may state two separate claims as one.
In the paper
“Lawrence et al has suggested that MCSF receptor activates IRF4 transcription factor to promote M2 differentiation of macrophages [37].”
§ Rac2 Controls Tumor Growth, Metastasis and M1-M2 Macrophage Differentiation In Vivo > Results > MCSF receptor co-signals through α4β1 integrin to activate Rac2 to the GTP-bound state
What the sources say
- Not checked — no full text of the sourcecites [37] T Lawrence, 2011, Transcriptional regulation of macrophage polarization: enabling diversity with identity, Nat Rev Immunol source
hedgeddirect- Asserted: passes — The authors put it forward as true.
- Checkable: passes — It can be checked against evidence.
- Load-bearing: fails — The paper’s conclusions may not depend on it.
- Based: passes — The paper gives a reason why it holds.
Probably not a substantial claim. The paper’s conclusions may not depend on it.
In the paper
“The ComBat method [57] was then used to remove the batch effect.”
§ Rac2 Controls Tumor Growth, Metastasis and M1-M2 Macrophage Differentiation In Vivo > Methods > Microarray analysis
What the sources say
- Not checked — no full text of the sourcecites [57] WE Johnson, 2007, Adjusting batch effects in microarray expression data using empirical Bayes methods, Biostatistics source
plaindirect- Asserted: passes — The authors put it forward as true.
- Checkable: passes — It can be checked against evidence.
- Load-bearing: fails — The paper’s conclusions may not depend on it.
- Based: passes — The paper gives a reason why it holds.
Probably not a substantial claim. The paper’s conclusions may not depend on it.
In the paper
“which are considered as M2 markers [33].”
§ Rac2 Controls Tumor Growth, Metastasis and M1-M2 Macrophage Differentiation In Vivo > Discussion
What the sources say
- Not checked — no full text of the sourcecites [33] A Mantovani, 2004, The chemokine system in diverse forms of macrophage activation and polarization, Trends Immunol source
plaincorrelational- Asserted: passes — The authors put it forward as true.
- Checkable: passes — It can be checked against evidence.
- Load-bearing: passes — The paper’s conclusions depend on it.
- Based: passes — The paper gives a reason why it holds.
Probably not a substantial claim.
What the paper did — it cites no source for this, so there is none to check. The quote shows it is in the paper.
In the paper
“All cells were cultured in DMEM media containing 10% FBS and tested for mycoplasma before implanting in animals.”
§ Rac2 Controls Tumor Growth, Metastasis and M1-M2 Macrophage Differentiation In Vivo > Methods > In vivo tumor experiments
plain- Asserted: passes — The authors put it forward as true.
- Checkable: passes — It can be checked against evidence.
- Load-bearing: fails — The paper’s conclusions may not depend on it.
- Based: passes — The paper gives a reason why it holds.
Probably not a substantial claim. The paper’s conclusions may not depend on it.
What the paper did — it cites no source for this, so there is none to check. The quote shows it is in the paper.
In the paper
“All procedures involving animals were approved by the University of California San Diego Animal Care Committee, which serves to ensure that all federal guidelines concerning animal experimentation are met.”
§ Rac2 Controls Tumor Growth, Metastasis and M1-M2 Macrophage Differentiation In Vivo > Methods > Animal studies
plain- Asserted: passes — The authors put it forward as true.
- Checkable: passes — It can be checked against evidence.
- Load-bearing: fails — The paper’s conclusions may not depend on it.
- Based: passes — The paper gives a reason why it holds.
Probably not a substantial claim. The paper’s conclusions may not depend on it.
What the paper did — it cites no source for this, so there is none to check. The quote shows it is in the paper.
In the paper
“All samples demonstrated RNA integrity (RIN) of 7 or greater.”
§ Rac2 Controls Tumor Growth, Metastasis and M1-M2 Macrophage Differentiation In Vivo > Methods > Microarray analysis
plain- Asserted: passes — The authors put it forward as true.
- Checkable: passes — It can be checked against evidence.
- Load-bearing: fails — The paper’s conclusions may not depend on it.
- Based: passes — The paper gives a reason why it holds.
Probably not a substantial claim. The paper’s conclusions may not depend on it.
A conclusion the paper draws from its own results — it cites no other source for it, so there is none to check. The quote shows it is in the paper.
In the paper
“Importantly, malignant tumors have found a way to co-op this mechanism for M2 macrophage transition as an important component of tumor progression.”
§ Rac2 Controls Tumor Growth, Metastasis and M1-M2 Macrophage Differentiation In Vivo > Discussion
plaindirect- Asserted: passes — The authors put it forward as true.
- Checkable: passes — It can be checked against evidence.
- Load-bearing: passes — The paper’s conclusions depend on it.
- Based: fails — The paper may give no reason why it holds.
Probably not a substantial claim. The paper may give no reason why it holds.
- Rests on an assumption: The coordinate regulation of the macrophage transcriptomic program downstream of CSF1R/α4β1 stimulation required for the complex physiologic transition from M1 to M2 remains unclear.
A conclusion the paper draws from its own results — it cites no other source for it, so there is none to check. The quote shows it is in the paper.
In the paper
“In the present study, we provide a novel role of macrophage Rac2 in controlling tumor growth and M2 macrophage differentiation.”
§ Rac2 Controls Tumor Growth, Metastasis and M1-M2 Macrophage Differentiation In Vivo > Discussion
plaindirect- Asserted: passes — The authors put it forward as true.
- Checkable: passes — It can be checked against evidence.
- Load-bearing: passes — The paper’s conclusions depend on it.
- Based: passes — The paper gives a reason why it holds.
It may state two separate claims as one.
- Rests on an assumption: The molecular entities involved in the global rearrangement of the transcriptional profile during alternative macrophage activation are still largely unknown.
What the paper did — it cites no source for this, so there is none to check. The quote shows it is in the paper.
In the paper
“All tumor experiments were performed three to four times with n = 8-10.”
§ Rac2 Controls Tumor Growth, Metastasis and M1-M2 Macrophage Differentiation In Vivo > Methods > In vivo tumor experiments
plainn = 8- Asserted: passes — The authors put it forward as true.
- Checkable: passes — It can be checked against evidence.
- Load-bearing: fails — The paper’s conclusions may not depend on it.
- Based: passes — The paper gives a reason why it holds.
Probably not a substantial claim. The paper’s conclusions may not depend on it. It may state two separate claims as one.
What the paper did — it cites no source for this, so there is none to check. The quote shows it is in the paper.
In the paper
“The BMDMs and GBMDMs injected in the mice were 90% viable, as determined by trypan blue and replating a small aliquot of cells, at the time of injection.”
§ Rac2 Controls Tumor Growth, Metastasis and M1-M2 Macrophage Differentiation In Vivo > Methods > Macrophage injection experiments to establish Mθ-autonomous control of tumor growth, metastasis and M1-M2 transition
plain- Asserted: passes — The authors put it forward as true.
- Checkable: passes — It can be checked against evidence.
- Load-bearing: fails — The paper’s conclusions may not depend on it.
- Based: passes — The paper gives a reason why it holds.
Probably not a substantial claim. The paper’s conclusions may not depend on it.
In the paper
“a study by Faccio et al has illustrated that M-CSF stimulation induces association between CSF-1 receptor (FMS) and αVβ3 integrin in osteoclasts [36].”
§ Rac2 Controls Tumor Growth, Metastasis and M1-M2 Macrophage Differentiation In Vivo > Discussion
What the sources say
- Not checked — no full text of the sourcecites [36] CL Elsegood, 2006, M-CSF induces the stable interaction of cFms with alphaVbeta3 integrin in osteoclasts, Int J Biochem Cell Biol source
plaindirect- Asserted: passes — The authors put it forward as true.
- Checkable: passes — It can be checked against evidence.
- Load-bearing: fails — The paper’s conclusions may not depend on it.
- Based: passes — The paper gives a reason why it holds.
Probably not a substantial claim. The paper’s conclusions may not depend on it.
The paper relies on this without support.
The α4Y991A knock-in mutation specifically disrupts α4β1 integrin signaling relevant to Rac2 activation and does not have confounding effects on other pathways.
“We next examined if α4Y991A knock-in mice bearing a point mutation in α4 integrin tail (Y991A), has any defect in activating Rac2.”
“We observed that the α4Y991A k/in mice are defective in tumor growth (p<0.001), polarization of macrophages and metastasis (by 90%, p<0.001) (Figure 3B–D).”
The paper relies on this without support.
The molecular entities involved in the global rearrangement of the transcriptional profile during alternative macrophage activation are still largely unknown.
“Despite considerable progress, the molecular entities involved in the global rearrangement of the transcriptional profile occurring during alternative macrophage activation are still largely unknown.”
The paper relies on this without support.
The coordinate regulation of the macrophage transcriptomic program downstream of CSF1R/α4β1 stimulation required for the complex physiologic transition from M1 to M2 remains unclear.
“The coordinate regulation of the macrophage transcriptomic program downstream of CSF1R/α4β1 stimulation is required for the complex physiologic transition from M1 to M2 remains unclear.”
The paper relies on this without support.
There is no literature on the interaction of CSF-1 receptor and α4β1 integrin.
“Although there is no literature on the interaction of CSF-1 receptor and α4β1 integrin”
Self-check
Percentages, sums and reported differences re-computed from the paper’s own numbers.
Each contradiction between two passages listed here was confirmed by an independent check.
Rated major: it would touch a result — a value a result rests on, reported and recomputed p-values on opposite sides of the significance level, two passages that conflict with no sign which is right, or a cited work retracted before this paper was published.
In the paper
§ Rac2 Controls Tumor Growth, Metastasis and M1-M2 Macrophage Differentiation In Vivo > Results > Macrophage autonomous nature of Rac2 defect in the promotion of tumor growth, metastasis and M1-M2 transition
“The above experiments were done with 5-6 daily injections of 1×10⁶ macrophages through tail vein, followed by tail vein challenge with 5×10⁵ B16F10 melanoma cells on day 5.”
§ Rac2 Controls Tumor Growth, Metastasis and M1-M2 Macrophage Differentiation In Vivo > Results > MCSF receptor co-signals through α4β1 integrin to activate Rac2 to the GTP-bound state
“One dose of 1 million BMDMs or GBMDMs were given to Rac2-/- mice two days before inoculating 5×10⁵ B16F10 cells intravenously followed by treatment with 1 million BMDM or GBMDM every third day, lungs were harvested on day 15.”
Rated minor: it would not touch a result — a value no result rests on, a p-value that stays on the same side of the significance level, or a conflict that is clerical, resolved elsewhere in the paper, or outside its own findings.
In the paper
§ Rac2 Controls Tumor Growth, Metastasis and M1-M2 Macrophage Differentiation In Vivo > Results > Role of Rac2 in macrophage migration, extravaseation and α4β1/CSF1 receptor signaling
“this small GTPase, which is specifically expressed in the hematopoietic compartment”
§ Rac2 Controls Tumor Growth, Metastasis and M1-M2 Macrophage Differentiation In Vivo > Introduction
“Rac2 is only expressed in hematopoietic and endothelial cells whereas Rac1 and Rac3 are ubiquitously expressed in mammalian systems”
Rated minor: it would not touch a result — a value no result rests on, a p-value that stays on the same side of the significance level, or a conflict that is clerical, resolved elsewhere in the paper, or outside its own findings.
In the paper
§ Rac2 Controls Tumor Growth, Metastasis and M1-M2 Macrophage Differentiation In Vivo > Results > MCSF receptor co-signals through α4β1 integrin to activate Rac2 to the GTP-bound state
“After 5 days of LLC tumor inoculation, Rac2-/- mice were treated either with 1 million WT BMDMs or GBMDMs or Rac2-/- BMDMs or every third day, until tumors were removed on day 21.”
§ Rac2 Controls Tumor Growth, Metastasis and M1-M2 Macrophage Differentiation In Vivo > Methods > Macrophage injection experiments to establish Mθ-autonomous control of tumor growth, metastasis and M1-M2 transition
“1 million WT or Rac2-/- BMDM were injected every third day until tumors were harvested on 25 day.”
Rated minor: it would not touch a result — a value no result rests on, a p-value that stays on the same side of the significance level, or a conflict that is clerical, resolved elsewhere in the paper, or outside its own findings.
In the paper
§ Rac2 Controls Tumor Growth, Metastasis and M1-M2 Macrophage Differentiation In Vivo > Results > Role of Rac2 in macrophage migration, extravaseation and α4β1/CSF1 receptor signaling
“the effects of Rac2 deficiency on α4β1 vs. α5β1 dependent macrophage migration. In contrast, engagement of α5β1 with CH271 and α2β1 with collagen does not result in an appreciable activation of Rac2 and there is minimal migration defect on these matrix proteins observed in Rac2-/- murine macrophages (Figure 3A, right upper panel).”
§ Rac2 Controls Tumor Growth, Metastasis and M1-M2 Macrophage Differentiation In Vivo > Results > Role of Rac2 in macrophage migration, extravaseation and α4β1/CSF1 receptor signaling
“(A) Left panel shows BMDMs from WT, and Rac2-/- mice were tested in haptotaxis assay for capacity to migrate on different matrix proteins or fragments of fibronectin”
Rated minor: it would not touch a result — a value no result rests on, a p-value that stays on the same side of the significance level, or a conflict that is clerical, resolved elsewhere in the paper, or outside its own findings.
In the paper
§ Rac2 Controls Tumor Growth, Metastasis and M1-M2 Macrophage Differentiation In Vivo > Results > Macrophage autonomous nature of Rac2 defect in the promotion of tumor growth, metastasis and M1-M2 transition
“The above experiments were done with 5-6 daily injections of 1×10⁶ macrophages through tail vein, followed by tail vein challenge with 5×10⁵ B16F10 melanoma cells on day 5. Under these conditions, WT and not Rac2-/- Mθ injections lead to reversal of tumor growth defect in Rac2-/- mice in vivo (Figure 6 B-C).”
§ Rac2 Controls Tumor Growth, Metastasis and M1-M2 Macrophage Differentiation In Vivo > Results > MCSF receptor co-signals through α4β1 integrin to activate Rac2 to the GTP-bound state
“(B & C) Tumor volume (B) and mass (C) of LLC tumors grown in Rac2-/- mice treated with or without 1 million WT BMDMs or Rac2-/- BMDMs or WT GBMDMs.”
Citations
Cites
Subramanian, A., Tamayo, P., Mootha, V. K., Mukherjee, S., Ebert, B. L., Gillette, M. A., Paulovich, A., Pomeroy, S. L., Golub, T. R., Lander, E. S., et al. (2005) · Proceedings of the National Academy of Sciences · doi:10.1073/pnas.0506580102 · Cited by 53,625 · cited 1×
“For microarray data analysis, we conducted GSEA analysis [31] using the KEGG (Kyoto Encyclopedia of Genes and Genomes) database [32].”
MethodAnalyzing real-time PCR data by the comparative CT method
Schmittgen, T. D., & Livak, K. J. (2008) · Nature Protocols · doi:10.1038/nprot.2008.73 · Cited by 26,190 · cited 1×
“[56].”
Smyth, G. K. (2004) · Statistical Applications in Genetics and Molecular Biology · doi:10.2202/1544-6115.1027 · Cited by 11,829
Exploring the full spectrum of macrophage activation
Mosser, D. M., & Edwards, J. P. (2008) · Nature Reviews Immunology · doi:10.1038/nri2448 · Cited by 9,144 · cited 1×
“of heterogeneity and plasticity and a number of diverse phenotypes under different physiologic and pathologic conditions [21].”
BackgroundAdjusting batch effects in microarray expression data using empirical Bayes methods
Johnson, W. E., Li, C., & Rabinovic, A. (2007) · Biostatistics · doi:10.1093/biostatistics/kxj037 · Cited by 8,658 · cited 1×
“The ComBat method [57] was then used to remove the batch effect.”
MethodThe chemokine system in diverse forms of macrophage activation and polarization
MANTOVANI, A., SICA, A., SOZZANI, S., ALLAVENA, P., VECCHI, A., & LOCATI, M. (2004) · Trends in Immunology · doi:10.1016/j.it.2004.09.015 · Cited by 6,534 · cited 4×
“Rac2-/- BMDMs included prototypic M2 markers; CCL2, CCL22 [33], and genes with high expression in Rac2-/- BMDMs included prototypic M1 Figure 2.”
BackgroundMethodInfluentialMANTOVANI, A., SOZZANI, S., LOCATI, M., ALLAVENA, P., & SICA, A. (2002) · Trends in Immunology · doi:10.1016/s1471-4906(02)02302-5 · Cited by 5,528 · cited 1×
“We first curated M1 and M2 driver lists based on support in literature [19,33,59] and our experimental multiple-omic data.”
MethodProtective and pathogenic functions of macrophage subsets
Murray, P. J., & Wynn, T. A. (2011) · Nature Reviews Immunology · doi:10.1038/nri3073 · Cited by 5,269 · cited 1×
“Therefore, investigators have suggested that Mh differentiation is best represented as a bidirectional continuum and not by just two defined subgroups, M1 and M2 [22].”
BackgroundMonocyte and macrophage heterogeneity
Gordon, S., & Taylor, P. R. (2005) · Nature Reviews Immunology · doi:10.1038/nri1733 · Cited by 5,190 · cited 1×
“In contrast, M2 macrophages are involved in polarized Th2 inflammatory reactions and characterized by expression of arginase-1 and mannose and scavenger receptors [19,20].”
BackgroundKEGG for integration and interpretation of large-scale molecular data sets
Kanehisa, M., Goto, S., Sato, Y., Furumichi, M., & Tanabe, M. (2012) · Nucleic Acids Research · doi:10.1093/nar/gkr988 · Cited by 4,848 · cited 1×
“For microarray data analysis, we conducted GSEA analysis [31] using the KEGG (Kyoto Encyclopedia of Genes and Genomes) database [32].”
Method
Cited by
Sorted by citations
Items 101–128 of 128
Hu, D., Cai, Y., He, L., et al. (2023) · Journal of Cancer · doi:10.7150/jca.79967 · Cited by 3
“Our results implied that increased numbers of M1 macrophages might be converted into M2 macrophages as reserve cells during OSCC progression [30].”
ResultMigration, invasion, and metastasis are mediated by P-Rex1 in neuroblastoma
Jacobson, J. C., Qiao, J., Cochran, E. D., et al. (2024) · Frontiers in Oncology · doi:10.3389/fonc.2024.1336031 · Cited by 3
Gupta, A., Bhardwaj, S., Ghorai, S., et al. (2025) · The Journal of Liquid Biopsy · doi:10.1016/j.jlb.2025.100287 · Cited by 3
“All 6 genes have been implicated individually in tumor progression earlier, designated as potential markers in various cancers and have shown higher expression in tumors when compared to normal samples in public datasets [26 – 28].”
Exosome Load Increases Systemically and Mediates Pro-tumoral M2 Macrophage Polarization in LymphomaPreprint
Syeda, S., Rawat, K., & Shrivastava, A. (2023) · Preprints.org · doi:10.20944/preprints202304.0062.v1 · Cited by 3
Farhana, F., Sakai, E., Koyanagi, Y., Yamaguchi, Y., Alam, M. I., Okamoto, K., & Tsukuba, T. (2023) · Molecular Biology Reports · doi:10.1007/s11033-023-08690-0 · Cited by 2
Sun, Z., Guo, X., Li, C., et al. (2024) · Journal of the Science of Food and Agriculture · doi:10.1002/jsfa.13664 · Cited by 2
Joldes, C., Jimbu, L., Mesaros, O., Zdrenghea, M., & Fetică, B. (2025) · Biomedicines · doi:10.3390/biomedicines13051099 · Cited by 2
“Also, in DLBCL, M2 can alter the extracellular matrix, causing fibronectin deterioration and increasing angiogenesis [40].”
Peng, D., Meng, C., Zuo, G., Shan, S., Gao, C., & Zhao, G. (2016) · Genes & Genomics · doi:10.1007/s13258-016-0385-7 · Cited by 2
“had reported that RAC2 could control M1-M2 macrophage differentiation (Joshi et al. 2014).”
BackgroundDa-Huang-Fu-Zi-Tang Ameliorates Severe Acute Pancreatitis by Elevation of M2 Kupffer Cells in Rats
Song, Y., Wang, Y., Qi, X., Kang, X., & Lu, X. (2021) · Evidence-based Complementary and Alternative Medicine · doi:10.1155/2021/5561216 · Cited by 2
“Relying on pattern recognition receptors (PRR), the KCs can differentiate into M1 and M2 two different types under different stimulations [4, 5].”
BackgroundEljaszewicz, A., Jankowski, M., Wiese‐Szadkowska, M., Gackowska, L., Michałkiewicz, J., Zegarski, W., & Moniuszko, M. (2018) · Współczesna Onkologia · doi:10.5114/wo.2018.73881 · Cited by 2
“of inflammatory monocytes but also the transition of macrophages from classically activated (M1) to pro-tumoral (M2) cells, by Rac2 activation [19].”
BackgroundChoo, H. S., Yu, T., Pham, T., Singh, N., & Joshi, S. (2026) · Frontiers in Immunology · doi:10.3389/fimmu.2026.1773622 · Cited by 1
“Importantly, spleen tyrosine kinase (SYK), has recently been shown to modulate macrophage responses (33 – 35).”
Self-citationMacrophage-directed therapeutic strategies in cancer
Joshi, S., & Varner, J. A. (2026) · Trends in cancer · doi:10.1016/j.trecan.2026.08.006 · Cited by 1
Self-citationYang, C., shi, S., Su, Y., Tong, J., & Li, L. (2020) · doi:10.21203/rs.3.rs-27043/v1 · Cited by 1
Chen, Y., Zhang, X., Li, D., et al. (2023) · Research Square · doi:10.21203/rs.3.rs-2461425/v1 · Cited by 1
Phenotypical and Functional Characterization of Polarized Human Macrophages
Iqbal, S. (2015) · uO Research (University of Ottawa) · doi:10.20381/ruor-2744
Harder, J. W. (2021) · ThinkIR: The University of Louisville's Institutional Repository (University of Louisville) · doi:10.18297/etd/3585
Lionakis, M. S. (2020) · Faculty Opinions – Post-Publication Peer Review of the Biomedical Literature · doi:10.3410/f.727458344.793572027
Research progress on the correlation between platelet aggregation and tumor progression.
Chen, Y., Yuan, J., Tang, F., Liu, Q., Huang, H., Liu, H., & Liu, H. (2024) · PubMed · doi:10.14670/hh-18-646
Rohila, D., Park, I. H., Pham, T. V., Weitz, J., de Mendoza, T. H., Madheswaran, S., Ishfaq, M., Beaman, C., Tapia, E., Sun, S., et al. (2023) · doi:10.1158/0008-5472.c.6780359.v1
Self-citationGupta, A., Ahmed, R., Agarwal, S. K., et al. (2024) · bioRxiv (Cold Spring Harbor Laboratory) · doi:10.1101/2024.05.09.593454
“All have been implicated in tumor progression earlier and showed higher expression in tumors when compared to normal samples in public datasets (20–22).”
BackgroundSyeda, S., Rawat, K., Khan, S., & Shrivastava, A. (2025) · Medical Oncology · doi:10.1007/s12032-025-03173-7
Guan, X., Li, Y., Long, M., Lou, Y., Li, H., Yuan, Y., Li, F., & Xiong, W. (2026) · Journal of the Renin-Angiotensin-Aldosterone System · doi:10.1177/14703203251414308
Azad, A. K. M., Shiddiky, M. J. A., & Moni, M. A. (2026) · bioRxiv (Cold Spring Harbor Laboratory) · doi:10.64898/2026.02.22.707324
Characterization of a novel antibody targeting tumor-associated macrophages
Domagala, M. (2022) · theses.fr (ABES) · doi:10.70675/b4720b22z5236z4e41za89dz1f8d16c27670
Krishnaiah, M., Yada, B., McHale, C. C., Pal, D., Singh, S. K., Chhonker, Y. S., Murry, D. J., Soto‐Pantoja, D. R., & Durden, D. L. (2026) · European Journal of Medicinal Chemistry · doi:10.1016/j.ejmech.2026.118944
Self-citation
Metadata
- Authors
- Joshi, S., Singh, A. R., Zulcic, M., Bao, L., Messer, K., Ideker, T., Dutkowski, J., & Durden, D. L.
- Affiliations
- University of California San Diego (US)
- Corresponding author
- Durden, Donald L.
- Venue
- PLoS ONE
- Publisher
- Public Library of Science (PLoS)
- Published
- 2014-04-25
- Volume
- 9
- Issue
- 4
- Pages
- e95893
- ISSN
- 1932-6203 (ISSN-L)
- PMC
- PMC4000195
- OpenAlex
- W2058100343
- Cited by
- 128
- References
- 66
- Citations by year
- 2026: 5 · 2025: 11 · 2024: 16 · 2023: 12 · 2022: 6 · 2021: 7 · 2020: 12 · 2019: 14 · 2018: 13 · 2017: 11 · 2016: 9 · 2015: 8 · 2014: 4
- FWCI
- 4.15
- Type
- journal article
- Language
- en
- Open access
- gold
- doi.org
- Locations
- PLoS ONE (publishedVersion, cc-by)
- PubMed (publishedVersion)
- Europe PMC (PubMed Central) (submittedVersion, other-oa)
- PubMed Central (submittedVersion, cc-by)
- DOAJ (DOAJ: Directory of Open Access Journals) (submittedVersion)
- eScholarship (California Digital Library) (submittedVersion)
- eScholarship (California Digital Library) (submittedVersion, cc-by)
- Figshare (submittedVersion, cc-by)
- Funders
- National Institutes of Health (CA23100, CA94233, HL091385)
- University of California, San Diego (P30 CA23100)
- National Heart, Lung, and Blood Institute (R21 HL091385, HL091385)
- National Cancer Institute (CA94233-09, R01 CA094233, P30CA023100, P30 CA23100-22, R56 CA094233)
- Topics
- Life Sciences › Immunology and Microbiology › Immunology › Immune cells in cancer
- Health Sciences › Medicine › Oncology › Cancer Cells and Metastasis
- Life Sciences › Biochemistry, Genetics and Molecular Biology › Molecular Biology › Mechanisms of cancer metastasis
- Keywords
- Rac2, small GTPases, tumor-associated macrophages, macrophage polarization, macrophage differentiation, metastasis, tumor growth, angiogenesis, alpha4beta1 integrin, macrophage colony-stimulating factor receptor, extracellular matrix signaling, bone marrow-derived macrophages, protein-protein interaction network, systems biology
- MeSH terms
- RAC2 GTP-Binding Protein, Animals, Cell Differentiation, Enzyme Activation, Lung Neoplasms, Macrophages, Melanoma, Experimental, Mice, Inbred C57BL, Neoplasm Invasiveness, Neoplasm Transplantation, Neovascularization, Pathologic, Signal Transduction, Receptor, Macrophage Colony-Stimulating Factor, Mice, Knockout, Platelet Endothelial Cell Adhesion Molecule-1, rac GTP-Binding Proteins, Integrin alpha4beta1, Cell Line, Tumor, Tumor Burden
About these checks
Registry, retraction, Cites and statistics results are computed, not judged, with one exception: a printed reference that no index lists is read once by a model before it counts as a citation error. Claims are extracted by a model and kept only when their quote appears verbatim in the text; each cited source is then checked, with a model’s help, for whether it says what the claim relies on. Those verdicts can be wrong — read the claim’s quote and the cited source before relying on one.
A language model drew the claims from the paper on 2026-10-19, under version 3 of the claim definition (model deepseek-v4.1-flash, prompt extract-v3).
A second model labelled each claim on 2026-10-19 (model jev-1.13-20260917, definition revision gold-guideline-v0.2).
Cited sources are checked with a language model’s help (gpt-6-sol).
Statistics and arithmetic are recomputed, not judged.
Confidence bands are shown only for fields calibrated on our annotated test set. None is calibrated yet, so no band is shown.
What counts as a claim ›How we measure confidence ›How we check this ›
Are you an author, or do you see a problem with this page? Request a review
