

The DOI matches its Crossref record; 18 of the 18 references it cites were found in a registry or an index.
Omega-3 Free Fatty Acids Suppress Macrophage Inflammasome Activation by Inhibiting NF-κB Activation and Enhancing Autophagy
Open accessAbstract
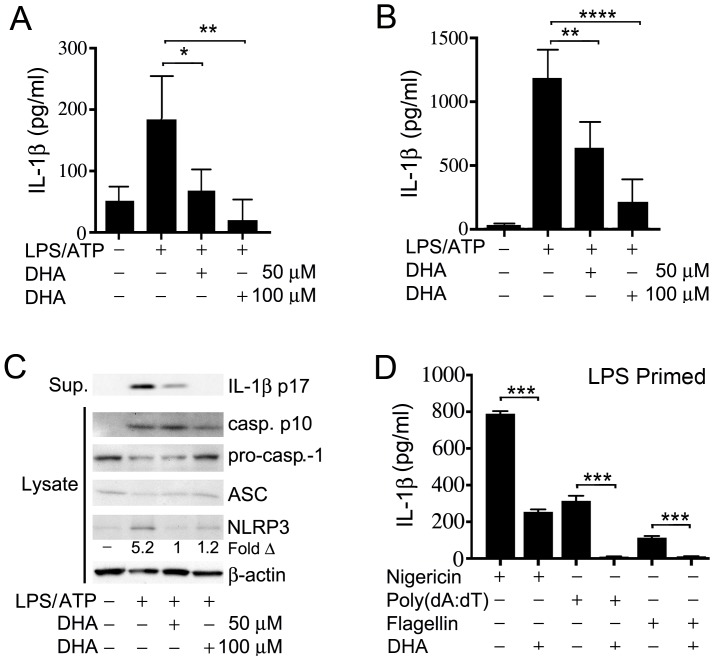
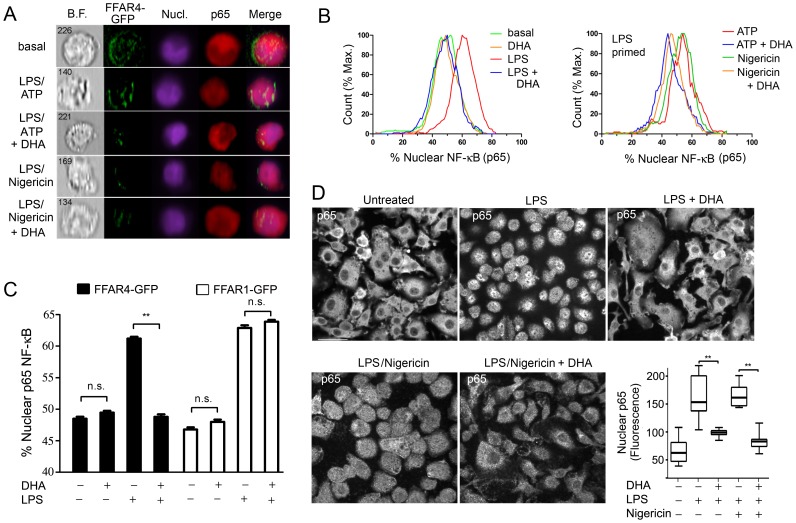
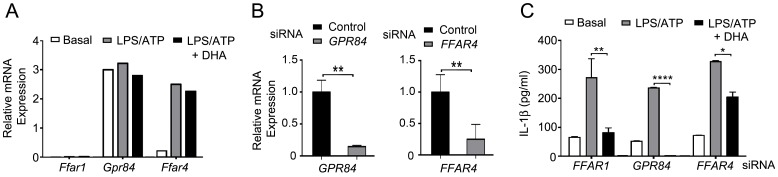
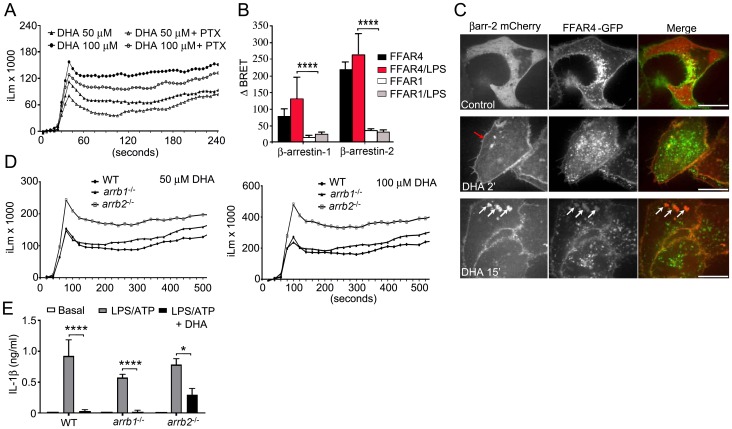
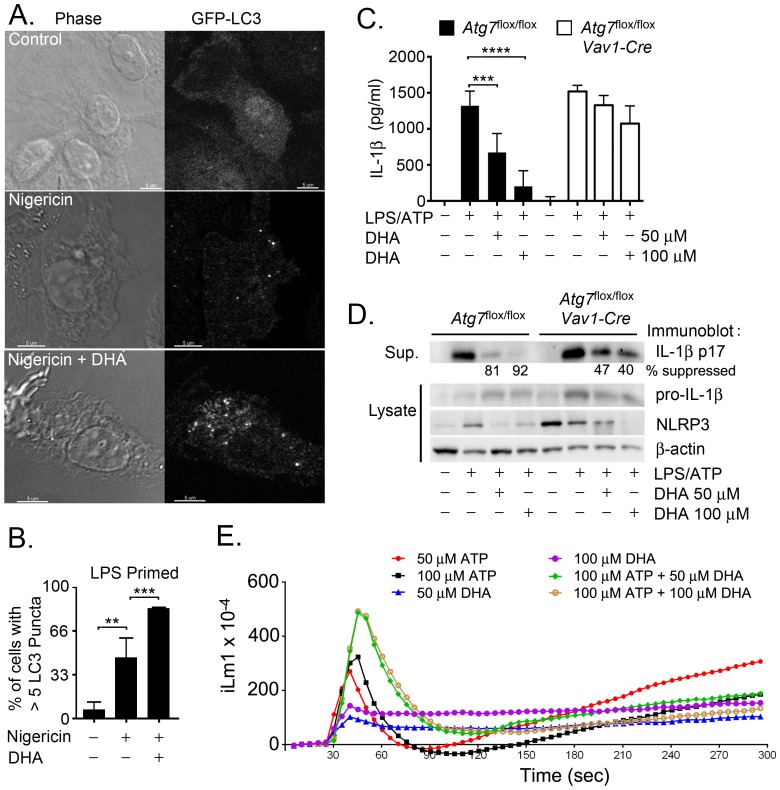
The omega-3 (ω3) fatty acid docosahexaenoic acid (DHA) can suppress inflammation, specifically IL-1β production through poorly understood molecular mechanisms. Here, we show that DHA reduces macrophage IL-1β production by limiting inflammasome activation. Exposure to DHA reduced IL-1β production by ligands that stimulate the NLRP3, AIM2, and NAIP5/NLRC4 inflammasomes. The inhibition required Free Fatty Acid Receptor (FFAR) 4 (also known as GPR120), a G-protein coupled receptor (GPR) known to bind DHA. The exposure of cells to DHA recruited the adapter protein β-arrestin1/2 to FFAR4, but not to a related lipid receptor. DHA treatment reduced the initial inflammasome priming step by suppressing the nuclear translocation of NF-κB. DHA also reduced IL-1β levels by enhancing autophagy in the cells. As a consequence macrophages derived from mice lacking the essential autophagy protein ATG7 were partially resistant to suppressive effects of DHA. Thus, DHA suppresses inflammasome activation by two distinct mechanisms, inhibiting the initial priming step and by augmenting autophagy, which limits inflammasome activity.
Overview
The claims and statistics of this paper haven’t been checked yet.
Run the check — free, no account needed. It reads the open-access text and checks the sources it cites.
Integrity signals
Registry
Cites
Statistics
Figures
Verification
Claims the paper makes
The claims and statistics of this paper haven’t been checked yet.
Run the check — free, no account needed. It reads the open-access text and checks the sources it cites.
Claims other papers make about this one
Each is checked against this paper’s own text: does it say what the citing paper says it does?
In the citing paper
“n-3 PUFAs, in addition to modulating eicosanoid synthesis, can also inhibit the activation of NFκB in skeletal muscle cells and other cell types in vitro (see Section 2.3) [69,70,71,72].”
From Potential Roles of n-3 PUFAs during Skeletal Muscle Growth and Regeneration (2018) · cites this paper as [71]
Self-check
Percentages, sums and reported differences re-computed from the paper’s own numbers.
The self-check needs the paper’s full text.
Citations
Cites
Schroder, K., & Tschopp, J. (2010) · Cell · doi:10.1016/j.cell.2010.01.040 · Cited by 5,475
Bauernfeind, F. G., Horvath, G. L., Stutz, A., Alnemri, E. S., MacDonald, K. L., Speert, D. P., Fernandes‐Alnemri, T., Wu, J., Monks, B. G., Fitzgerald, K. A., et al. (2009) · The Journal of Immunology · doi:10.4049/jimmunol.0901363 · Cited by 3,087
Oh, D. Y., Talukdar, S., Bae, E. J., Imamura, T., Morinaga, H., Fan, W., Li, P., Lu, W. J., Watkins, S. M., & Olefsky, J. M. (2010) · Cell · doi:10.1016/j.cell.2010.07.041 · Cited by 2,428
Fatty acid–induced NLRP3-ASC inflammasome activation interferes with insulin signaling
Wen, H., Gris, D., Lei, Y., Jha, S., Zhang, L., Huang, M. T.-H., Brickey, W. J., & Ting, J. P.-Y. (2011) · Nature Immunology · doi:10.1038/ni.2022 · Cited by 1,698
Shi, C.-S., Shenderov, K., Huang, N.-N., Kabat, J., Abu-Asab, M., Fitzgerald, K. A., Sher, A., & Kehrl, J. H. (2012) · Nature Immunology · doi:10.1038/ni.2215 · Cited by 1,367
Self-citationThe role of β-arrestins in the termination and transduction of G-protein-coupled receptor signals
Luttrell, L. M., & Lefkowitz, R. J. (2002) · Journal of Cell Science · doi:10.1242/jcs.115.3.455 · Cited by 1,123
Yan, Y., Jiang, W., Spinetti, T., Tardivel, A., Castillo, R., Bourquin, C., Guarda, G., Tian, Z., Tschopp, J., & Zhou, R. (2013) · Immunity · doi:10.1016/j.immuni.2013.05.015 · Cited by 784
Csak, T., Ganz, M., Pespisa, J., Kodys, K., Dolganiuc, A., & Szabo, G. (2011) · Hepatology · doi:10.1002/hep.24341 · Cited by 645
Mortensen, M., Ferguson, D. J. P., Edelmann, M. J., Kessler, B. M., Morten, K., Komatsu, M., & Simon, A. K. (2009) · Proceedings of the National Academy of Sciences · doi:10.1073/pnas.0913170107 · Cited by 400
Kiecolt-Glaser, J. K., Belury, M. A., Andridge, R., Malarkey, W. B., Hwang, B. S., & Glaser, R. (2012) · Brain, Behavior, and Immunity · doi:10.1016/j.bbi.2012.05.011 · Cited by 233
Cited by
Sorted by citations
NLRP3 Inflammasome and the IL-1 Pathway in Atherosclerosis
Grebe, A., Hoss, F., & Latz, E. (2018) · Circulation Research · doi:10.1161/circresaha.118.311362 · Cited by 926
Metabolic control of autophagy
Galluzzi, L., Pietrocola, F., Levine, B., & Kroemer, G. (2014) · Cell · doi:10.1016/j.cell.2014.11.006 · Cited by 855
Cao, X. (2015) · Nature reviews. Immunology · doi:10.1038/nri.2015.8 · Cited by 671
Effects of Omega-3 Fatty Acids on Immune Cells
Gutiérrez, S., Svahn, S. L., & Johansson, M. E. (2019) · International Journal of Molecular Sciences · doi:10.3390/ijms20205028 · Cited by 525
Fu, Y., Wang, Y., Gao, H., Li, D., Jiang, R., Ge, L., Tong, C., & Xu, K. (2021) · Mediators of Inflammation · doi:10.1155/2021/8879227 · Cited by 368
Metadata
- Authors
- Williams-Bey, Y., Boularan, C., Vural, A., Huang, N.-N., Hwang, I.-Y., Shan-Shi, C., & Kehrl, J. H.
- Affiliations
- National Institutes of Health (US)
- Corresponding author
- Kehrl, John H.
- Venue
- PLoS ONE
- Publisher
- Public Library of Science (PLoS)
- Published
- 2014-06-09
- Volume
- 9
- Issue
- 6
- Pages
- e97957
- ISSN
- 1932-6203 (ISSN-L)
- PMC
- PMC4049592
- OpenAlex
- W2062456565
- Cited by
- 215
- References
- 18
- Citations by year
- 2026: 15 · 2025: 12 · 2024: 10 · 2023: 11 · 2022: 19 · 2021: 28 · 2020: 23 · 2019: 13 · 2018: 19 · 2017: 19 · 2016: 21 · 2015: 23 · 2014: 2
- FWCI
- 8.88
- Type
- journal article
- Language
- en
- Open access
- gold
- doi.org
- Licence
- Locations
- PLoS ONE (publishedVersion, cc-by)
- PubMed Central (publishedVersion, cc-by)
- PubMed (publishedVersion)
- DOAJ (DOAJ: Directory of Open Access Journals) (submittedVersion)
- Funders
- National Institutes of Health
- National Institute of Allergy and Infectious Diseases
- Topics
- Life Sciences › Biochemistry, Genetics and Molecular Biology › Molecular Biology › Inflammasome and immune disorders
- Health Sciences › Nursing › Nutrition and Dietetics › Fatty Acid Research and Health
- Life Sciences › Immunology and Microbiology › Immunology › Immune Response and Inflammation
- Keywords
- docosahexaenoic acid, omega-3 fatty acids, macrophages, inflammasome activation, IL-1β production, NLRP3 inflammasome, AIM2 inflammasome, free fatty acid receptor 4, GPR120, NF-κB nuclear translocation, autophagy, ATG7
- MeSH terms
- beta-Arrestins, Animals, Autophagy, Bone Marrow Cells, Calcium, Cell Nucleus, Docosahexaenoic Acids, Gene Expression Regulation, HeLa Cells, Humans, Lipopolysaccharides, Macrophage Activation, Macrophages, Mice, Inbred C57BL, NF-kappa B, Arrestins, Active Transport, Cell Nucleus, Intracellular Space, Receptors, G-Protein-Coupled, Mice, Interleukin-1beta, Inflammasomes
About these checks
Registry, retraction, Cites and statistics results are computed, not judged, with one exception: a printed reference that no index lists is read once by a model before it counts as a citation error. Claims are extracted by a model and kept only when their quote appears verbatim in the text; each cited source is then checked, with a model’s help, for whether it says what the claim relies on. Those verdicts can be wrong — read the claim’s quote and the cited source before relying on one.
Statistics and arithmetic are recomputed, not judged.
Confidence bands are shown only for fields calibrated on our annotated test set. None is calibrated yet, so no band is shown.
What counts as a claim ›How we measure confidence ›How we check this ›
Are you an author, or do you see a problem with this page? Request a review
