

The DOI matches its Crossref record; 60 of the 60 references it cites were found in a registry or an index.
Chronic Exposure to Perfluorooctane Sulfonate Induces Behavior Defects and Neurotoxicity through Oxidative Damages, In Vivo and In Vitro
Open accessAbstract
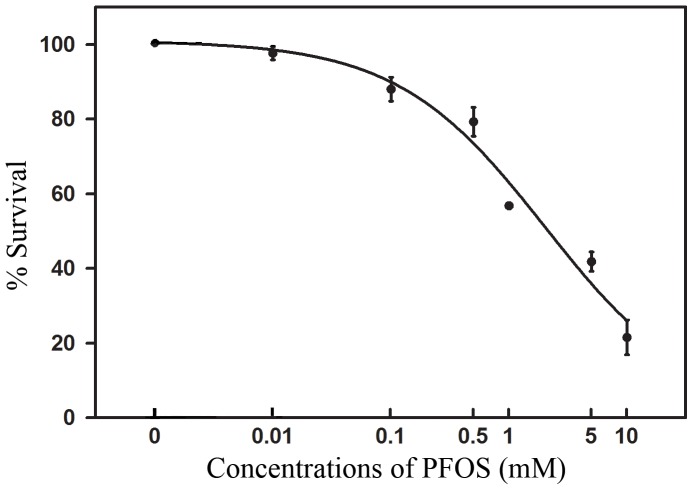
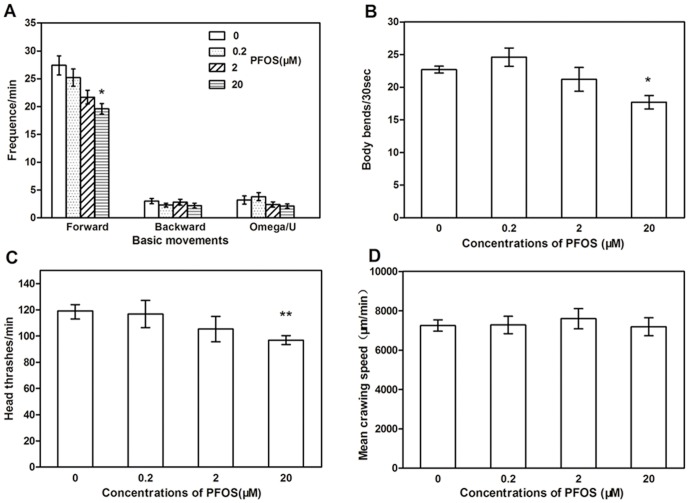
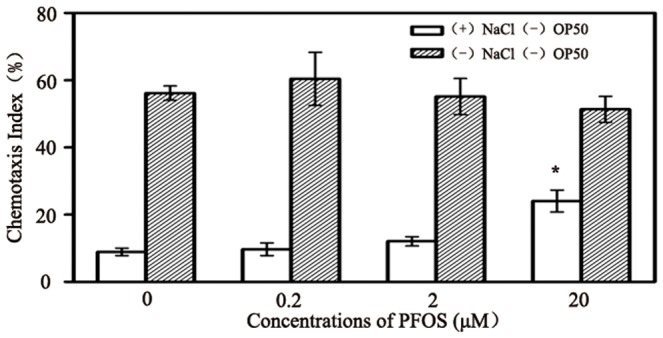
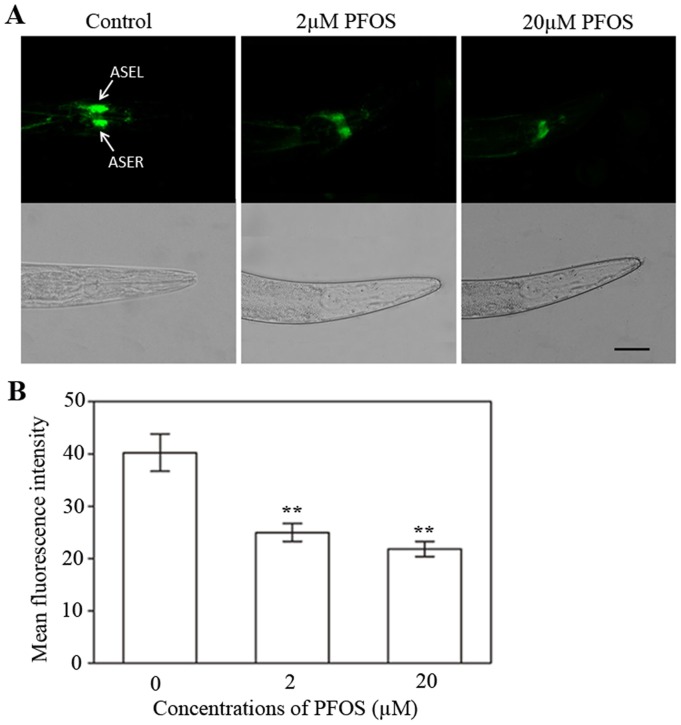
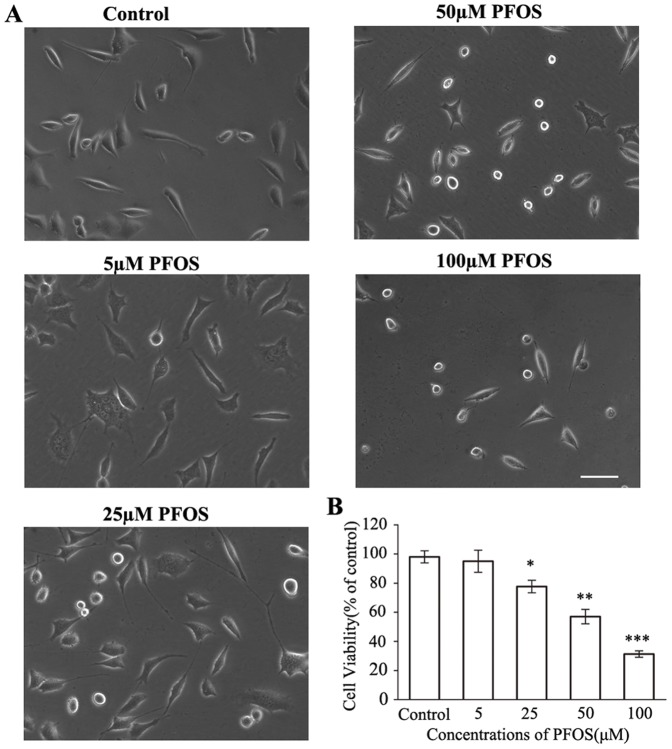
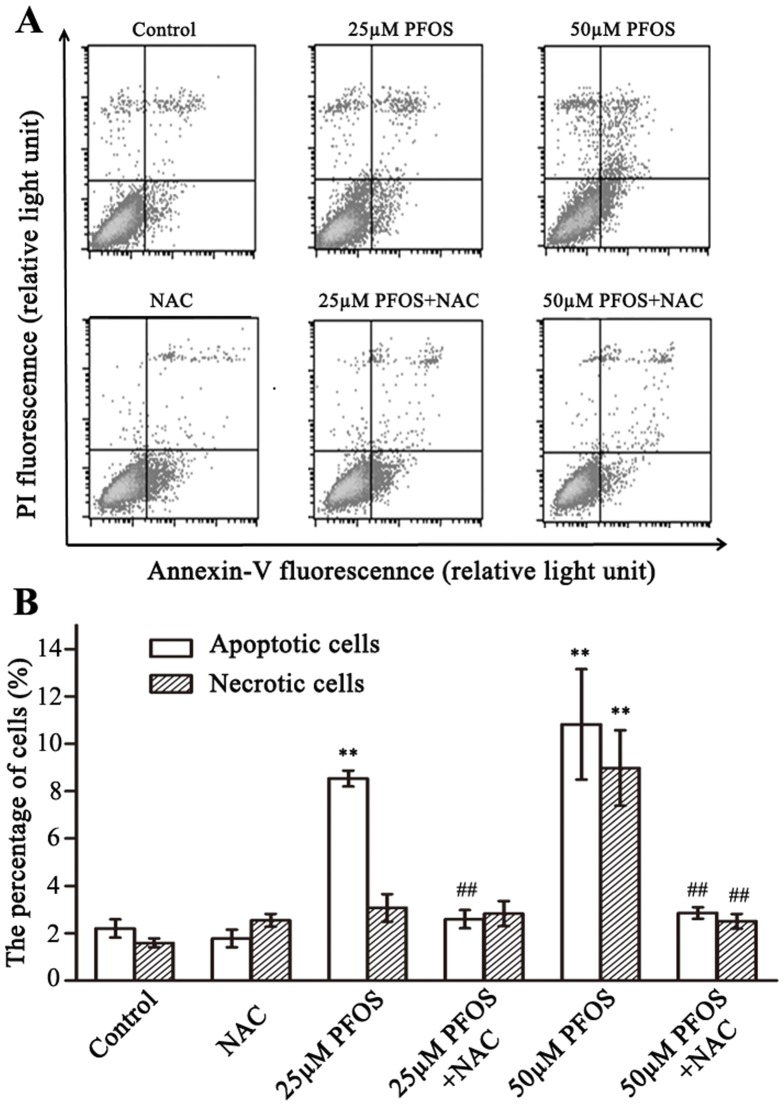
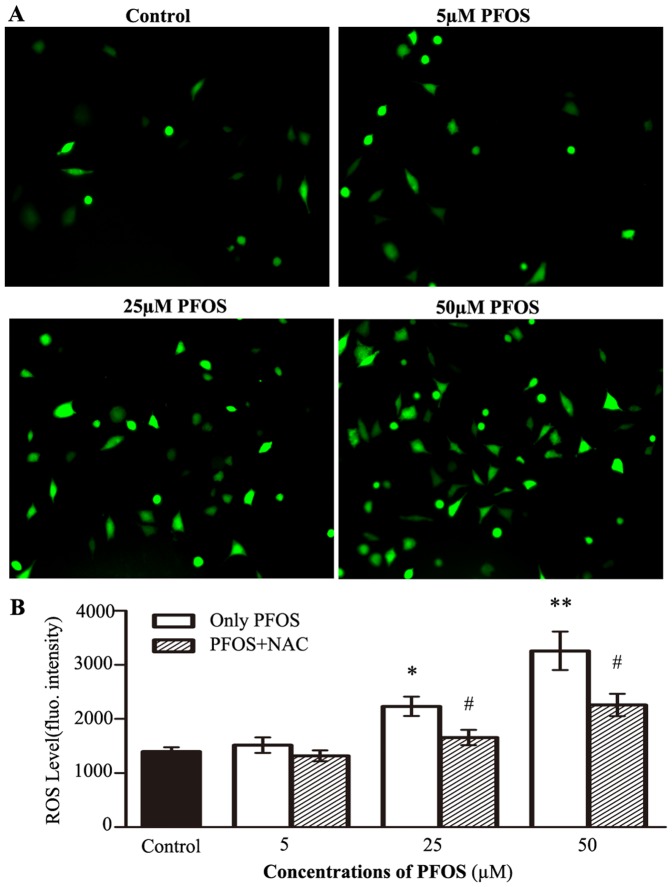
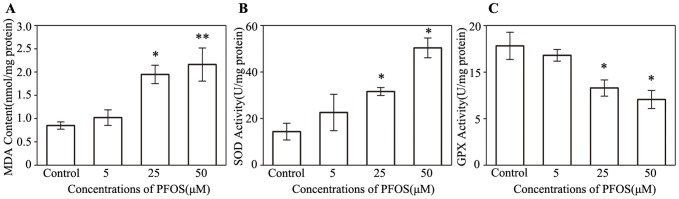
Perfluorooctane sulfonate (PFOS) is an emerging persistent pollutant which shows multiple adverse health effects. However, the neurotoxicity of PFOS and its mechanisms have not been fully elucidated. Using a combination of in vivo and in vitro methods, the present study provides a detailed description of PFOS-induced neurotoxicity. Results showed that the median lethal concentration of PFOS was 2.03 mM in Caenorhabditis elegans for 48 h exposure. 20 µM PFOS caused decrease of locomotor behaviors including forward movement, body bend and head thrash. Additionally, PFOS exposure reduced chemotaxis index of C. elegans, which indicates the decline of chemotaxis learning ability. Using green fluorescent protein (GFP) labelled transgenic strains, we found that PFOS caused down-regulated expression of a chemoreceptor gene, gcy-5, in ASE chemosensory neurons, but did not affect cholinergic neurons and dopaminergic neurons. In SH-SY5Y cells, 48 h exposure to 25 µM and 50 µM PFOS induced cell damage, apoptosis and the reactive oxygen species (ROS) generation. PFOS caused significant increases of lipid peroxidation and superoxide dismutase activity, but an actual decrease of glutathione peroxidase activity. Furthermore, antioxidant N-acetylcysteine rescued cells from PFOS-induced apoptosis via blocking ROS. Our results demonstrate that chronic exposure to PFOS can cause obvious neurotoxicity and behavior defects. Oxidative damage and anti-oxidative deficit are crucial mechanisms in neurotoxicity of PFOS.
Overview
The claims and statistics of this paper haven’t been checked yet.
Run the check — free, no account needed. It reads the open-access text and checks the sources it cites.
Integrity signals
Registry
Cites
Statistics
Figures
Verification
Claims the paper makes
The claims and statistics of this paper haven’t been checked yet.
Run the check — free, no account needed. It reads the open-access text and checks the sources it cites.
Claims other papers make about this one
Each is checked against this paper’s own text: does it say what the citing paper says it does?
The source backs part of the claim, not all of it — or backs it for a different population, condition or comparison.
In the citing paper
“Whereas this actin filament remodeling has only been demonstrated in response to PFOS exposure, several other in vitro studies have also demonstrated the ability of PFOS, PFOA, and PFOSA, to generate ROS in neurons and astrocytes (Lee et al., 2012; Reistad et al., 2013; Chen et al., 2014; Li Z. et al., 2017).”
From A Critical Review and Meta-Analysis of Impacts of Per- and Polyfluorinated Substances on the Brain and Behavior (2022) · cites this paper as Chen et al., 2014
Experimental — accuracy not yet measuredThe source backs part of the claim, not all of it — or backs it for a different population, condition or comparison.
In the citing paper
“finding that 20 μM PFOS in culture medium reduced learning ability (Chen et al., 2014).”
From A Critical Review and Meta-Analysis of Impacts of Per- and Polyfluorinated Substances on the Brain and Behavior (2022) · cites this paper as Chen et al., 2014
Experimental — accuracy not yet measuredThe cited source says what the claim attributes to it.
In the citing paper
“Furthermore, PFOS exposure caused down-regulation of gcy-5, a gene that encodes chemoreceptors in amphidial chemosensory (ASE) neurons, which are essential for the assayed chemotaxis behavior (Chen et al., 2014).”
From A Critical Review and Meta-Analysis of Impacts of Per- and Polyfluorinated Substances on the Brain and Behavior (2022) · cites this paper as Chen et al., 2014
Self-check
Percentages, sums and reported differences re-computed from the paper’s own numbers.
The self-check needs the paper’s full text.
Citations
Cites
THE GENETICS OF CAENORHABDITIS ELEGANS
Brenner, S. (1974) · Genetics · doi:10.1093/genetics/77.1.71 · Cited by 15,220
Global Distribution of Perfluorooctane Sulfonate in Wildlife
Giesy, J. P., & Kannan, K. (2001) · Environmental Science & Technology · doi:10.1021/es001834k · Cited by 2,750
Perfluoroalkyl Acids: A Review of Monitoring and Toxicological Findings
Lau, C., Anitole, K., Hodes, C., Lai, D., Pfahles-Hutchens, A., & Seed, J. (2007) · Toxicological Sciences · doi:10.1093/toxsci/kfm128 · Cited by 2,620
Finding function in novel targets: C. elegans as a model organism
Kaletta, T., & Hengartner, M. O. (2006) · Nature Reviews Drug Discovery · doi:10.1038/nrd2031 · Cited by 1,152
Caenorhabditis elegans: An Emerging Model in Biomedical and Environmental Toxicology
Leung, M. C. K., Williams, P. L., Benedetto, A., Au, C., Helmcke, K. J., Aschner, M., & Meyer, J. N. (2008) · Toxicological Sciences · doi:10.1093/toxsci/kfn121 · Cited by 1,055
Bargmann, C. I., & Horvitz, H. R. (1991) · Neuron · doi:10.1016/0896-6273(91)90276-6 · Cited by 740
Identification of Long-Chain Perfluorinated Acids in Biota from the Canadian Arctic
Martin, J. W., Smithwick, M., Braune, B. M., Hoekstra, P. F., Muir, D. C. G., & Mabury, S. A. (2003) · Environmental Science & Technology · doi:10.1021/es034727+ · Cited by 675
Quantitative Characterization of Trace Levels of PFOS and PFOA in the Tennessee River
Hansen, K. J., Johnson, H. O., Eldridge, J. S., Butenhoff, J. L., & Dick, L. A. (2002) · Environmental Science & Technology · doi:10.1021/es010780r · Cited by 546
Calafat, A., Kuklenyik, Z., Reidy, J., Caudill, S., Tully, J. S., & Needham, L. (2007) · Environmental Science and Technology · doi:10.1021/es062686m · Cited by 468
Basic Caenorhabditis elegans Methods: Synchronization and Observation
Porta-de-la-Riva, M., Fontrodona, L., Villanueva, A., & Cerón, J. (2012) · Journal of Visualized Experiments · doi:10.3791/4019 · Cited by 464
Cited by
Sorted by citations
Assessing the human health risks of perfluorooctane sulfonate by in vivo and in vitro studies
Zeng, Z., Song, B., Xiao, R., Zeng, G., Gong, J., Chen, M., Xu, P., Zhang, P., Shen, M., & Yi, H. (2019) · Environment International · doi:10.1016/j.envint.2019.03.002 · Cited by 306
Environmental impacts, exposure pathways, and health effects of PFOA and PFOS
Wee, S. Y., & Aris, A. Z. (2023) · Ecotoxicology and Environmental Safety · doi:10.1016/j.ecoenv.2023.115663 · Cited by 301
Lopez-Suarez, L., Awabdh, S. A., Coumoul, X., & Chauvet, C. (2022) · NeuroToxicology · doi:10.1016/j.neuro.2022.07.008 · Cited by 265
Ojo, A. F., Peng, C., & Ng, J. C. (2021) · Journal of Hazardous Materials · doi:10.1016/j.jhazmat.2020.124863 · Cited by 221
Neurodevelopmental Disorders and Environmental Toxicants: Epigenetics as an Underlying Mechanism
Tran, N. Q. V., & Miyake, K. (2017) · International Journal of Genomics · doi:10.1155/2017/7526592 · Cited by 189
Starnes, H. M., Rock, K. D., Jackson, T. W., & Belcher, S. M. (2022) · Frontiers in Toxicology · doi:10.3389/ftox.2022.881584 · Cited by 166
Ojo, A. F., Peng, C., & Ng, J. C. (2020) · Environmental Pollution · doi:10.1016/j.envpol.2020.114182 · Cited by 139
Foguth, R. M., Flynn, R. W., de Perre, C., Iacchetta, M., Lee, L. S., Sepúlveda, M. S., & Cannon, J. R. (2019) · Toxicology and Applied Pharmacology · doi:10.1016/j.taap.2019.114623 · Cited by 103
Li, P., Xu, T., Wu, S., Lei, L., & He, D. (2017) · Journal of Applied Toxicology · doi:10.1002/jat.3468 · Cited by 101
Perfluorooctane Sulfonate (PFOS) Produces Dopaminergic Neuropathology in Caenorhabditis elegans
Sammi, S. R., Foguth, R. M., Nieves, C. S., De Perre, C., Wipf, P., McMurray, C. T., Lee, L. S., & Cannon, J. R. (2019) · Toxicological Sciences · doi:10.1093/toxsci/kfz191 · Cited by 93
Tukker, A. M., Bouwman, L. M. S., van Kleef, R. G. D. M., Hendriks, H. S., Legler, J., & Westerink, R. H. S. (2020) · Scientific Reports · doi:10.1038/s41598-020-62152-2 · Cited by 94
Neurotoxicity of per- and polyfluoroalkyl substances: Evidence and future directions
Bharal, B., Ruchitha, C., Kumar, P., Pandey, R., Rachamalla, M., Niyogi, S., Naidu, R., & Kaundal, R. K. (2024) · The Science of The Total Environment · doi:10.1016/j.scitotenv.2024.176941 · Cited by 95
Lee, H., Sung, E. J., Seo, S., Min, E. K., Lee, J., Shim, I., Kim, P., Kim, T., Lee, S., & Kim, K. (2021) · Environment International · doi:10.1016/j.envint.2021.106802 · Cited by 86
Behavioral deficits and neural damage of Caenorhabditis elegans induced by three rare earth elements
Xu, T., Zhang, M., Hu, J., Li, Z., Wu, T., Bao, J., Wu, S., Lei, L., & He, D. (2017) · Chemosphere · doi:10.1016/j.chemosphere.2017.04.068 · Cited by 76
Bernardini, I., Matozzo, V., Valsecchi, S. M., Peruzza, L., Rovere, G. D., Polesello, S., Iori, S., Marin, M. G., Fabrello, J., Ciscato, M., et al. (2021) · Environment International · doi:10.1016/j.envint.2021.106484 · Cited by 75
Foguth, R. M., Sepúlveda, M. S., & Cannon, J. R. (2020) · Toxics · doi:10.3390/toxics8020042 · Cited by 70
Li, Z., Liu, Q., Liu, C., Li, C., Li, Y., Li, S., Liu, X., & Shao, J. (2016) · Toxicology in Vitro · doi:10.1016/j.tiv.2016.11.002 · Cited by 65
Xu, T., Li, P., Wu, S., Lei, L., & He, D. (2016) · Toxicology Research · doi:10.1039/c6tx00306k · Cited by 64
Neurotoxic effects of perfluoroalkyl acids: Neurobehavioral deficit and its molecular mechanism
Wang, Y., Wang, L., Chang, W., Zhang, Y., Zhang, Y., & Liu, W. (2019) · Toxicology Letters · doi:10.1016/j.toxlet.2019.01.012 · Cited by 65
Foguth, R. M., Hoskins, T. D., Clark, G. C., Nelson, M. D., Flynn, R. W., de Perre, C., Hoverman, J. T., Lee, L., Sepúlveda, M. S., & Cannon, J. R. (2020) · Neurotoxicology and Teratology · doi:10.1016/j.ntt.2020.106907 · Cited by 60
Metabolic profiling in human SH-SY5Y neuronal cells exposed to perfluorooctanoic acid (PFOA)
Souders, C. L., Sanchez, C. L., Malphurs, W. L., Aristizabal‐Henao, J. J., Bowden, J. A., & Martyniuk, C. J. (2021) · NeuroToxicology · doi:10.1016/j.neuro.2021.05.009 · Cited by 56
PFOS Disturbs BDNF-ERK-CREB Signalling in Association with Increased MicroRNA-22 in SH-SY5Y Cells
Li, W., He, Q., Wu, C., Pan, X., Wang, J., Tan, Y., Shan, X., & Zeng, H. (2015) · BioMed Research International · doi:10.1155/2015/302653 · Cited by 58
Nrf2 Signaling Elicits a Neuroprotective Role Against PFOS-mediated Oxidative Damage and Apoptosis
Sun, P., Nie, X., Chen, X., Yin, L., Luo, J., Sun, L., Wan, C., & Jiang, S. (2018) · Neurochemical Research · doi:10.1007/s11064-018-2672-y · Cited by 57
Li, S., Qin, S., Zeng, H., Chou, W., Oudin, A., Kanninen, K. M., Jalava, P., Dong, G., & Zeng, X. (2024) · Eco-Environment & Health · doi:10.1016/j.eehl.2024.08.002 · Cited by 54
Berntsen, H. F., Bjørklund, C. G., Audinot, J., Hofer, T., Verhaegen, S., Lentzen, E., Gutleb, A. C., & Ropstad, E. (2017) · NeuroToxicology · doi:10.1016/j.neuro.2017.09.005 · Cited by 49
ROS-mediated apoptosis of HAPI microglia through p53 signaling following PFOS exposure
Ge, J., Wang, C., Nie, X., Yang, J., Lu, H., Song, X., Su, K., Li, T., Han, J., Zhang, Y., et al. (2016) · Environmental Toxicology and Pharmacology · doi:10.1016/j.etap.2016.06.025 · Cited by 47
Ecological risk assessment for perfluorooctanoic acid in soil using a species sensitivity approach
Kwak, J. I., Lee, T.-Y., Seo, H., Kim, D., Kim, D., Cui, R., & An, Y. (2019) · Journal of Hazardous Materials · doi:10.1016/j.jhazmat.2019.121150 · Cited by 45
Pandey, T., Sammi, S. R., Nooreen, Z., Mishra, A., Ahmad, A., Bhatta, R. S., & Pandey, R. (2019) · Experimental Gerontology · doi:10.1016/j.exger.2019.02.016 · Cited by 44
Bioanalytical Applications of Microextraction Techniques: A Review of Reviews
Jalili, V., Barkhordari, A., & Ghiasvand, A. (2020) · Chromatographia · doi:10.1007/s10337-020-03884-1 · Cited by 40
Ojo, A. F., Peng, C., & Ng, J. C. (2022) · Journal of Hazardous Materials · doi:10.1016/j.jhazmat.2021.126827 · Cited by 39
Perfluorooctane sulfonate mediates secretion of IL-1β through PI3K/AKT NF-кB pathway in astrocytes
Chen, X., Nie, X., Mao, J., Zhang, Y., Yin, K., Sun, P., Luo, J., Liu, Y., Jiang, S., & Sun, L. (2018) · Neurotoxicology and Teratology · doi:10.1016/j.ntt.2018.03.004 · Cited by 37
Oseguera-López, I., Pérez‐Cerezales, S., Ortiz‐Sánchez, P. B., Mondragón-Payne, O., Sánchez, R. S., Jiménez‐Morales, I., Fierro, R., & González‐Márquez, H. (2020) · Animals · doi:10.3390/ani10101934 · Cited by 37
Kim, J. H., Moon, N., Ji, E. S., & Moon, H. (2023) · Environmental Science and Pollution Research · doi:10.1007/s11356-023-29292-0 · Cited by 36
Connexin 43 mediates PFOS-induced apoptosis in astrocytes
Dong, L., Yang, X., Gu, W., Zhao, K., Ge, H., Zhou, J., & Bai, X. (2015) · Chemosphere · doi:10.1016/j.chemosphere.2015.02.041 · Cited by 36
Olajide, O. J., Enaibe, B. U., Bankole, O. O., Akinola, O. B., Laoye, B. J., & Ogundele, O. M. (2015) · Metabolic Brain Disease · doi:10.1007/s11011-015-9674-0 · Cited by 35
Stengel, D., Zindler, F., & Braunbeck, T. A. (2016) · Comparative Biochemistry and Physiology Part C Toxicology & Pharmacology · doi:10.1016/j.cbpc.2016.11.001 · Cited by 35
Monteiro, L. D. C., Butsel, J. V., Meester, N. D., Traunspurger, W., Derycke, S., & Moens, T. (2017) · Journal of Experimental Marine Biology and Ecology · doi:10.1016/j.jembe.2017.05.016 · Cited by 34
Yang, J., Wang, C., Nie, X., Shi, S., Xiao, J., Ma, X., Dong, X., Zhang, Y., Han, J., Li, T., et al. (2015) · International Immunopharmacology · doi:10.1016/j.intimp.2015.05.019 · Cited by 34
Guo, X.-X., He, Q., Li, W., Long, D., Pan, X., Chen, C., & Zeng, H. (2017) · International Journal of Molecular Sciences · doi:10.3390/ijms18040893 · Cited by 34
Xie, Z., Liang, H., Miao, M., Wang, Z., Chen, Y., Yang, L., Zhou, Y., Cao, W., & Yuan, W. (2023) · Environmental Science & Technology · doi:10.1021/acs.est.2c06535 · Cited by 30
Chowdhury, M. I., Sana, T., Panneerselvan, L., Sivaram, A. K., & Megharaj, M. (2021) · Chemosphere · doi:10.1016/j.chemosphere.2021.132896 · Cited by 26
Acute Toxicity and Transgenerational Effects of Perfluorobutane Sulfonate on Caenorhabditis elegans
Chowdhury, M. I., Sana, T., Panneerselvan, L., Dharmarajan, R., & Megharaj, M. (2021) · Environmental Toxicology and Chemistry · doi:10.1002/etc.5055 · Cited by 25
Zhang, J., Naveed, H., Chen, K., & Chen, L. (2025) · Toxics · doi:10.3390/toxics13010047 · Cited by 29
Embryonic exposure to PFAS causes long-term, compound-specific behavioral alterations in zebrafish
Hawkey, A. B., Mead, M., Natarajan, S., Gondal, A., Jarrett, O., & Levin, E. D. (2023) · Neurotoxicology and Teratology · doi:10.1016/j.ntt.2023.107165 · Cited by 25
Mahapatra, A., Gupta, P., Suman, A., Ray, S. S., & Singh, R. K. (2023) · Neurotoxicology and Teratology · doi:10.1016/j.ntt.2023.107304 · Cited by 26
Liu, X., Liu, S., Qiu, W., Magnuson, J. T., Liu, Z., Yang, G., Chen, H., Li, Y., Xu, X., & Zheng, C. (2022) · Sustainable Horizons · doi:10.1016/j.horiz.2022.100027 · Cited by 26
Cano-Sancho, G., Warembourg, C., Güil-Oumrait, N., Stratakis, N., Lertxundi, A., Irizar, A., Llop, S., López-Espinosa, M.-J., Basagaña, X., González, J. R., et al. (2023) · Environmental Health Perspectives · doi:10.1289/ehp11258 · Cited by 24
Xia, J., Nie, L.-J., Mi, X.-M., Wang, W., Ma, Y., Cao, Z., & Fu, S. (2015) · Fish Physiology and Biochemistry · doi:10.1007/s10695-015-0086-1 · Cited by 24
Perfluorooctanesulfonic acid exposure altered hypothalamic metabolism and disturbed male fecundity
Li, Z., Lin, Z., Ji, S., Lai, K. P., Wan, H., Wong, C. K. C., & Li, L. (2022) · The Science of The Total Environment · doi:10.1016/j.scitotenv.2022.156881 · Cited by 23
Berntsen, H. F., Duale, N., Bjørklund, C. G., Rangel-Huerta, Ó. D., Dyrberg, K., Hofer, T., Rakkestad, K. E., Østby, G. C., Halsne, R., Boge, G. S., et al. (2020) · Environment International · doi:10.1016/j.envint.2020.106240 · Cited by 23
Impacts of PFAS Exposure on Neurodevelopment: A Comprehensive Literature Review
Currie, S. D., Wang, J.-S., & Tang, L. (2024) · Environments · doi:10.3390/environments11090188 · Cited by 23
Sharma, R. P., Schuhmacher, M., & Kumar, V. (2017) · Toxicology Letters · doi:10.1016/j.toxlet.2017.08.003 · Cited by 20
Xu, T., Li, P., Wu, S., Li, D., Wu, J., Raley‐Susman, K. M., & He, D. (2016) · Bulletin of Environmental Contamination and Toxicology · doi:10.1007/s00128-016-1808-5 · Cited by 19
Wang, Y., Yuan, K., Li, X., Su, Z., Li, X., Guan, H., Su, Y., Ge, H., & Ge, R. (2016) · Growth Factors · doi:10.1080/08977194.2016.1183199 · Cited by 20
The application of human-derived cell lines in neurotoxicity studies of environmental pollutants
Li, M.-R., Men, S., Wang, Z., Liu, C., Zhou, G.-R., & Yan, Z. (2023) · The Science of The Total Environment · doi:10.1016/j.scitotenv.2023.168839 · Cited by 19
Patel, R., Bradner, J. M., Stout, K. A., & Caudle, W. M. (2016) · Medical Sciences · doi:10.3390/medsci4030013 · Cited by 20
Ortiz‐Sánchez, P. B., Roa-Espitia, A. L., Fierro, R., López-Torres, A. S., Jiménez‐Morales, I., Oseguera-López, I., Hernández-González, E. O., & González‐Márquez, H. (2022) · Reproductive Toxicology · doi:10.1016/j.reprotox.2022.03.013 · Cited by 19
Currie, S. D., Doherty, J. P., Xue, K. S., Wang, J.-S., & Tang, L. (2023) · Environmental Pollution · doi:10.1016/j.envpol.2023.122429 · Cited by 18
Chambial, P., Thakur, N., Kushawaha, J., & Kumar, R. (2025) · The Science of The Total Environment · doi:10.1016/j.scitotenv.2025.178803 · Cited by 20
Li, S., Zhang, Y., Xue, H., Zhang, Q., Chen, N., Wan, J., Sun, L., Qiu, C., Zong, Y., Zhuang, F., et al. (2021) · Ecotoxicology and Environmental Safety · doi:10.1016/j.ecoenv.2021.112770 · Cited by 15
Environmental Deterioration Due to Existing and Emerging Persistent Organic Pollutants: An Overview
Harikrishnan, T., & Gopalakrishnan, S. (2021) · Emerging contaminants and associated treatment technologies · doi:10.1007/978-3-030-72441-2_3 · Cited by 15
Adedara, I. A., Weis, G. C. C., Monteiro, C. S., Soares, F. A. A., da Rocha, J. B. T., Schetinger, M. R. C., Emanuelli, T., & Aschner, M. (2025) · Molecular Neurobiology · doi:10.1007/s12035-025-04705-y · Cited by 13
Wang, Y., Zhang, X., Wang, M., Cao, Y., Wang, X., Liu, Y., Wang, J., Wang, J., Wu, L., Hei, T. K., et al. (2015) · Environmental Science & Technology · doi:10.1021/acs.est.5b00530 · Cited by 13
Rotondo, D., Gualandris, D., Lorusso, C., Braeuning, A., Calisi, A., & Dondero, F. (2024) · Journal of Xenobiotics · doi:10.3390/jox15010002 · Cited by 12
Interfacial Self-Assembly of Antimicrobial Peptide GL13K into Non-Fibril Crystalline β-Sheets
Youssef, H., & DeWolf, C. (2019) · Langmuir · doi:10.1021/acs.langmuir.9b03120 · Cited by 12
Effects of perfluorooctane sulfonate (PFOS) on cognitive behavior and autophagy of male mice
Zhou, A.-J., Wang, L., Pi, X., Fan, C., Chen, W., Wang, Z., Rong, S., & Wang, T. (2023) · The Journal of Toxicological Sciences · doi:10.2131/jts.48.513 · Cited by 11
Marin, M., Annunziato, K. M., Tompach, M. C., Liang, W., Zahn, S. M., Li, S., Doherty, J., Lee, J., Clark, J. M., Park, Y., et al. (2024) · Aquatic Toxicology · doi:10.1016/j.aquatox.2024.106923 · Cited by 11
Mo, A., Liang, Y., Cao, X., Jiang, J., Liu, Y., Cao, X., Qiu, Y., & He, D. (2024) · Journal of Hazardous Materials · doi:10.1016/j.jhazmat.2024.134730 · Cited by 13
Role of nitric oxide in psychostimulant-induced neurotoxicity
Bashkatova, V. G., & Philippu, A. (2019) · AIMS neuroscience · doi:10.3934/neuroscience.2019.3.191 · Cited by 11
Wei, C., Zhou, Z., Wang, L., Huang, Z., Liang, Y., & Zhang, J. (2021) · Chemosphere · doi:10.1016/j.chemosphere.2021.130359 · Cited by 10
C. elegans as a powerful model for neurotoxicity assessment
Barbosa, D. J., Santos, I. C., Moyisyeyenko, T., Mendes, C., & Sobral, A. F. (2025) · NeuroToxicology · doi:10.1016/j.neuro.2025.07.009 · Cited by 10
Hossain, M. M., Nawaz, M. Z., Dar, M. A., Geng, A., Alghamdi, H. A., Han, S. Y., & Zhu, D. (2024) · Journal of Hazardous Materials Advances · doi:10.1016/j.hazadv.2024.100579 · Cited by 11
Xia, J., Ma, Y., Guo, W., Huang, L., & Fu, S. (2015) · Aquatic Biology · doi:10.3354/ab00640 · Cited by 8
Gao, Y., Guo, X., Wang, S., Chen, F., Ren, X., Xiao, H., & Wang, L. (2020) · Environmental Pollution · doi:10.1016/j.envpol.2020.114571 · Cited by 9
Vajeethaveesin, N., Kanitwithayanun, J., Suriyo, T., Chujan, S., & Satayavivad, J. (2025) · Archives of Toxicology · doi:10.1007/s00204-025-04047-7 · Cited by 8
Mousavi, S. E., Zarean, M., Yu, Q., Abbasi, S., & Kwong, R. W. M. (2025) · The Science of The Total Environment · doi:10.1016/j.scitotenv.2025.181170 · Cited by 7
Sun, L., Chen, Y., Chen, J., Mao, G., Feng, W., & Wu, X. (2025) · Archives of Toxicology · doi:10.1007/s00204-025-04093-1 · Cited by 6
Perfluorooctanoic acid inhibits androgen biosynthesis in rat immature Leydig cells
Zhang, D., Hu, J., & Li, H. (2023) · Environmental Toxicology · doi:10.1002/tox.24042 · Cited by 7
van Melis, L. V. J., Persad, A. R., Peerdeman, A. M., van Rossum, M. J. H., van Kleef, R. G. D. M., Wopken, J. P., Legler, J., & Westerink, R. H. S. (2025) · The Science of The Total Environment · doi:10.1016/j.scitotenv.2025.180214 · Cited by 6
Wu, P., Ding, C., Yan, M., Qian, B., Wang, W., Sun, P., & Zhao, J. (2019) · The Journal of Toxicological Sciences · doi:10.2131/jts.44.657 · Cited by 6
Effect of Per and Poly-Fluoroalkyl Substances on Pregnancy and Child Development
Kilari, T., Suresh, A. S., Begum, R. F., Singh, A., Venkkatesh, P., & Vellapandian, C. (2024) · Current Pediatric Reviews · doi:10.2174/0115733963267526231120110100 · Cited by 6
Unravelling the chemistry of PFAS transfer from packaging to food
Bisht, B., Dimri, S., Vlaskin, M. S., Dmitriev, A. A., Verma, M., Kumar, A., Aayush, K., Kim, H., & Kumar, V. (2025) · Trends in Food Science & Technology · doi:10.1016/j.tifs.2025.105467 · Cited by 6
Manzetti, S. (2017) · Chemical Research in Toxicology · doi:10.1021/acs.chemrestox.7b00265 · Cited by 5
Yang, J., Wang, Y., Xia, Y., Ren, Y., Wang, Z., Meng, X., Li, S., Liu, X., & Shao, J. (2024) · Neurochemical Research · doi:10.1007/s11064-024-04109-9 · Cited by 5
Using Caenorhabditis elegans to Study Neurotoxicity
Sedensky, M. M., & Morgan, P. G. (2018) · Elsevier eBooks · doi:10.1016/b978-0-12-809405-1.00013-4 · Cited by 4
PFAS exposure induces hearing loss by targeting cochlear hair cells and spiral ganglion neurons
Bhatia, P., Roth, K., Yang, Z., Petriello, M. C., & Jamesdaniel, S. (2026) · Scientific Reports · doi:10.1038/s41598-026-51693-7 · Cited by 3
Yang, Y., Chen, S., Li, P., Jing, Y., Cheng, B., Hu, Y., Zheng, Q., & Wang, C. (2021) · Chemosphere · doi:10.1016/j.chemosphere.2021.131967 · Cited by 3
Jiang, J., Liu, Q., Zhang, B., Zhao, L., & Xu, D. (2025) · Toxics · doi:10.3390/toxics13080662 · Cited by 2
Comparative neurotoxicities of PFOS and its alternative F-53B based on acetylcholinesterase
Zhao, Y., Weng, L., & Chi, Z. (2025) · Journal of Environmental Sciences · doi:10.1016/j.jes.2025.08.063 · Cited by 3
Huang, C., Liu, Y., Guo, M., Liu, Q., Yang, M., Li, L., & Zhou, J. F. (2025) · Analytical and Bioanalytical Chemistry · doi:10.1007/s00216-025-06149-8 · Cited by 2
Ren, Z., Wang, X., Meng, L., Ren, D., Sun, J., Cai, Y., Duan, Y., Ning, X., Ku, T., & Sang, N. (2026) · Environment & Health · doi:10.1021/envhealth.5c00628 · Cited by 2
Soares, M. V., Cordeiro, L. M., da Silva, A. F., Ugalde, G. A., Venturini, L., Soares, F. A. A., & Ávila, D. S. (2025) · Chemosphere · doi:10.1016/j.chemosphere.2025.144624 · Cited by 1
Toxicity assessment of perfluorooctane sulfonate on regenerating planarian Dugesia japonica
Sun, J., Huang, J., Gong, M., Shao, X., Zhang, J., & Yuan, Z. (2024) · Chemistry and Ecology · doi:10.1080/02757540.2024.2334464 · Cited by 1
Toxicity Induction in Neurons and Muscle in Nematodes Exposed to Environmental Toxicants or Stresses
Wang, D. (2019) · Springer eBooks · doi:10.1007/978-981-13-6010-7_6 · Cited by 2
Transition Toward the Per‐ and Polyfluoroalkyl Substance‐Free Environment
Deb, C. K., Singh, R., Ahn, Y., & Ray, S. S. (2025) · Wiley eBooks · doi:10.1002/9781394343935.ch17 · Cited by 1
Johanson, S. M. (2015) · NORA - Norwegian Open Research Archives
Kim, J. H., Moon, N., Ji, E., & Moon, H. (2022) · SSRN Electronic Journal · doi:10.2139/ssrn.4171440
Zeliger, H. I. (2022) · Elsevier eBooks · doi:10.1016/b978-0-323-91890-9.00006-4
Li, X., Chen, X., Zhang, Y., Zheng, T., Huang, L., Li, Y., & Wang, K. (2025) · Environmental Health and Preventive Medicine · doi:10.1265/ehpm.25-00023
Metadata
- Authors
- Chen, N., Li, J., Li, D., Yang, Y., & He, D.
- Affiliations
- East China Normal University (CN)
- Shanghai Key Laboratory for Urban Ecological Processes and Eco-Restoration (CN)
- Corresponding author
- He, Defu
- Venue
- PLoS ONE
- Publisher
- Public Library of Science (PLoS)
- Published
- 2014-11-20
- Volume
- 9
- Issue
- 11
- Pages
- e113453
- ISSN
- 1932-6203 (ISSN-L)
- PMC
- PMC4239059
- OpenAlex
- W2009384525
- Cited by
- 105
- References
- 60
- Citations by year
- 2026: 4 · 2025: 17 · 2024: 10 · 2023: 10 · 2022: 9 · 2021: 10 · 2020: 9 · 2019: 10 · 2018: 3 · 2017: 8 · 2016: 7 · 2015: 8
- FWCI
- 5.83
- Type
- journal article
- Language
- en
- Open access
- gold
- doi.org
- Locations
- PLoS ONE (publishedVersion, cc-by)
- PubMed Central (publishedVersion, cc-by)
- PubMed (publishedVersion)
- DOAJ (DOAJ: Directory of Open Access Journals) (submittedVersion, cc-by-sa)
- Figshare (submittedVersion, cc-by)
- Funders
- National Science and Technology Major Project
- Topics
- Physical Sciences › Environmental Science › Environmental Chemistry › Per- and polyfluoroalkyl substances research
- Physical Sciences › Environmental Science › Health, Toxicology and Mutagenesis › Toxic Organic Pollutants Impact
- Life Sciences › Pharmacology, Toxicology and Pharmaceutics › Toxicology › Pesticide Exposure and Toxicity
- Keywords
- PFOS, persistent organic pollutants, SH-SY5Y cells, apoptosis, reactive oxygen species, lipid peroxidation, superoxide dismutase, glutathione peroxidase, N-acetylcysteine, oxidative stress, Caenorhabditis elegans
- MeSH terms
- Acetylcysteine, Animals, Behavior, Animal, Environmental Exposure, Environmental Pollutants, Fluorocarbons, Glutathione Peroxidase, Humans, Locomotion, Sensory Receptor Cells, Superoxide Dismutase, Lipid Peroxidation, Caenorhabditis elegans, Apoptosis, Reactive Oxygen Species, Alkanesulfonic Acids, Oxidative Stress, Caenorhabditis elegans Proteins, Animals, Genetically Modified, Cell Line, Tumor
About these checks
Registry, retraction, Cites and statistics results are computed, not judged, with one exception: a printed reference that no index lists is read once by a model before it counts as a citation error. Claims are extracted by a model and kept only when their quote appears verbatim in the text; each cited source is then checked, with a model’s help, for whether it says what the claim relies on. Those verdicts can be wrong — read the claim’s quote and the cited source before relying on one.
Statistics and arithmetic are recomputed, not judged.
Confidence bands are shown only for fields calibrated on our annotated test set. None is calibrated yet, so no band is shown.
What counts as a claim ›How we measure confidence ›How we check this ›
Are you an author, or do you see a problem with this page? Request a review
