

The DOI matches its Crossref record; 66 of the 68 references it cites were found in a registry or an index.
World Health Organization Estimates of the Relative Contributions of Food to the Burden of Disease Due to Selected Foodborne Hazards: A Structured Expert Elicitation
Open accessAbstract
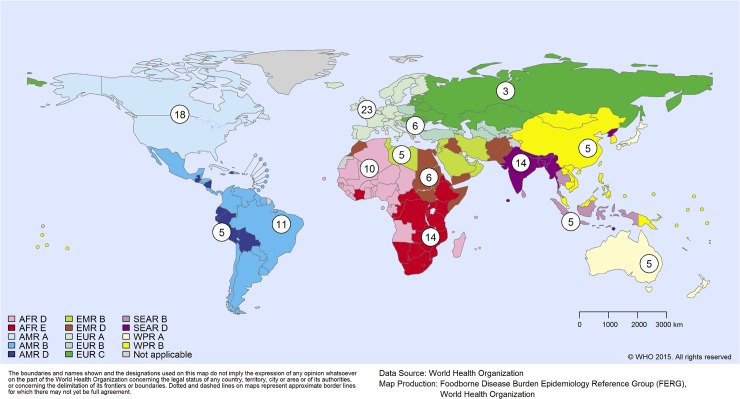
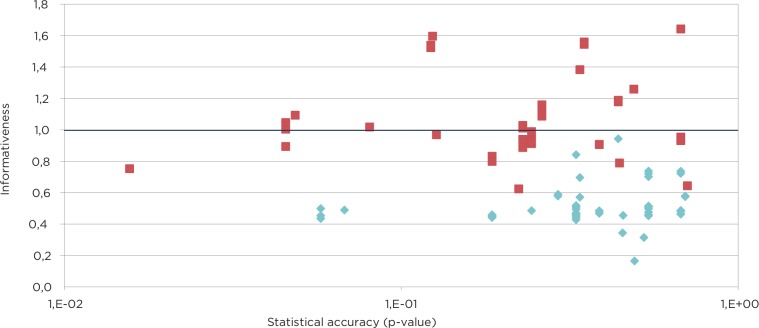
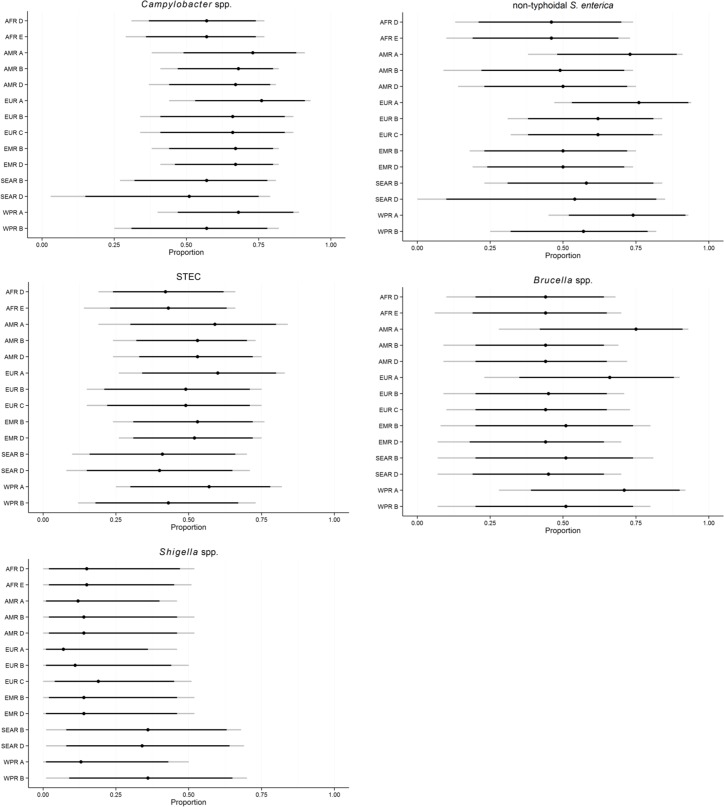
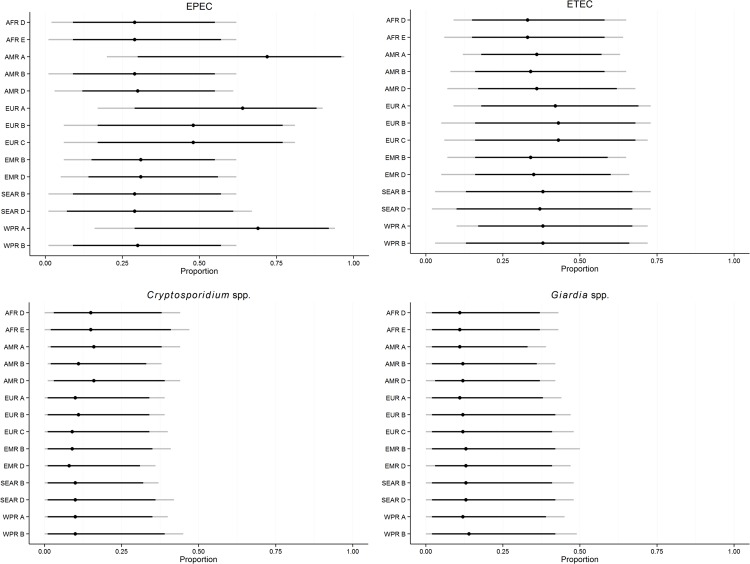
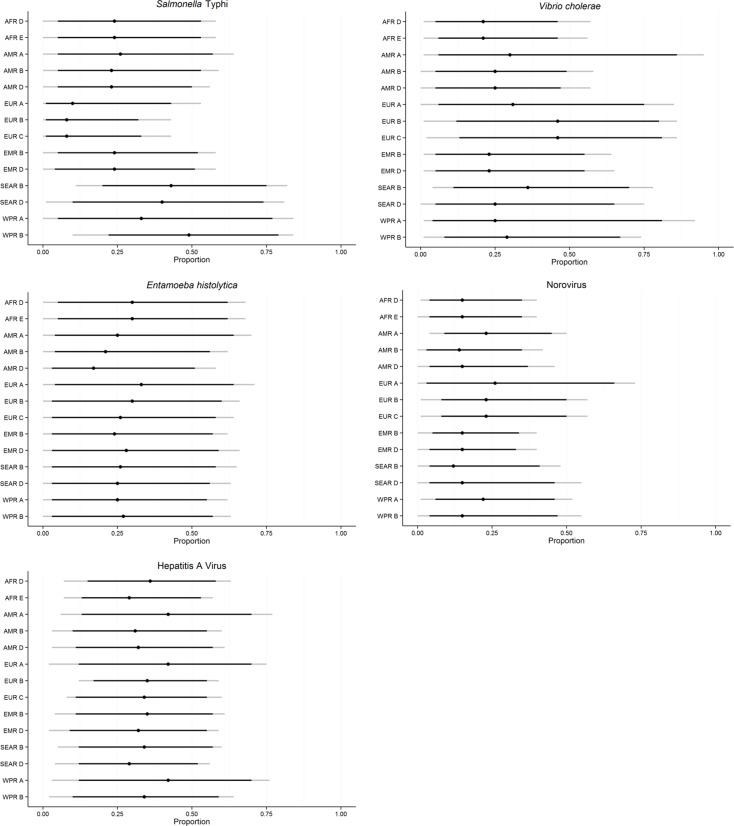
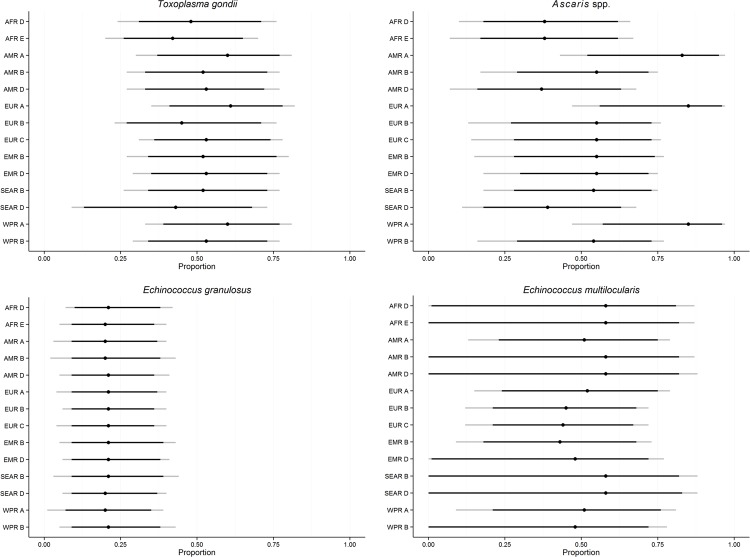
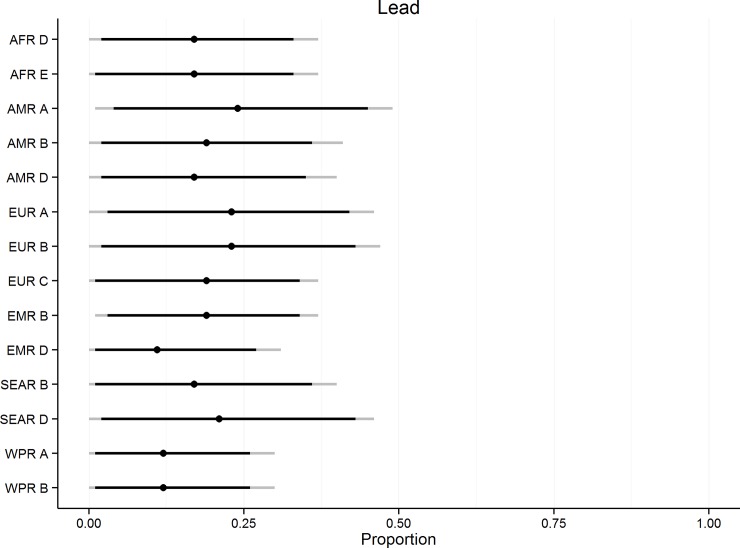
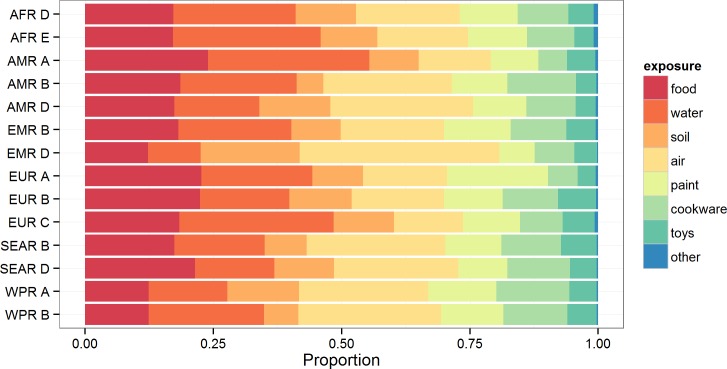
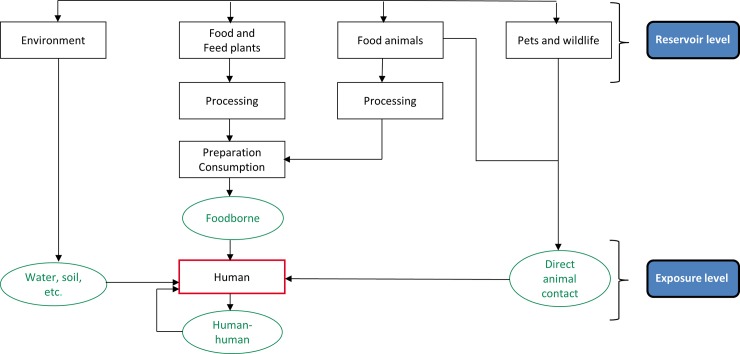
BACKGROUND: The Foodborne Disease Burden Epidemiology Reference Group (FERG) was established in 2007 by the World Health Organization (WHO) to estimate the global burden of foodborne diseases (FBDs). This estimation is complicated because most of the hazards causing FBD are not transmitted solely by food; most have several potential exposure routes consisting of transmission from animals, by humans, and via environmental routes including water. This paper describes an expert elicitation study conducted by the FERG Source Attribution Task Force to estimate the relative contribution of food to the global burden of diseases commonly transmitted through the consumption of food. METHODS AND FINDINGS: We applied structured expert judgment using Cooke's Classical Model to obtain estimates for 14 subregions for the relative contributions of different transmission pathways for eleven diarrheal diseases, seven other infectious diseases and one chemical (lead). Experts were identified through international networks followed by social network sampling. Final selection of experts was based on their experience including international working experience. Enrolled experts were scored on their ability to judge uncertainty accurately and informatively using a series of subject-matter specific 'seed' questions whose answers are unknown to the experts at the time they are interviewed. Trained facilitators elicited the 5th, and 50th and 95th percentile responses to seed questions through telephone interviews. Cooke's Classical Model uses responses to the seed questions to weigh and aggregate expert responses. After this interview, the experts were asked to provide 5th, 50th, and 95th percentile estimates for the 'target' questions regarding disease transmission routes. A total of 72 experts were enrolled in the study. Ten panels were global, meaning that the experts should provide estimates for all 14 subregions, whereas the nine panels were subregional, with experts providing estimates for one or more subregions, depending on their experience in the region. The size of the 19 hazard-specific panels ranged from 6 to 15 persons with several experts serving on more than one panel. Pathogens with animal reservoirs (e.g. non-typhoidal Salmonella spp. and Toxoplasma gondii) were in general assessed by the experts to have a higher proportion of illnesses attributable to food than pathogens with mainly a human reservoir, where human-to-human transmission (e.g. Shigella spp. and Norovirus) or waterborne transmission (e.g. Salmonella Typhi and Vibrio cholerae) were judged to dominate. For many pathogens, the foodborne route was assessed relatively more important in developed subregions than in developing subregions. The main exposure routes for lead varied across subregions, with the foodborne route being assessed most important only in two subregions of the European region. CONCLUSIONS: For the first time, we present worldwide estimates of the proportion of specific diseases attributable to food and other major transmission routes. These findings are essential for global burden of FBD estimates. While gaps exist, we believe the estimates presented here are the best current source of guidance to support decision makers when allocating resources for control and intervention, and for future research initiatives.
Overview
The claims and statistics of this paper haven’t been checked yet.
Run the check — free, no account needed. It reads the open-access text and checks the sources it cites.
Integrity signals
Registry
Cites
Statistics
Figures
Verification
Claims the paper makes
The claims and statistics of this paper haven’t been checked yet.
Run the check — free, no account needed. It reads the open-access text and checks the sources it cites.
Self-check
Percentages, sums and reported differences re-computed from the paper’s own numbers.
The self-check needs the paper’s full text.
Citations
Cites
R: A Language and Environment for Statistical Computing
R Core Team (2000) · doi:10.32614/r.manuals · Cited by 355,817
Foodborne illness acquired in the United States—Major pathogens
Scallan, E., Hoekstra, R. M., Angulo, F. J., Tauxe, R. V., Widdowson, M.-A., Roy, S. L., Jones, J. L., & Griffin, P. M. (2011) · Emerging Infectious Diseases · doi:10.3201/eid1701.p11101 · Cited by 7,657
Self-citationSelected major risk factors and global and regional burden of disease
Ezzati, M., Lopez, A. D., Rodgers, A., Vander Hoorn, S., & Murray, C. J. (2002) · The Lancet · doi:10.1016/s0140-6736(02)11403-6 · Cited by 3,594
Mathematical Statistics and Data Analysis
Rabinowitz, L., & Rice, J. A. (1989) · Technometrics · doi:10.2307/3556160 · Cited by 3,142
Havelaar, A. H., Kirk, M. D., Torgerson, P. R., Gibb, H. J., Hald, T., Lake, R. J., Praet, N., Bellinger, D. C., de Silva, N. R., Gargouri, N., et al. (2015) · PLoS Medicine · doi:10.1371/journal.pmed.1001923 · Cited by 2,067
Self-citationKirk, M. D., Pires, S. M., Black, R. E., Caipo, M., Crump, J. A., Devleesschauwer, B., Döpfer, D., Fazil, A., Fischer-Walker, C. L., Hald, T., et al. (2015) · PLoS Medicine · doi:10.1371/journal.pmed.1001921 · Cited by 1,625
Self-citationPainter, J. A., Hoekstra, R. M., Ayers, T., Tauxe, R. V., Braden, C. R., Angulo, F. J., & Griffin, P. M. (2013) · Emerging Infectious Diseases · doi:10.3201/eid1903.111866 · Cited by 1,146 · cited 1×
“However, comprehensive attribution studies based on surveillance data and/or food monitoring and exposure data are still limited in scope, and to date have been performed for a few hazards only or in a limited number of countries [11, 12, 13, 14, 15, 16, 17, 18, 19, 20, 21, 22, 23].”
Self-citationExperts in uncertainty: opinion and subjective probability in science
(1992) · Choice Reviews Online · doi:10.5860/choice.29-5666 · Cited by 1,139
Torgerson, P. R., Devleesschauwer, B., Praet, N., Speybroeck, N., Willingham, A. L., Kasuga, F., Rokni, M. B., Zhou, X.-N., Fèvre, E. M., Sripa, B., et al. (2015) · PLoS Medicine · doi:10.1371/journal.pmed.1001920 · Cited by 782
Self-citationWater, sanitation and hygiene for the prevention of diarrhoea
Cairncross, S., Hunt, C., Boisson, S., Bostoen, K., Curtis, V., Fung, I. C., & Schmidt, W.-P. (2010) · International Journal of Epidemiology · doi:10.1093/ije/dyq035 · Cited by 667
Research works printed but not linked: 2
- B Devleesschauwer, 2015, Methodological framework for estimating the global burden of foodborne diseases, PLOS One
- H Gibb, 2015, World Health Organization estimates of the global and regional disease burden of four foodborne chemicals and toxins, 2010, PLOS Medicine
Cited by
Sorted by citations
Havelaar, A. H., Kirk, M. D., Torgerson, P. R., Gibb, H. J., Hald, T., Lake, R. J., Praet, N., Bellinger, D. C., de Silva, N. R., Gargouri, N., et al. (2015) · PLoS Medicine · doi:10.1371/journal.pmed.1001923 · Cited by 2,067
“Details on the FERG expert elicitation can be found elsewhere [14].”
BackgroundSelf-citationKirk, M. D., Pires, S. M., Black, R. E., Caipo, M., Crump, J. A., Devleesschauwer, B., Döpfer, D., Fazil, A., Fischer-Walker, C. L., Hald, T., et al. (2015) · PLoS Medicine · doi:10.1371/journal.pmed.1001921 · Cited by 1,625
“To estimate the proportion of the other enteric diseases that were transmitted by contaminated food, we relied upon results of a FERG structured expert elicitation [46].”
Self-citationTorgerson, P. R., Devleesschauwer, B., Praet, N., Speybroeck, N., Willingham, A. L., Kasuga, F., Rokni, M. B., Zhou, X.-N., Fèvre, E. M., Sripa, B., et al. (2015) · PLoS Medicine · doi:10.1371/journal.pmed.1001920 · Cited by 782
Self-citationPanel, E. B., Koutsoumanis, K., Allende, A., Álvarez‐Ordóñez, A., Bover‐Cid, S., Chemaly, M., Davies, R., Cesare, A. D., Herman, L., Hilbert, F., et al. (2020) · EFSA Journal · doi:10.2903/j.efsa.2020.5967 · Cited by 297
Metadata
- Authors
- Hald, T., Aspinall, W., Devleesschauwer, B., Cooke, R., Corrigan, T., Havelaar, A. H., Gibb, H. J., Torgerson, P. R., Kirk, M. D., Angulo, F. J., Lake, R. J., Speybroeck, N., & Hoffmann, S.
- Affiliations
- Technical University of Denmark (DK)
- University of Bristol (GB)
- Ghent University (BE)
- Resources For The Future (US)
- World Health Organization (CH)
- Utrecht University (NL)
- University of Zurich (CH)
- Australian National University (AU)
- Centers for Disease Control and Prevention (US)
- New Zealand Institute for Public Health and Forensic Science (NZ)
- UCLouvain (BE)
- Economic Research Service (US)
- Corresponding author
- Hald, Tine
- ORCID
- Venue
- PLOS ONE
- Publisher
- Public Library of Science (PLoS)
- Published
- 2016-01-19
- Volume
- 11
- Issue
- 1
- Pages
- e0145839
- ISSN
- 1932-6203 (ISSN-L)
- PMC
- PMC4718673
- OpenAlex
- W2284802218
- Cited by
- 242
- References
- 68
- Citations by year
- 2026: 18 · 2025: 21 · 2024: 15 · 2023: 22 · 2022: 22 · 2021: 27 · 2020: 38 · 2019: 17 · 2018: 26 · 2017: 25 · 2016: 7
- FWCI
- 31.50
- Type
- journal article
- Language
- en
- Open access
- gold
- doi.org
- Licence
- Locations
- PLoS ONE (publishedVersion, cc-by)
- PubMed Central (publishedVersion, cc-by)
- PubMed (publishedVersion)
- Explore Bristol Research (acceptedVersion, cc-by)
- Zurich Open Repository and Archive (University of Zurich) (acceptedVersion, cc-by-nc)
- Ghent University Academic Bibliography (Ghent University) (submittedVersion, other-oa)
- Bristol Research (University of Bristol) (submittedVersion, cc-by)
- DIAL (Catholic University of Leuven) (submittedVersion, other-oa)
- DOAJ (DOAJ: Directory of Open Access Journals) (submittedVersion)
- Utrecht University Repository (Utrecht University) (submittedVersion, other-oa)
- Figshare (submittedVersion, cc-by)
- ANU Open Research (Australian National University) (submittedVersion)
- Technical University of Denmark, DTU Orbit (Technical University of Denmark, DTU) (submittedVersion, other-oa)
- Rivm Repository (Netherlands National Institute for Public Health and the Environment) (submittedVersion)
- Zurich Open Repository and Archive (University of Zurich) (submittedVersion, cc-by-nc)
- Zurich Open Repository and Archive (University of Zurich)
- Funders
- World Health Organization
- European Food Safety Authority
- Natural Environment Research Council (NE/J017450/1)
- Topics
- Life Sciences › Agricultural and Biological Sciences › Food Science › Salmonella and Campylobacter epidemiology
- Life Sciences › Agricultural and Biological Sciences › Food Science › Food Safety and Hygiene
- Social Sciences › Sociology and Political Science › Delphi Technique in Research
- Keywords
- food poisoning, global burden of disease, transmission routes, diarrheal disease, infectious disease transmission, lead exposure, structured expert elicitation, reservoir hosts, human-to-human transmission, waterborne transmission, non-typhoidal Salmonella, Toxoplasma gondii, Shigella, norovirus, Salmonella typhi, Vibrio cholerae, expert judgment uncertainty, social network sampling
- MeSH terms
- Food Microbiology, Foodborne Diseases, Humans, World Health Organization, Food Parasitology
About these checks
Registry, retraction, Cites and statistics results are computed, not judged, with one exception: a printed reference that no index lists is read once by a model before it counts as a citation error. Claims are extracted by a model and kept only when their quote appears verbatim in the text; each cited source is then checked, with a model’s help, for whether it says what the claim relies on. Those verdicts can be wrong — read the claim’s quote and the cited source before relying on one.
Statistics and arithmetic are recomputed, not judged.
Confidence bands are shown only for fields calibrated on our annotated test set. None is calibrated yet, so no band is shown.
What counts as a claim ›How we measure confidence ›How we check this ›
Are you an author, or do you see a problem with this page? Request a review
