

The DOI matches its Crossref record; 5 of the 5 references it cites were found in a registry or an index.
Stability of Circulating Blood-Based MicroRNAs – Pre-Analytic Methodological Considerations
Overview
The claims and statistics of this paper haven’t been checked yet.
Run the check — free, no account needed. It reads the open-access text and checks the sources it cites.
Integrity signals
Registry
Cites
Statistics
Figures
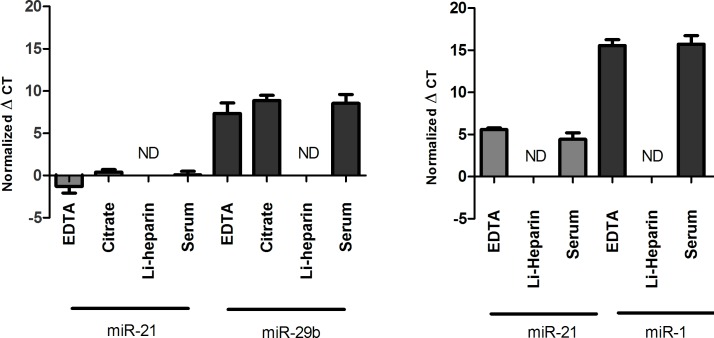
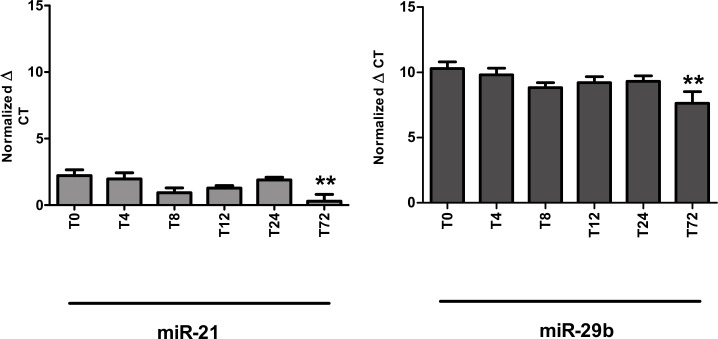
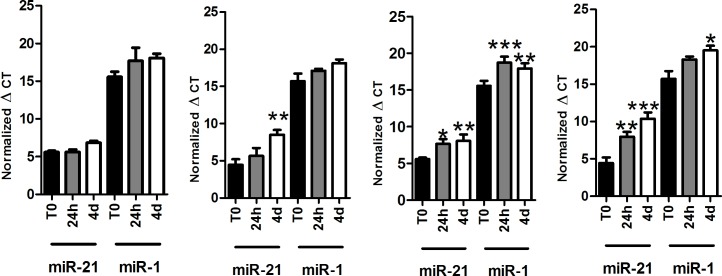
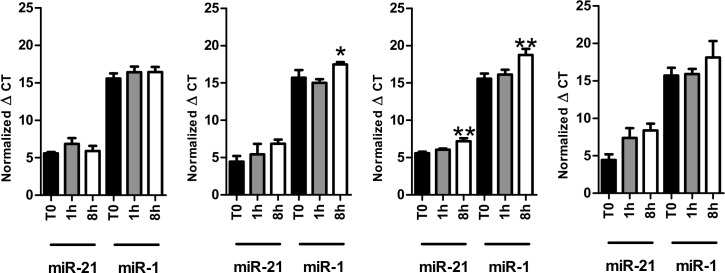
Verification
Claims the paper makes
The claims and statistics of this paper haven’t been checked yet.
Run the check — free, no account needed. It reads the open-access text and checks the sources it cites.
Claims other papers make about this one
Each is checked against this paper’s own text: does it say what the citing paper says it does?
The cited source says what the claim attributes to it.
In the citing paper
“They are small molecules frequently conserved among species208 that are remarkably stable in plasma and serum due to high resistance to RNase activity and degradation.209”
From MiR-128-3p – a gray eminence of the human central nervous system (2024) · cites this paper as [209]
Self-check
Percentages, sums and reported differences re-computed from the paper’s own numbers.
The self-check needs the paper’s full text.
Citations
Cites
The functions of animal microRNAs
Ambros, V. (2004) · Nature · doi:10.1038/nature02871 · Cited by 10,728
Most mammalian mRNAs are conserved targets of microRNAs
Friedman, R. C., Farh, K. K.-H., Burge, C. B., & Bartel, D. P. (2009) · Genome Research · doi:10.1101/gr.082701.108 · Cited by 8,462
Chen, X., Ba, Y., Ma, L., Cai, X., Yin, Y., Wang, K., Guo, J., Zhang, Y., Chen, J., Guo, X., et al. (2008) · Cell Research · doi:10.1038/cr.2008.282 · Cited by 4,560
MicroRNA-21 contributes to myocardial disease by stimulating MAP kinase signalling in fibroblasts
Thum, T., Gross, C., Fiedler, J., Fischer, T., Kissler, S., Bussen, M., Galuppo, P., Just, S., Rottbauer, W., Frantz, S., et al. (2008) · Nature · doi:10.1038/nature07511 · Cited by 2,349
Circulating microRNAs, potential biomarkers for drug-induced liver injury
Wang, K., Zhang, S., Marzolf, B., Troisch, P., Brightman, A., Hu, Z., Hood, L. E., & Galas, D. J. (2009) · Proceedings of the National Academy of Sciences · doi:10.1073/pnas.0813371106 · Cited by 1,149
Research works printed but not linked: 26
- J Lu, 2005, MicroRNA expression profiles classify human cancers, Nature, 435, 834, 10.1038/nature03702 · DOI
- S Gilad, 2008, Serum microRNAs are promising novel biomarkers, PloS One, 3, e3148, 10.1371/journal.pone.0003148 · DOI
- G-K Wang, 2010, Circulating microRNA: a novel potential biomarker for early diagnosis of acute myocardial infarction in humans, Eur Heart J, 31, 659, 10.1093/eurheartj/ehq013 · DOI
- AJ Tijsen, 2010, MiR423-5p as a circulating biomarker for heart failure, Circ Res, 106, 1035, 10.1161/CIRCRESAHA.110.218297 · DOI
- MP Perron, 2007, Regulatory RNAs: future perspectives in diagnosis, prognosis, and individualized therapy, Methods Mol Biol Clifton NJ, 361, 311
- Y D’Alessandra, 2010, Circulating microRNAs are new and sensitive biomarkers of myocardial infarction, Eur Heart J, 31, 2765, 10.1093/eurheartj/ehq167 · DOI
- N Bushati, 2007, microRNA functions, Annu Rev Cell Dev Biol, 23, 175, 10.1146/annurev.cellbio.23.090506.123406 · DOI · Paper page
- RW Carthew, 2009, Origins and Mechanisms of miRNAs and siRNAs, Cell, 136, 642, 10.1016/j.cell.2009.01.035 · DOI
- AS Flynt, 2008, Biological principles of microRNA-mediated regulation: shared themes amid diversity, Nat Rev Genet, 9, 831, 10.1038/nrg2455 · DOI
- DP Bartel, 2004, MicroRNAs: genomics, biogenesis, mechanism, and function, Cell, 116, 281, 10.1016/S0092-8674(04)00045-5 · DOI
- PS Mitchell, 2008, Circulating microRNAs as stable blood-based markers for cancer detection, Proc Natl Acad Sci U S A, 105, 10513, 10.1073/pnas.0804549105 · DOI · Paper page
- SSC Chim, 2008, Detection and characterization of placental microRNAs in maternal plasma, Clin Chem, 54, 482, 10.1373/clinchem.2007.097972 · DOI
- CH Lawrie, 2008, Detection of elevated levels of tumour-associated microRNAs in serum of patients with diffuse large B-cell lymphoma, Br J Haematol, 141, 672, 10.1111/j.1365-2141.2008.07077.x · DOI
- JS McDonald, 2011, Analysis of circulating microRNA: preanalytical and analytical challenges, Clin Chem, 57, 833, 10.1373/clinchem.2010.157198 · DOI
- O Gidlöf, 2011, Cardiospecific microRNA plasma levels correlate with troponin and cardiac function in patients with ST elevation myocardial infarction, are selectively dependent on renal elimination, and can be detected in urine samples, Cardiology, 118, 217, 10.1159/000328869 · DOI
- M Hanke, 2010, A robust methodology to study urine microRNA as tumor marker: microRNA-126 and microRNA-182 are related to urinary bladder cancer, Urol Oncol, 28, 655, 10.1016/j.urolonc.2009.01.027 · DOI
- NJ Park, 2009, Salivary microRNA: discovery, characterization, and clinical utility for oral cancer detection, Clin Cancer Res Off J Am Assoc Cancer Res, 15, 5473, 10.1158/1078-0432.CCR-09-0736 · DOI
- JA Weber, 2010, The microRNA spectrum in 12 body fluids, Clin Chem, 56, 1733, 10.1373/clinchem.2010.147405 · DOI · Paper page
- J Rice, 2015, Assay reproducibility in clinical studies of plasma miRNA, PloS One, 10, e0121948, 10.1371/journal.pone.0121948 · DOI
- K Wang, 2012, Comparing the MicroRNA spectrum between serum and plasma, PloS One, 7, e41561, 10.1371/journal.pone.0041561 · DOI
- LT Weckbach, 2016, MicroRNAs as a diagnostic tool for heart failure and atrial fibrillation, Curr Opin Pharmacol, 27, 24, 10.1016/j.coph.2016.01.001 · DOI
- JR Chevillet, 2014, Quantitative and stoichiometric analysis of the microRNA content of exosomes, Proc Natl Acad Sci U S A, 111, 14888, 10.1073/pnas.1408301111 · DOI
- P Tiberio, 2015, Challenges in using circulating miRNAs as cancer biomarkers, BioMed Res Int, 2015, 731479, 10.1155/2015/731479 · DOI
- MB Kirschner, 2011, Haemolysis during sample preparation alters microRNA content of plasma, PloS One, 6, e24145, 10.1371/journal.pone.0024145 · DOI · Paper page
- H Zhao, 2014, Effects of preanalytic variables on circulating microRNAs in whole blood, Cancer Epidemiol Biomark Prev Publ Am Assoc Cancer Res Cosponsored Am Soc Prev Oncol, 23, 2643, 10.1158/1055-9965.EPI-14-0550 · DOI
- NH Farina, 2014, Standardizing Analysis of Circulating MicroRNA: Clinical and Biological Relevance, J Cell Biochem, 115, 805, 10.1002/jcb.24745 · DOI
Cited by
Sorted by citations
Pogue, A. I., & Lukiw, W. J. (2018) · Cellular and Molecular Neurobiology · doi:10.1007/s10571-017-0572-3 · Cited by 105
MiR-128-3p – a gray eminence of the human central nervous system
Kiel, K., Król, S. K., Bronisz, A., & Godlewski, J. (2024) · Molecular Therapy Nucleic Acids · doi:10.1016/j.omtn.2024.102141 · Cited by 15
Metadata
- Authors
- Glinge, C., Clauss, S., Boddum, K., Jabbari, R., Jabbari, J., Risgaard, B., Tomsits, P., Hildebrand, B., Kääb, S., Wakili, R., Jespersen, T., & Tfelt-Hansen, J.
- Venue
- PLOS ONE
- Publisher
- Public Library of Science (PLoS)
- Published
- 2017-02-02
- Volume
- 12
- Issue
- 2
- Pages
- e0167969
- ISSN
- 1932-6203
- PMC
- PMC5289450
- Cited by
- 351
- References
- 5
- Language
- en
About these checks
Registry, retraction, Cites and statistics results are computed, not judged, with one exception: a printed reference that no index lists is read once by a model before it counts as a citation error. Claims are extracted by a model and kept only when their quote appears verbatim in the text; each cited source is then checked, with a model’s help, for whether it says what the claim relies on. Those verdicts can be wrong — read the claim’s quote and the cited source before relying on one.
Statistics and arithmetic are recomputed, not judged.
Confidence bands are shown only for fields calibrated on our annotated test set. None is calibrated yet, so no band is shown.
What counts as a claim ›How we measure confidence ›How we check this ›
Are you an author, or do you see a problem with this page? Request a review
