

The DOI matches its Crossref record; 54 of the 54 references it cites were found in a registry or an index.
The effect of age on the intestinal mucus thickness, microbiota composition and immunity in relation to sex in mice
Open accessAbstract
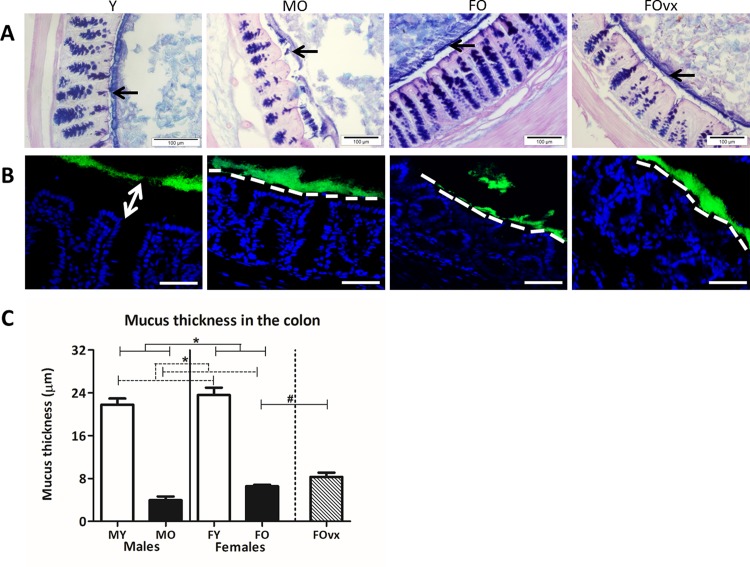
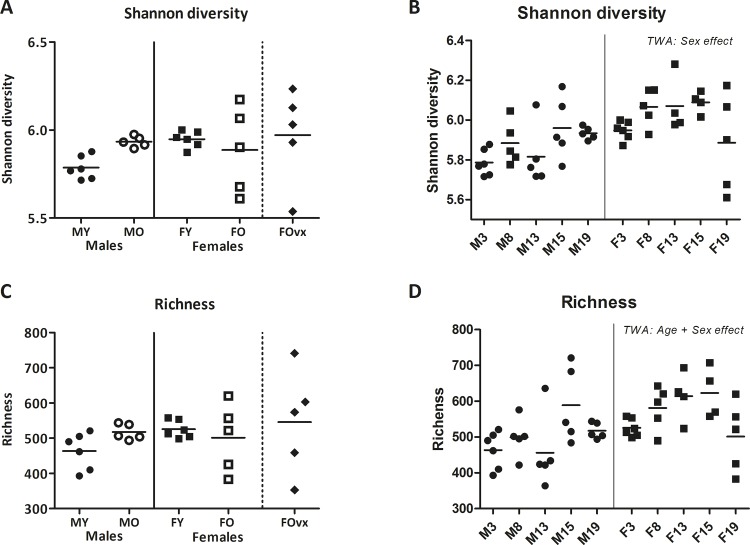
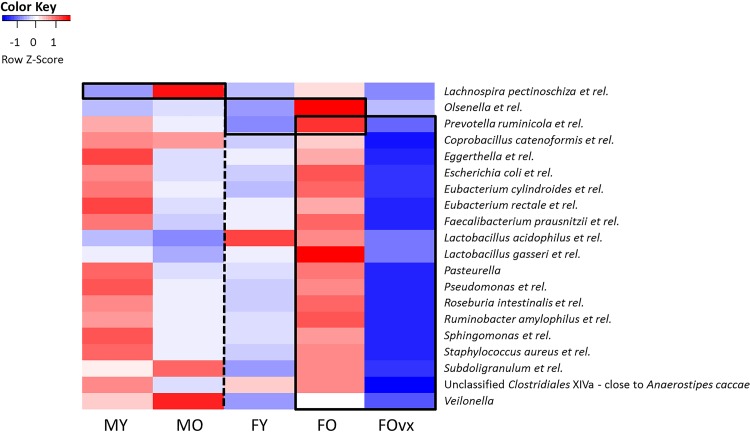
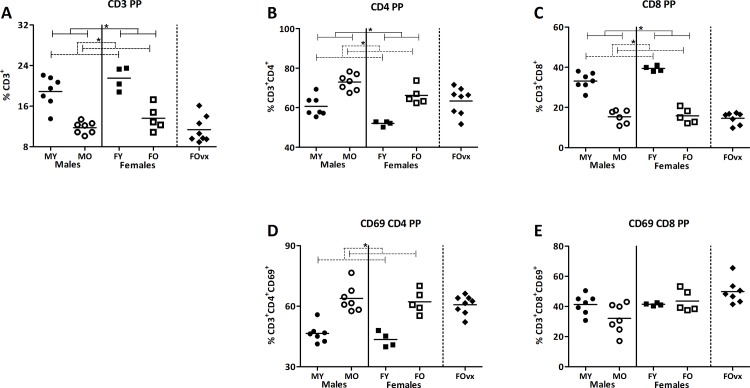
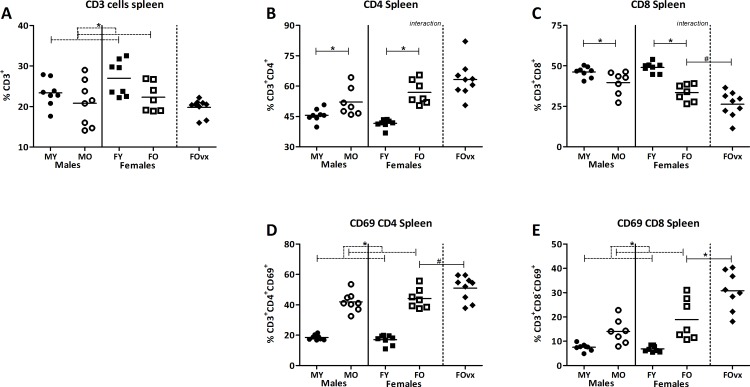
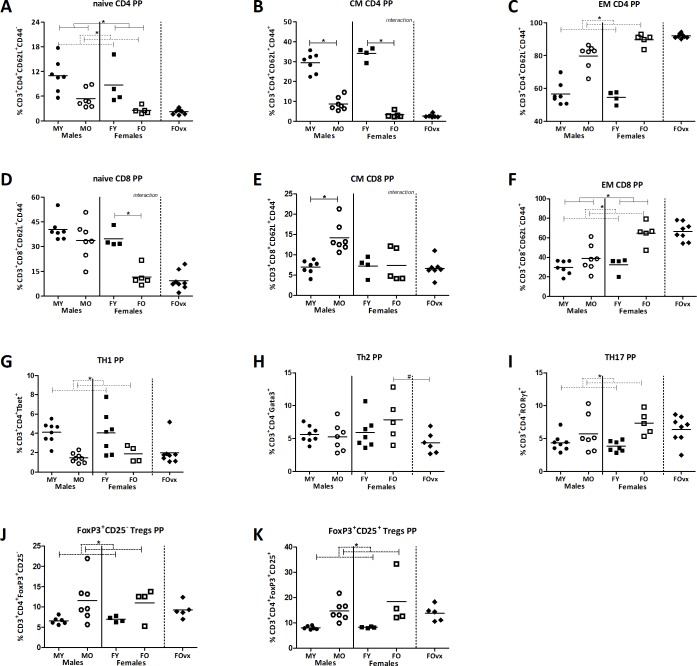
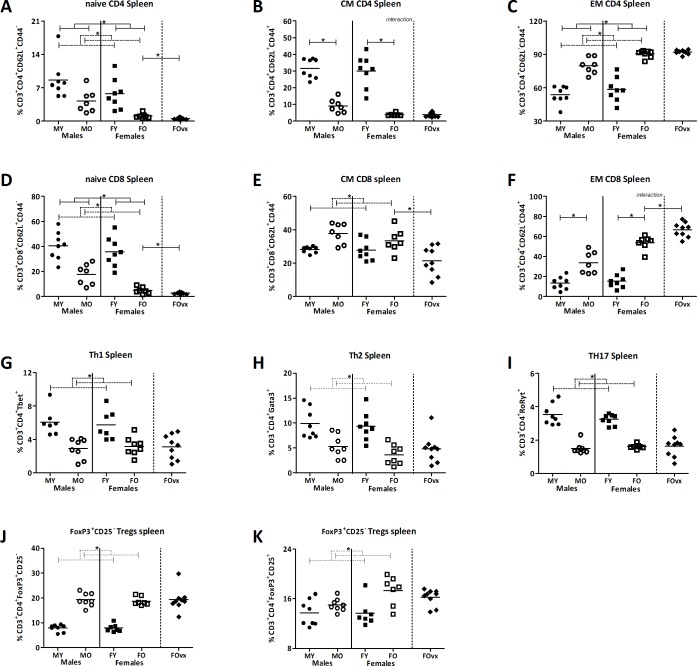
A mucus layer covers and protects the intestinal epithelial cells from direct contact with microbes. This mucus layer not only prevents inflammation but also plays an essential role in microbiota colonization, indicating the complex interplay between mucus composition-microbiota and intestinal health. However, it is unknown whether the mucus layer is influenced by age or sex and whether this contributes to reported differences in intestinal diseases in males and females or with ageing. Therefore, in this study we investigated the effect of age on mucus thickness, intestinal microbiota composition and immune composition in relation to sex. The ageing induced shrinkage of the colonic mucus layer was associated with bacterial penetration and direct contact of bacteria with the epithelium in both sexes. Additionally, several genes involved in the biosynthesis of mucus were downregulated in old mice, especially in males, and this was accompanied by a decrease in abundances of various Lactobacillus species and unclassified Clostridiales type IV and XIV and increase in abundance of the potential pathobiont Bacteroides vulgatus. The changes in mucus and microbiota in old mice were associated with enhanced activation of the immune system as illustrated by a higher percentage of effector T cells in old mice. Our data contribute to a better understanding of the interplay between mucus-microbiota-and immune responses and ultimately may lead to more tailored design of strategies to modulate mucus production in targeted groups.
Overview
The claims and statistics of this paper haven’t been checked yet.
Run the check — free, no account needed. It reads the open-access text and checks the sources it cites.
Integrity signals
Registry
Cites
Statistics
Figures
Verification
Claims the paper makes
The claims and statistics of this paper haven’t been checked yet.
Run the check — free, no account needed. It reads the open-access text and checks the sources it cites.
Claims other papers make about this one
Each is checked against this paper’s own text: does it say what the citing paper says it does?
In the citing paper
“In the aged GI tract, compromised epithelial and mucosal cell turnover, integrity, and function [32, 36, 76, 83] can lead to increased epithelial barrier permeability [19, 75, 118, 120]”
From Fecal microbiota transfer between young and aged mice reverses hallmarks of the aging gut, eye, and brain (2022) · cites this paper as [36]
Self-check
Percentages, sums and reported differences re-computed from the paper’s own numbers.
The self-check needs the paper’s full text.
Citations
Cites
Bolstad, B. M., Irizarry, R. A., Åstrand, M., & Speed, T. P. (2003) · Bioinformatics · doi:10.1093/bioinformatics/19.2.185 · Cited by 8,328
Summaries of Affymetrix GeneChip probe level data
Irizarry, R. A. (2003) · Nucleic Acids Research · doi:10.1093/nar/gng015 · Cited by 4,837
Treg induction by a rationally selected mixture of Clostridia strains from the human microbiota
Atarashi, K., Tanoue, T., Oshima, K., Suda, W., Nagano, Y., Nishikawa, H., Fukuda, S., Saito, T., Narushima, S., Hase, K., et al. (2013) · Nature · doi:10.1038/nature12331 · Cited by 2,872
Coombes, J. L., Siddiqui, K. R. R., Arancibia-Cárcamo, C. V., Hall, J. A., Sun, C., Belkaid, Y., & Powrie, F. M. (2007) · The Journal of Experimental Medicine · doi:10.1084/jem.20070590 · Cited by 2,708
ter Braak, C., & Šmilauer, P. (2002) · Cited by 2,496
Canoco Reference Manual and User’s Guide: Software for Ordination (version 5.0)
ter Braak, C. J. F., & Šmilauer, P. (2012) · Cited by 1,898
Regional specialization within the intestinal immune system
Mowat, A. M., & Agace, W. W. (2014) · Nature reviews. Immunology · doi:10.1038/nri3738 · Cited by 1,882
Evolving gene/transcript definitions significantly alter the interpretation of GeneChip data
Dai, M. (2005) · Nucleic Acids Research · doi:10.1093/nar/gni179 · Cited by 1,807
Intestinal barrier function: molecular regulation and disease pathogenesis
Groschwitz, K. R., & Hogan, S. P. (2009) · Journal of Allergy and Clinical Immunology · doi:10.1016/j.jaci.2009.05.038 · Cited by 1,775
Epidemiology and risk factors for IBD
Ananthakrishnan, A. N. (2015) · Nature Reviews Gastroenterology & Hepatology · doi:10.1038/nrgastro.2015.34 · Cited by 1,741
Cited by
Sorted by citations
Gut Microbiota–Derived Short-Chain Fatty Acids Promote Poststroke Recovery in Aged Mice
Lee, J., d’Aigle, J., Atadja, L. A., Quaicoe, V. A., Honarpisheh, P., Ganesh, B. P., Hassan, A. F., Graf, J., Petrosino, J. F., Putluri, N., et al. (2020) · Circulation Research · doi:10.1161/circresaha.119.316448 · Cited by 567
Materials for oral delivery of proteins and peptides
Brown, T. D., Whitehead, K. A., & Mitragotri, S. (2019) · Nature Reviews Materials · doi:10.1038/s41578-019-0156-6 · Cited by 527
Bao, H., Cao, J., Chen, M., Min, C., Chen, W., Chen, X., Chen, Y., Chen, Y., Chen, Y., Chen, Z., et al. (2023) · Science China Life Sciences · doi:10.1007/s11427-023-2305-0 · Cited by 402
Parker, A., Romano, S., Ansorge, R., Aboelnour, A., Le Gall, G., Savva, G. M., Pontifex, M. G., Telatin, A., Baker, D., Jones, E., et al. (2022) · Microbiome · doi:10.1186/s40168-022-01243-w · Cited by 368
The Gut Microbiota and Unhealthy Aging: Disentangling Cause from Consequence
DeJong, E. N., Surette, M. G., & Bowdish, D. M. E. (2020) · Cell Host & Microbe · doi:10.1016/j.chom.2020.07.013 · Cited by 370
The Confluence of Sex Hormones and Aging on Immunity
Gubbels Bupp, M. R., Potluri, T., Fink, A. L., & Klein, S. L. (2018) · Frontiers in Immunology · doi:10.3389/fimmu.2018.01269 · Cited by 277
Wang, S., Ahmadi, S., Nagpal, R., Jain, S., Mishra, S. P., Kavanagh, K., Zhu, X., Wang, Z., McClain, D. A., Kritchevsky, S. B., et al. (2019) · GeroScience · doi:10.1007/s11357-019-00137-4 · Cited by 235
van der Lugt, B., van Beek, A. A., Aalvink, S., Meijer, B., Sovran, B., Vermeij, W. P., Brandt, R. M. C., de Vos, W. M., Savelkoul, H. F. J., Steegenga, W. T., et al. (2019) · Immunity & Ageing · doi:10.1186/s12979-019-0145-z · Cited by 217
Self-citationAgeing of the gut microbiome: Potential influences on immune senescence and inflammageing
Conway, J., & Duggal, N. A. (2021) · Ageing Research Reviews · doi:10.1016/j.arr.2021.101323 · Cited by 202
Experimental models to study intestinal microbes–mucus interactions in health and disease
Etienne‐Mesmin, L., Chassaing, B., Desvaux, M., Paepe, K. D., Gresse, R., Sauvaitre, T., Forano, É., de Wiele, T. V., Schüller, S., Juge, N., et al. (2019) · FEMS Microbiology Reviews · doi:10.1093/femsre/fuz013 · Cited by 193
Advanced materials for drug delivery across mucosal barriers
Bandi, S. P., Bhatnagar, S., & Venuganti, V. V. K. (2020) · Acta Biomaterialia · doi:10.1016/j.actbio.2020.10.031 · Cited by 182
Intestinal epithelial barrier functions in ageing
Branca, J. J. V., Gulisano, M., & Nicoletti, C. (2019) · Ageing Research Reviews · doi:10.1016/j.arr.2019.100938 · Cited by 165
Sex and strain dependent differences in mucosal immunology and microbiota composition in mice
Elderman, M. E., Hugenholtz, F., Belzer, C., Boekschoten, M. V., van Beek, A. A., de Haan, B., Savelkoul, H. F. J., de Vos, P., & Faas, M. M. (2018) · Biology of Sex Differences · doi:10.1186/s13293-018-0186-6 · Cited by 158
Self-citationMicrobiome evolution during host aging
Aleman, F., & Valenzano, D. R. (2019) · PLoS Pathogens · doi:10.1371/journal.ppat.1007727 · Cited by 139
The pleiotropic effects of prebiotic galacto-oligosaccharides on the aging gut
Arnold, J. W., Roach, J. M., Fabela, S., Moorfield, E., Ding, S., Blue, E., Dagher, S. F., Magness, S. T., Tamayo, R., Bruno-Bárcena, J. M., et al. (2021) · Microbiome · doi:10.1186/s40168-020-00980-0 · Cited by 140
Age-related changes in intestinal immunity and the microbiome
Walrath, T., Dyamenahalli, K. U., Hulsebus, H. J., McCullough, R. L., Idrovo, J., Boe, D. M., McMahan, R. H., & Kovacs, E. J. (2020) · Journal of Leukocyte Biology · doi:10.1002/jlb.3ri0620-405rr · Cited by 129
Sexual dimorphism of cardiometabolic dysfunction: Gut microbiome in the play?
Cross, T.-W. L., Kasahara, K., & Rey, F. E. (2018) · Molecular Metabolism · doi:10.1016/j.molmet.2018.05.016 · Cited by 87
Gut microbiota and renin-angiotensin system: a complex interplay at local and systemic levels
Jaworska, K., Koper, M., & Ufnal, M. (2021) · American Journal of Physiology-Gastrointestinal and Liver Physiology · doi:10.1152/ajpgi.00099.2021 · Cited by 93
The Intestinal Barrier Dysfunction as Driving Factor of Inflammaging
Untersmayr, E., Brandt, A., Koidl, L., & Bergheim, I. (2022) · Nutrients · doi:10.3390/nu14050949 · Cited by 104
Interventions on Gut Microbiota for Healthy Aging
Zeppa, S. D., Agostini, D., Ferrini, F., Gervasi, M., Barbieri, E., Bartolacci, A., Piccoli, G., Saltarelli, R., Sestili, P., & Stocchi, V. (2022) · Cells · doi:10.3390/cells12010034 · Cited by 98
Neto, D. P. A., Bosque, B. P., de Godoy, J. V. P., Rodrigues, P. V., Meneses, D. D., Tostes, K., Tonoli, C. C. C., Carvalho, H. F., González-Billault, C. E., & Fonseca, M. D. C. (2022) · iScience · doi:10.1016/j.isci.2022.103908 · Cited by 90
Role of Microbiota in Sexually Dimorphic Immunity
Elderman, M. E., de Vos, P., & Faas, M. M. (2018) · Frontiers in Immunology · doi:10.3389/fimmu.2018.01018 · Cited by 90
Self-citationAbnormalities in microbiota/butyrate/FFAR3 signaling in aging gut impair brain function
Mishra, S. P., Jain, S., Wang, B., Wang, S., Miller, B. C., Lee, J.-Y., Borlongan, C. V., Jiang, L., Pollak, J., Taraphder, S., et al. (2024) · JCI Insight · doi:10.1172/jci.insight.168443 · Cited by 93
The intestinal immune system and gut barrier function in obesity and ageing
Shemtov, S. J., Emani, R., Bielska, O., Covarrubias, A. J., Verdin, E. M., Andersen, J. K., & Winer, D. A. (2022) · FEBS Journal · doi:10.1111/febs.16558 · Cited by 86
Katoh, T., Ojima, M. N., Sakanaka, M., Ashida, H., Gotoh, A., & Katayama, T. (2020) · Microorganisms · doi:10.3390/microorganisms8040481 · Cited by 80
Hohman, L. S., & Osborne, L. C. (2022) · Aging Cell · doi:10.1111/acel.13700 · Cited by 89
Jang, D., Shin, J., Shim, E., Ohtani, N., & Jeon, O. H. (2024) · Aging Cell · doi:10.1111/acel.14315 · Cited by 84
Sharma, R. (2022) · Probiotics and Antimicrobial Proteins · doi:10.1007/s12602-021-09903-3 · Cited by 81
The ocular surface immune system through the eyes of aging
Galletti, J. G., & de Paiva, C. S. (2021) · The Ocular Surface · doi:10.1016/j.jtos.2021.02.007 · Cited by 78
Zeng, S.-Y., Liu, Y., Liu, J., Zeng, Z., Xie, H., & Liu, J. (2023) · Aging and Disease · doi:10.14336/ad.2023.0325 · Cited by 67
The impact of aging on intestinal mucosal immune function and clinical applications
Han, Z., Zhang, C., Wang, Q., Feng, S., Fang, Y. Q., & Zhang, S. (2022) · Frontiers in Immunology · doi:10.3389/fimmu.2022.1029948 · Cited by 63
Aged intestinal stem cells propagate cell-intrinsic sources of inflammaging in mice
Funk, M. C., Gleixner, J., Heigwer, F., Vonficht, D., Valentini, E., Aydin, Z., Tonin, E., Prete, S., Mahara, S., Throm, Y., et al. (2023) · Developmental Cell · doi:10.1016/j.devcel.2023.11.013 · Cited by 62
Qi, Y., He, J., Zhang, Y., Ge, Q., Wang, Q., Chen, L., Xu, J., Wang, L., Chen, X., Jia, D., et al. (2023) · Nature Communications · doi:10.1038/s41467-023-41827-0 · Cited by 58
An overview on the interplay between nutraceuticals and gut microbiota
Cătinean, A., Neag, M. A., Muntean, D. M., Bocșan, I. C., & Buzoianu, A. D. (2018) · PeerJ · doi:10.7717/peerj.4465 · Cited by 56
Limage, R., Tako, E., Kolba, N., Guo, Z., García‐Rodríguez, A., Marques, C. N. H., & Mahler, G. J. (2020) · Small · doi:10.1002/smll.202000601 · Cited by 53
Nutritional Characteristics, Health Impact, and Applications of Kefir
Apalowo, O. E., Adegoye, G. A., Mbogori, T. N., Kandiah, J., & Obuotor, T. M. (2024) · Foods · doi:10.3390/foods13071026 · Cited by 54
Lépine, A. F. P., de Wit, N., Oosterink, E., Wichers, H. J., Mes, J. J., & de Vos, P. (2018) · Frontiers in Microbiology · doi:10.3389/fmicb.2018.01439 · Cited by 49
Chikina, A. S., & Vignjevic, D. M. (2021) · Cells and Development · doi:10.1016/j.cdev.2021.203712 · Cited by 52
Xu, L., Sun, X., Wan, X., Li, K., Jian, F., Li, W., Jiang, R., Han, R., Li, H., Kang, X., et al. (2021) · Animal nutrition · doi:10.1016/j.aninu.2021.01.009 · Cited by 45
Bifidobacterium and the intestinal mucus layer
Gutierrez, A., Puckett, B., & Engevik, M. A. (2023) · Microbiome Research Reports · doi:10.20517/mrr.2023.37 · Cited by 48
Growth Hormone Deficiency and Excess Alter the Gut Microbiome in Adult Male Mice
Jensen, E., Young, J. A., Jackson, Z., Busken, J., List, E. O., Carroll, R. K., Kopchick, J. J., Murphy, E. R., & Berryman, D. E. (2020) · Endocrinology · doi:10.1210/endocr/bqaa026 · Cited by 42
Age-Related Mucus Barrier Dysfunction in Mice Is Related to the Changes in Muc2 Mucin in the Colon
Sang, X.-Q., Wang, Q., Ning, Y., Wang, H. H., Zhang, R., Li, Y., Fang, B., Lv, C., Zhang, Y., Wang, X., et al. (2023) · Nutrients · doi:10.3390/nu15081830 · Cited by 42
Gut Microbiota and Aging: Traditional Chinese Medicine and Modern Medicine
Li, J., Li, D., Chen, Y., Chen, W., Xu, J., & Gao, L. (2023) · Clinical Interventions in Aging · doi:10.2147/cia.s414714 · Cited by 37
The role of stem cell niche in intestinal aging
Pentinmikko, N., & Katajisto, P. (2020) · Mechanisms of Ageing and Development · doi:10.1016/j.mad.2020.111330 · Cited by 39
Figueroa, T., Bessière, P., Coggon, A., Bouwman, K. M., van der Woude, R., Delverdier, M. E., Verheije, M. H., de Vries, R. P., & Volmer, R. (2020) · Journal of Virology · doi:10.1128/jvi.00289-20 · Cited by 41
Microbial Stimulation Reverses the Age-Related Decline in M Cells in Aged Mice
Donaldson, D. S., Pollock, J., Vohra, P., Stevens, M. P., & Mabbott, N. A. (2020) · iScience · doi:10.1016/j.isci.2020.101147 · Cited by 36
Baidoo, N., & Sanger, G. J. (2024) · Experimental and Molecular Pathology · doi:10.1016/j.yexmp.2024.104923 · Cited by 35
Age-related alterations in gut homeostasis are microbiota dependent
Jing, Y., Wang, Q., Bai, F., Li, Z., Li, Y., Liu, W., Yan, Y., Zhang, S., Chen, G., & Yu, Y. (2025) · npj Biofilms and Microbiomes · doi:10.1038/s41522-025-00677-y · Cited by 42
Schepelmann, M., Kupper, N., Gushchina, V., Mesteri, I., Manhardt, T., Moritsch, S., Müller, C. J., Piatek, K., Salzmann, M., Vlasaty, A., et al. (2022) · International Journal of Molecular Sciences · doi:10.3390/ijms23095278 · Cited by 33
Xu, K., Guo, Y., Wang, Y., Ren, Y., Low, V., Cho, S., Ping, L., Peng, K., Li, X., Qiu, Y., et al. (2022) · Aging Cell · doi:10.1111/acel.13760 · Cited by 31
Gut-spine axis: a possible correlation between gut microbiota and spinal degenerative diseases
Morimoto, T., Kobayashi, T., Kakiuchi, T., Esaki, M., Tsukamoto, M., Yoshihara, T., Hirata, H., Yabuki, S., & Mawatari, M. (2023) · Frontiers in Microbiology · doi:10.3389/fmicb.2023.1290858 · Cited by 32
Alp, D., & Kuleaşan, H. (2020) · Bioscience of Microbiota Food and Health · doi:10.12938/bmfh.2020-033 · Cited by 31
Infant gut microbiota modulation by human milk disaccharides in humanized microbiome mice
Rubio‐del‐Campo, A., Gozalbo‐Rovira, R., Moya-Gonzálvez, E. M., Alberola, J., Rodríguez‐Díaz, J., & Yebra, M. J. (2021) · Gut Microbes · doi:10.1080/19490976.2021.1914377 · Cited by 31
Improving intestinal inflammaging to delay aging? A new perspective
Zhang, L., Yan, J., Zhang, C., Feng, S., Zhan, Z., Bao, Y., Zhan, Z., & Chao, G. (2023) · Mechanisms of Ageing and Development · doi:10.1016/j.mad.2023.111841 · Cited by 27
The complex puzzle of dietary silver nanoparticles, mucus and microbiota in the gut
Bi, Y., Marcus, A. K., Robert, H., Krajmalnik‐Brown, R., Rittmann, B. E., Westerhoff, P. K., Ropers, M., & Mercier‐Bonin, M. (2020) · Journal of Toxicology and Environmental Health Part B · doi:10.1080/10937404.2019.1710914 · Cited by 27
Chittimalli, K., Jahan, J., Sakamuri, A., McAdams, Z. L., Ericsson, A. C., & Jarajapu, Y. P. R. (2023) · Clinical Science · doi:10.1042/cs20220904 · Cited by 25
The role of glycosylated mucins in maintaining intestinal homeostasis and gut health
Cheng, H., Li, H., Li, Z., Yun, W., Liu, L., Wang, J., Ma, X., & Tan, B. (2025) · Animal nutrition · doi:10.1016/j.aninu.2025.03.004 · Cited by 27
Crossland, N. A., Beck, S., Tan, W. Y., Lo, M., Mason, J. B., Zhang, C., Guo, W., & Crott, J. W. (2023) · Gut Microbes · doi:10.1080/19490976.2023.2288187 · Cited by 25
Elderman, M. E., Hugenholtz, F., Belzer, C., Boekschoten, M. V., de Haan, B., de Vos, P., & Faas, M. M. (2018) · Scientific Reports · doi:10.1038/s41598-018-28292-2 · Cited by 26
Self-citationFunctions of human olfactory mucus and age-dependent changes
Shirai, T., Takase, D., Yokoyama, J., Nakanishi, K., Uehara, C., Saito, N., Kato-Namba, A., & Yoshikawa, K. (2023) · Scientific Reports · doi:10.1038/s41598-023-27937-1 · Cited by 23
Pednekar, D. D., Liguori, M., Marques, C. N. H., Zhang, T., Zhang, N., Zhou, Z., Amoako, K. A., & Gu, H. (2022) · ACS Biomaterials Science & Engineering · doi:10.1021/acsbiomaterials.2c00182 · Cited by 25
Filtered Kombucha tea ameliorates the leaky gut syndrome in young and old mice model of colitis.
Pakravan, N., Kermanian, F., & Mahmoudi, E. (2019) · PubMed Central · doi:10.22038/ijbms.2019.36189.8622 · Cited by 21
Microbial–Immune Crosstalk in Elderly-Onset Inflammatory Bowel Disease: Unchartered Territory
Meng, G., Monaghan, T. M., Duggal, N. A., Tighe, P., & Peerani, F. (2023) · Journal of Crohn s and Colitis · doi:10.1093/ecco-jcc/jjad025 · Cited by 21
Food Polyelectrolytes Compress the Colonic Mucus Hydrogel by a Donnan Mechanism
Steinberg, A. P., Wang, Z., & Ismagilov, R. F. (2019) · Biomacromolecules · doi:10.1021/acs.biomac.9b00442 · Cited by 20
Missong, H., Joshi, R., Khullar, N., Thareja, S., Navik, U., Bhatti, G. K., & Bhatti, J. S. (2024) · The Journal of Nutritional Biochemistry · doi:10.1016/j.jnutbio.2024.109592 · Cited by 20
Mini-Review: Gut-Microbiota and the Sex-Bias in Autoimmunity – Lessons Learnt From Animal Models
Rosser, E. C., de Gruijter, N. M., & Matei, D. E. (2022) · Frontiers in Medicine · doi:10.3389/fmed.2022.910561 · Cited by 22
Excess Growth Hormone Alters the Male Mouse Gut Microbiome in an Age-dependent Manner
Jensen, E., Young, J. A., Jackson, Z., Busken, J., Kuhn, J., Onusko, M., Carroll, R. K., List, E. O., Brown, J. M., Kopchick, J. J., et al. (2022) · Endocrinology · doi:10.1210/endocr/bqac074 · Cited by 16
Enhanced sensitivity to cholera toxin in female ADP-ribosylarginine hydrolase (ARH1)-deficient mice
Watanabe, K., Kato, J., Zhu, J., Oda, H., Ishiwata-Endo, H., & Moss, J. (2018) · PLoS ONE · doi:10.1371/journal.pone.0207693 · Cited by 17
Li, Z., Peirasmaki, D., Svärd, S. G., & Åbrink, M. (2020) · Cells · doi:10.3390/cells9040925 · Cited by 17
Loss of GalNAc-T14 links O-glycosylation defects to alterations in B cell homing in IgA nephropathy
Prakash, S., Steers, N. J., Li, Y., Sánchez, E., Verbitsky, M., Robbins, I., Simpson, J., Pathak, S., Raška, M., Reily, C., et al. (2025) · Journal of Clinical Investigation · doi:10.1172/jci181164 · Cited by 16
Sané, F., Scuotto, A., Pierrat, V., Kacet, N., Hober, D., & Romond, M. (2018) · The Journal of Nutritional Biochemistry · doi:10.1016/j.jnutbio.2018.08.017 · Cited by 16
Bacterial species to be considered in quality assurance of mice and rats
Hansen, A. K., Nielsen, D. S., Krych, Ł., & Hansen, C. H. F. (2019) · Laboratory Animals · doi:10.1177/0023677219834324 · Cited by 16
Plant polyphenols delay aging: A review of their anti-aging mechanisms and bioavailability
Zhang, H., Wang, F., Wang, L., Du, J., & Li, Y. (2025) · Food Research International · doi:10.1016/j.foodres.2025.116900 · Cited by 17
Kable, M. E., Riazati, N., Kirschke, C. P., Zhao, J., Tepaamorndech, S., & Huang, L. (2020) · PLoS ONE · doi:10.1371/journal.pone.0239681 · Cited by 15
Guibourdenche, M., Sabbouri, H. E. K. E., Djekkoun, N., Khorsi‐Cauet, H., Bach, V., Anton, P. M., & Gay‐Queheillard, J. (2021) · Scientific Reports · doi:10.1038/s41598-021-90981-2 · Cited by 15
Intestinal aging-related immune dysfunction: mechanisms and interventions
Shen, X., Gao, X., & Wang, L. (2025) · Acta Biochimica et Biophysica Sinica · doi:10.3724/abbs.2025157 · Cited by 13
Gao, H., Wang, K., Suárez, J., Jin, Z., Rocha, K. C. E., Zhang, D., Farrell, A., Truong, T., Tekin, Y., Tan, B., et al. (2023) · Frontiers in Immunology · doi:10.3389/fimmu.2023.1216344 · Cited by 14
Biocompatible smart micro/nanorobots for active gastrointestinal tract drug delivery
Zhang, B., Zhu, L., Pan, H., & Cai, L. (2023) · Expert Opinion on Drug Delivery · doi:10.1080/17425247.2023.2270915 · Cited by 13
Gut microb-aging and its relevance to frailty aging
Cosquer, G. L., Vergnolle, N., & Motta, J. (2024) · Microbes and Infection · doi:10.1016/j.micinf.2024.105309 · Cited by 16
Ren, C., Dokter‐Fokkens, J., Figueroa‐Lozano, S., Zhang, Q., de Haan, B. J., Zhang, H., Faas, M. M., & de Vos, P. (2019) · Molecular Nutrition & Food Research · doi:10.1002/mnfr.201801427 · Cited by 11
Self-citationAging, Cutaneous Burn Injury and Multi-Organ Complications: The Role of the Gut
McMahan, R. H., Boe, D. M., Walrath, T., Idrovo, J., & Kovacs, E. J. (2022) · Advances in Geriatric Medicine and Research · doi:10.20900/agmr20220004 · Cited by 11
The Role of Iron in Intestinal Mucus: Perspectives from Both the Host and Gut Microbiota
Liu, S., Yin, J., Wan, D., & Yin, Y. (2024) · Advances in Nutrition · doi:10.1016/j.advnut.2024.100307 · Cited by 12
Calvigioni, M., Mazzantini, D., Celandroni, F., Vozzi, G., & Ghelardi, E. (2024) · Microbial Biotechnology · doi:10.1111/1751-7915.70036 · Cited by 10
Alcohol, aging, and the gut microbiome: Intersections of immunity, barrier dysfunction, and disease
Melamed, E., Rungratanawanich, W., Liangpunsakul, S., Maki, K. A., McCullough, R. L., & Llorente, C. (2025) · Alcohol · doi:10.1016/j.alcohol.2025.07.001 · Cited by 13
Mishra, S. P., Wang, B., Wang, S., Nagpal, R., Miller, B. C., Jain, S., Lee, J.-Y., Borlongan, C. V., Taraphdar, S., Rane, S. G., et al. (2021) · bioRxiv (Cold Spring Harbor Laboratory) · doi:10.1101/2021.08.18.456856 · Cited by 11
Chen, L., Zhao, L., Zhang, G., Li, Z., Qu, L., & Luo, L. (2024) · Food & Function · doi:10.1039/d4fo00781f · Cited by 9
Li, Y., Li, X., Xue, Q., Wang, J., & Tan, J. (2021) · Experimental Gerontology · doi:10.1016/j.exger.2021.111404 · Cited by 9
The Gut Microbiome in Aging and Ovarian Cancer
Dominique, G. M., Hammond, C., & Stack, M. S. (2024) · Aging and Cancer · doi:10.1002/aac2.12071 · Cited by 8
Determination of Mucoadhesion of Polyvinyl Alcohol Films to Human Intestinal Tissue
Müller, L., Rosenbaum, C., Rump, A., Grimm, M. F., Klammt, F., Kleinwort, A., Busemann, A., & Weitschies, W. (2023) · Pharmaceutics · doi:10.3390/pharmaceutics15061740 · Cited by 8
Heterochronic Fecal Microbiota Transfer Reverses Hallmarks of the Aging Murine Gut, Eye and BrainPreprint
Parker, A., Romano, S., Ansorge, R., Aboelnoer, A., Gall, G. L., Savva, G. M., Telatin, A., Jones, E. J., Baker, D., Rudder, S. J., et al. (2021) · SSRN Electronic Journal · doi:10.2139/ssrn.3811833 · Cited by 8
A Small Intestinal Helminth Infection Alters Colonic Mucus and Shapes the Colonic Mucus Microbiome
Mules, T. C., Vacca, F., Cait, A., Yumnam, B., Schmidt, A., Lavender, B., Maclean, K., Noble, S., Gasser, O., Camberis, M., et al. (2024) · International Journal of Molecular Sciences · doi:10.3390/ijms252212015 · Cited by 6
Castro-Córdova, P., Mendoza-León, M. J., & Paredes‐Sabja, D. (2021) · PLoS ONE · doi:10.1371/journal.pone.0261081 · Cited by 6
Szymaszkiewicz, A., Szymaszkiewicz, K., Fichna, J., & Zielińska, M. (2021) · Postępy Biochemii · doi:10.18388/pb.2021_367 · Cited by 6
Fırıncı, B., Çağlar, Ö., Karadeniz, E., Ahişkalıoğlu, A., Demirci, T., & Aydın, M. D. (2019) · Medical Hypotheses · doi:10.1016/j.mehy.2019.02.032 · Cited by 6
How aging affects bone health via the intestinal micro-environment
Hu, H., HUANG, Y., LIU, F., WANG, Q., & YAO, Y. (2024) · Biocell · doi:10.32604/biocell.2024.048311 · Cited by 5
Deficiency of Gut-Enriched Lipase H Promotes Gut Aging and Reduces Lifespan in Drosophila
Sun, Y., Ma, H., Zhou, X., Huang, L., Yu, P. F., Qi, Y., Wei, G., & Ni, T. (2024) · Phenomics · doi:10.1007/s43657-024-00187-5 · Cited by 6
Dwaib, H. S., AlZaim, I., Ajouz, G., Eid, A. H., & EL‐Yazbi, A. F. (2021) · Molecular Pharmacology · doi:10.1124/molpharm.121.000338 · Cited by 5
Lee, C. Z., Worsley, S. F., Davies, C. S., Sılan, E., Burke, T. A., Komdeur, J., Hildebrand, F., Dugdale, H. L., & Richardson, D. S. (2025) · ISME Communications · doi:10.1093/ismeco/ycaf008 · Cited by 7
Progress and Perspectives on the Estrogen–Microbiota–Brain Axis in Alzheimer’s Disease
Wang, M., Zeng, Y., Jin, Y., Wu, J., & Li, J. (2025) · Neurochemical Research · doi:10.1007/s11064-025-04613-6 · Cited by 4
Lin, X., Singh, A., Shan, X., Tawch, S., Sakarin, I., Bahadur, T., Abbott, D., McLinskey, N., Melville, P., Fries, B. C., et al. (2026) · Mucosal Immunology · doi:10.1016/j.mucimm.2026.100377 · Cited by 8
Metadata
- Authors
- Elderman, M., Sovran, B., Hugenholtz, F., Graversen, K., Huijskes, M., Houtsma, E., Belzer, C., Boekschoten, M., de Vos, P., Dekker, J., Wells, J., & Faas, M.
- Affiliations
- University of Groningen (NL)
- Wageningen University & Research (NL)
- University Medical Center Groningen (NL)
- Corresponding author
- Elderman, Marlies
- ORCID
- Venue
- PLOS ONE
- Publisher
- Public Library of Science (PLoS)
- Published
- 2017-09-12
- Volume
- 12
- Issue
- 9
- Pages
- e0184274
- ISSN
- 1932-6203 (ISSN-L)
- PMC
- PMC5595324
- OpenAlex
- W2754189939
- Cited by
- 145
- References
- 54
- Citations by year
- 2026: 10 · 2025: 12 · 2024: 13 · 2023: 19 · 2022: 22 · 2021: 25 · 2020: 20 · 2019: 15 · 2018: 9
- FWCI
- 4.92
- Type
- journal article
- Language
- en
- Open access
- gold
- doi.org
- Licence
- Locations
- PLoS ONE (publishedVersion, cc-by)
- PubMed Central (publishedVersion, cc-by)
- PubMed (publishedVersion)
- University of Groningen research database (University of Groningen / Centre for Information Technology) (publishedVersion, cc-by)
- Socio-Environmental Systems Modeling (acceptedVersion, cc-by)
- DOAJ (DOAJ: Directory of Open Access Journals) (submittedVersion, cc-by-sa)
- Figshare (submittedVersion, cc-by)
- University of Groningen research database (University of Groningen / Centre for Information Technology) (submittedVersion, cc-by)
- Data Archiving and Networked Services (DANS) (submittedVersion, cc-by)
- Funders
- Top Institute Food and Nutrition (GH002)
- Topics
- Life Sciences › Biochemistry, Genetics and Molecular Biology › Molecular Biology › Gut microbiota and health
- Life Sciences › Agricultural and Biological Sciences › Animal Science and Zoology › Animal Nutrition and Physiology
- Health Sciences › Medicine › Gastroenterology › Gastrointestinal motility and disorders
- Keywords
- aging, sex differences, gut microbiota, colonic mucus layer, Lactobacillus, Bacteroides vulgatus, Clostridiales, effector T cells, intestinal immunity, mice
- MeSH terms
- Gastrointestinal Microbiome, Age Factors, Aging, Animals, Cell Differentiation, Colon, Dendritic Cells, Female, Gene Expression Regulation, Intestinal Mucosa, Male, Mucus, Peyer's Patches, Sex Factors, Spleen, T-Lymphocytes, Signal Transduction, Immunity, Mucosal, Gene Expression Profiling, Biodiversity, Mice, Metagenome, Metagenomics, Transcriptome
About these checks
Registry, retraction, Cites and statistics results are computed, not judged, with one exception: a printed reference that no index lists is read once by a model before it counts as a citation error. Claims are extracted by a model and kept only when their quote appears verbatim in the text; each cited source is then checked, with a model’s help, for whether it says what the claim relies on. Those verdicts can be wrong — read the claim’s quote and the cited source before relying on one.
Statistics and arithmetic are recomputed, not judged.
Confidence bands are shown only for fields calibrated on our annotated test set. None is calibrated yet, so no band is shown.
What counts as a claim ›How we measure confidence ›How we check this ›
Are you an author, or do you see a problem with this page? Request a review
