

The DOI matches its Crossref record; 25 of the 25 references it cites were found in a registry or an index.
Using Bluetooth proximity sensing to determine where office workers spend time at work
Open accessAbstract
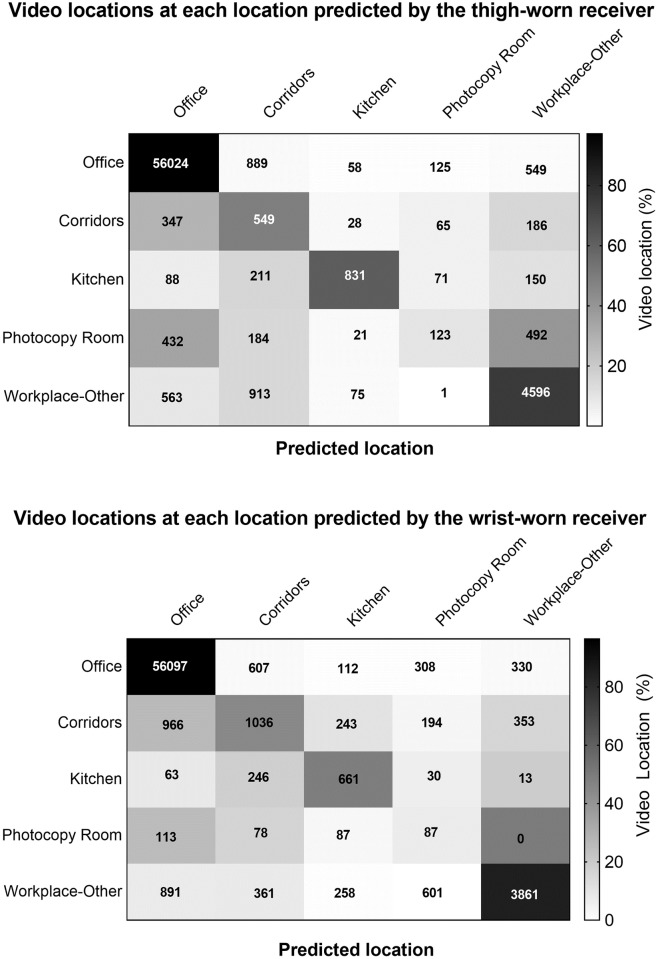
BACKGROUND: Most wearable devices that measure movement in workplaces cannot determine the context in which people spend time. This study examined the accuracy of Bluetooth sensing (10-second intervals) via the ActiGraph GT9X Link monitor to determine location in an office setting, using two simple, bespoke algorithms. METHODS: For one work day (mean±SD 6.2±1.1 hours), 30 office workers (30% men, aged 38±11 years) simultaneously wore chest-mounted cameras (video recording) and Bluetooth-enabled monitors (initialised as receivers) on the wrist and thigh. Additional monitors (initialised as beacons) were placed in the entry, kitchen, photocopy room, corridors, and the wearer's office. Firstly, participant presence/absence at each location was predicted from the presence/absence of signals at that location (ignoring all other signals). Secondly, using the information gathered at multiple locations simultaneously, a simple heuristic model was used to predict at which location the participant was present. The Bluetooth-determined location for each algorithm was tested against the camera in terms of F-scores. RESULTS: When considering locations individually, the accuracy obtained was excellent in the office (F-score = 0.98 and 0.97 for thigh and wrist positions) but poor in other locations (F-score = 0.04 to 0.36), stemming primarily from a high false positive rate. The multi-location algorithm exhibited high accuracy for the office location (F-score = 0.97 for both wear positions). It also improved the F-scores obtained in the remaining locations, but not always to levels indicating good accuracy (e.g., F-score for photocopy room ≈0.1 in both wear positions). CONCLUSIONS: The Bluetooth signalling function shows promise for determining where workers spend most of their time (i.e., their office). Placing beacons in multiple locations and using a rule-based decision model improved classification accuracy; however, for workplace locations visited infrequently or with considerable movement, accuracy was below desirable levels. Further development of algorithms is warranted.
Overview
The claims and statistics of this paper haven’t been checked yet.
Run the check — free, no account needed. It reads the open-access text and checks the sources it cites.
Integrity signals
Registry
Cites
Statistics
Figures

Verification
Claims the paper makes
The claims and statistics of this paper haven’t been checked yet.
Run the check — free, no account needed. It reads the open-access text and checks the sources it cites.
Claims other papers make about this one
Each is checked against this paper’s own text: does it say what the citing paper says it does?
The source backs part of the claim, not all of it — or backs it for a different population, condition or comparison.
In the citing paper
“The continuously recorded NBDC data represents a mixed signal that has been used to estimate individuals’ behaviors and statuses, including face-to-face social interactions [8-10], working status [11], mobility [12], and isolation and loneliness [13,14].”
From Predicting depressive symptom severity through individuals’ nearby Bluetooth device count data collected by mobile phones: preliminary longitudinal study (2021) · cites this paper as [11]
Experimental — accuracy not yet measuredIn the citing paper
“Activities in an independent sample of 98 participants (age 56.4 ± 15.7 years ; 53.1% female) from the US51”
From Association of wearable device-measured vigorous intermittent lifestyle physical activity with mortality (2022) · cites this paper as [52]
Self-check
Percentages, sums and reported differences re-computed from the paper’s own numbers.
The self-check needs the paper’s full text.
Citations
Cites
Evolution of accelerometer methods for physical activity research
Troiano, R. P., McClain, J. J., Brychta, R. J., & Chen, K. Y. (2014) · British Journal of Sports Medicine · doi:10.1136/bjsports-2014-093546 · Cited by 968
Sedentary behavior and health outcomes: an overview of systematic reviews.
Rezende, L. F. M. D., Rodrigues Lopes, M., Rey-López, J. P., Matsudo, V. K. R., & Luiz, O. D. C. (2014) · PLoS ONE · doi:10.1371/journal.pone.0105620 · Cited by 965
Model selection and overfitting
Lever, J., Krzywinski, M., & Altman, N. (2016) · Nature Methods · doi:10.1038/nmeth.3968 · Cited by 694
Sedentary Behaviors and Health Outcomes Among Adults
Proper, K. I., Singh, A. S., van Mechelen, W., & Chinapaw, M. J. M. (2011) · American Journal of Preventive Medicine · doi:10.1016/j.amepre.2010.10.015 · Cited by 633
Buman, M. P., Winkler, E. A. H., Kurka, J. M., Hekler, E. B., Baldwin, C. M., Owen, N., Ainsworth, B. E., Healy, G. N., & Gardiner, P. A. (2014) · American Journal of Epidemiology · doi:10.1093/aje/kwt292 · Cited by 427
Self-citationReplacing sitting time with standing or stepping: associations with cardio-metabolic risk biomarkers
Healy, G. N., Winkler, E. A. H., Owen, N., Anuradha, S., & Dunstan, D. W. (2015) · European Heart Journal · doi:10.1093/eurheartj/ehv308 · Cited by 310
Self-citationUtilization and Harmonization of Adult Accelerometry Data: Review and Expert Consensus
WIJNDAELE, K., WESTGATE, K., STEPHENS, S. K., BLAIR, S. N., BULL, F. C., CHASTIN, S. F. M., DUNSTAN, D. W., EKELUND, U., ESLIGER, D. W., FREEDSON, P. S., et al. (2015) · Medicine & Science in Sports & Exercise · doi:10.1249/mss.0000000000000661 · Cited by 297
Self-citationObesity and Trends in Life Expectancy
Walls, H. L., Backholer, K., Proietto, J., & McNeil, J. J. (2012) · Journal of Obesity · doi:10.1155/2012/107989 · Cited by 182
Doherty, A. R., Hodges, S. E., King, A. C., Smeaton, A. F., Berry, E., Moulin, C. J. A., Lindley, S., Kelly, P., & Foster, C. (2013) · American Journal of Preventive Medicine · doi:10.1016/j.amepre.2012.11.008 · Cited by 173
Kelly, P., Doherty, A., Berry, E., Hodges, S. E., Batterham, A. M., & Foster, C. E. (2011) · International Journal of Behavioral Nutrition and Physical Activity · doi:10.1186/1479-5868-8-44 · Cited by 144
Cited by
Stamatakis, E., Ahmadi, M. N., Gill, J. M. R., Thøgersen-Ntoumani, C., Gibala, M. J., Doherty, A., & Hamer, M. (2022) · Nature Medicine · doi:10.1038/s41591-022-02100-x · Cited by 336
“Activities in an independent sample of 98 participants (age 56.4 ± 15.7 years ; 53.1% female) from the US 51 (University of California Irvine Center for Machine Learning and Intelligent Systems Physical Activity Monitoring for Aging People study (published data), accessible at https://archive.ics.uci.edu/ml/datasets)…”
InfluentialZhang, Y., Folarin, A. A., Sun, S., Cummins, N., Ranjan, Y., Rashid, Z., Conde, P., Stewart, C., Laiou, P., Matcham, F., et al. (2021) · JMIR mHealth and uHealth · doi:10.2196/29840 · Cited by 68
“The continuously recorded NBDC data represents a mixed signal that has been used to estimate individuals’ behaviors and statuses, including face-to-face social interactions [8-10], working status [11], mobility [12], and isolation and loneliness [13,14].”
BackgroundDempsey, P. C., Hadgraft, N. T., WINKLER, E. A. H., Clark, B., Buman, M. P., Gardiner, P. A., Owen, N. G., Lynch, B. M., & Dunstan, D. W. (2018) · International Journal of Behavioral Nutrition and Physical Activity · doi:10.1186/s12966-018-0748-3 · Cited by 66
Self-citationKunhoth, J., Karkar, A., Al-Maadeed, S. A., & Al-Attiyah, A. A. (2019) · International Journal of Health Geographics · doi:10.1186/s12942-019-0193-9 · Cited by 58
“The most used position estimation techniques are lateration [10], BLE fingerprinting [11] and proximity sensing [12].”
MethodTrost, S. G., & Brookes, D. S. K. (2020) · Journal of Sports Sciences · doi:10.1080/02640414.2020.1826657 · Cited by 67
Self-citation
Metadata
- Authors
- Clark, B. K., Winkler, E. A., Brakenridge, C. L., Trost, S. G., & Healy, G. N.
- Affiliations
- The University of Queensland (AU)
- Queensland University of Technology (AU)
- Corresponding author
- Clark, Bronwyn K.
- ORCID
- Venue
- PLOS ONE
- Publisher
- Public Library of Science (PLoS)
- Published
- 2018-03-07
- Volume
- 13
- Issue
- 3
- Pages
- e0193971
- ISSN
- 1932-6203 (ISSN-L)
- PMC
- PMC5841797
- OpenAlex
- W2789492349
- Cited by
- 40
- References
- 25
- Citations by year
- 2025: 5 · 2024: 1 · 2023: 4 · 2022: 6 · 2021: 8 · 2020: 7 · 2019: 6 · 2018: 3
- FWCI
- 3.00
- Type
- journal article
- Language
- en
- Open access
- gold
- doi.org
- Licence
- Locations
- PLoS ONE (publishedVersion, cc-by)
- PubMed Central (publishedVersion, cc-by)
- PubMed (publishedVersion)
- QUT ePrints (Queensland University of Technology) (submittedVersion, cc-by)
- RePEc: Research Papers in Economics (submittedVersion)
- DOAJ (DOAJ: Directory of Open Access Journals) (submittedVersion, cc-by-sa)
- Figshare (submittedVersion, cc-by)
- Funders
- The University of Queensland (611434)
- Topics
- Physical Sciences › Computer Science › Computer Vision and Pattern Recognition › Context-Aware Activity Recognition Systems
- Physical Sciences › Engineering › Electrical and Electronic Engineering › Indoor and Outdoor Localization Technologies
- Social Sciences › Transportation › Human Mobility and Location-Based Analysis
- Keywords
- office workers, wearable activity trackers, Bluetooth beacons
- MeSH terms
- Adult, Algorithms, Behavior, Female, Humans, Male, Middle Aged, Models, Theoretical, Occupations, Task Performance and Analysis, Universities, Video Recording, Workplace, Actigraphy, Wireless Technology
About these checks
Registry, retraction, Cites and statistics results are computed, not judged, with one exception: a printed reference that no index lists is read once by a model before it counts as a citation error. Claims are extracted by a model and kept only when their quote appears verbatim in the text; each cited source is then checked, with a model’s help, for whether it says what the claim relies on. Those verdicts can be wrong — read the claim’s quote and the cited source before relying on one.
Statistics and arithmetic are recomputed, not judged.
Confidence bands are shown only for fields calibrated on our annotated test set. None is calibrated yet, so no band is shown.
What counts as a claim ›How we measure confidence ›How we check this ›
Are you an author, or do you see a problem with this page? Request a review
How to cite
Cite CoChat for the checks on this page, and the paper for its own findings.
- This page
- CoChat. (2026). Citation check: Using Bluetooth proximity sensing to determine where office workers spend time at work. https://app.cochat.ai/papers/10.1371/journal.pone.0193971
- The paper
- Clark, B. K., Winkler, E. A., Brakenridge, C. L., Trost, S. G., & Healy, G. N. (2018). Using Bluetooth proximity sensing to determine where office workers spend time at work. PLOS ONE. https://doi.org/10.1371/journal.pone.0193971
Data sources
Bibliographic data: Semantic Scholar, OpenAlex, Crossref.
Contains information from the Semantic Scholar Academic Graph Datasets, made available under the ODC Attribution License (ODC-BY 1.0).
Semantic Scholar’s data is described in: Kinney, R., et al. (2023). The Semantic Scholar Open Data Platform. arXiv:2301.10140.
