

The DOI matches its Crossref record; 83 of the 83 references it cites were found in a registry or an index.
Estimating genetic kin relationships in prehistoric populations
Open accessPublished version of a preprint
Abstract
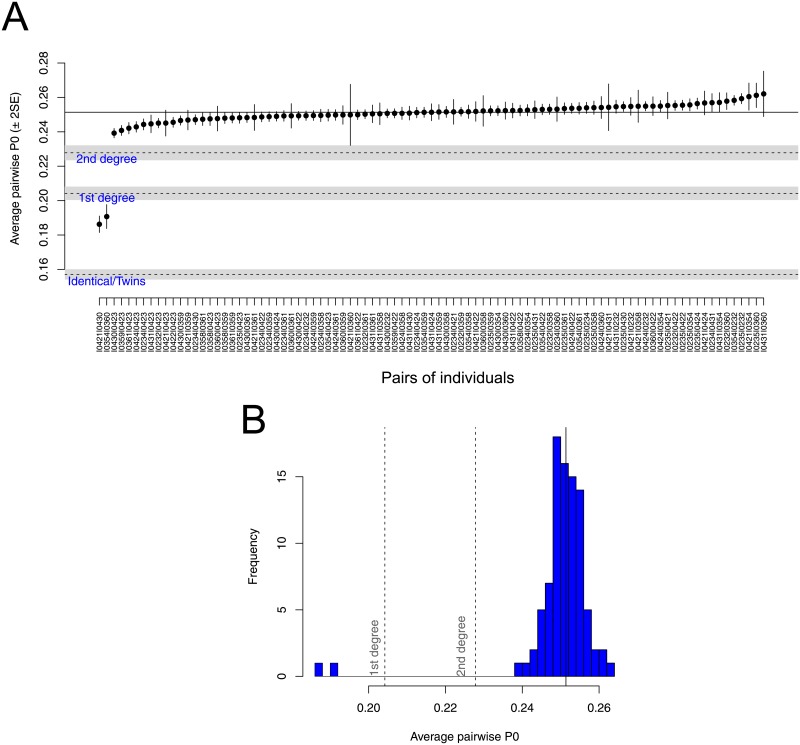
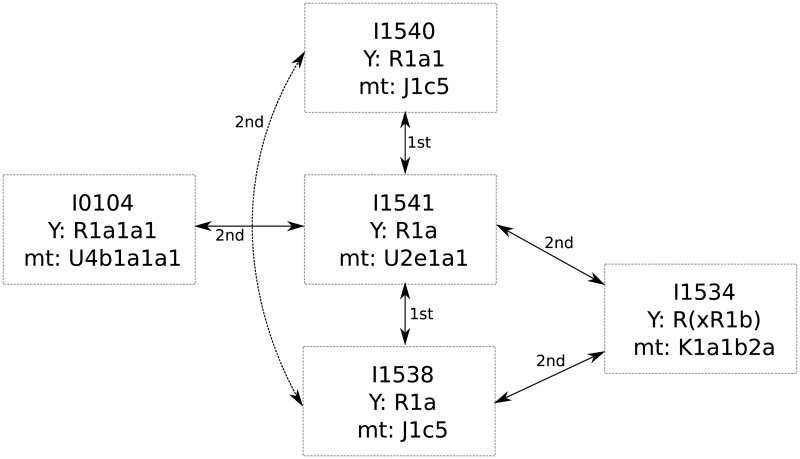
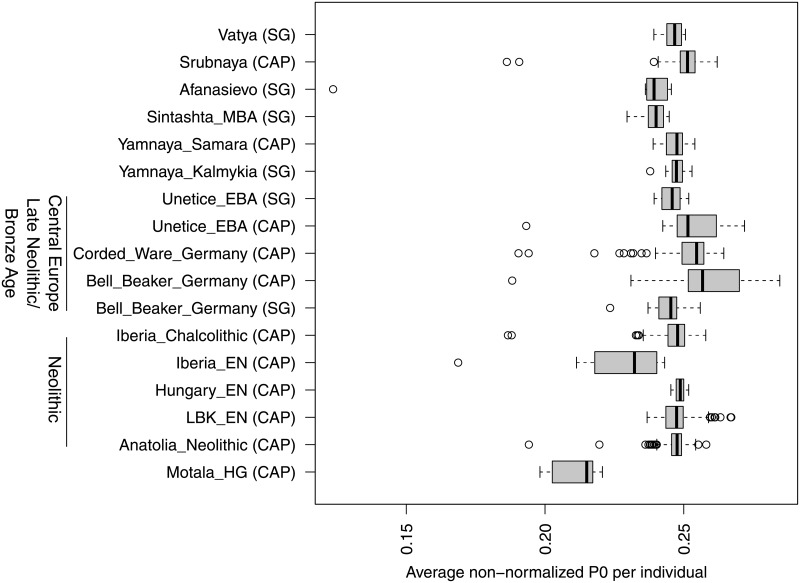
Archaeogenomic research has proven to be a valuable tool to trace migrations of historic and prehistoric individuals and groups, whereas relationships within a group or burial site have not been investigated to a large extent. Knowing the genetic kinship of historic and prehistoric individuals would give important insights into social structures of ancient and historic cultures. Most archaeogenetic research concerning kinship has been restricted to uniparental markers, while studies using genome-wide information were mainly focused on comparisons between populations. Applications which infer the degree of relationship based on modern-day DNA information typically require diploid genotype data. Low concentration of endogenous DNA, fragmentation and other post-mortem damage to ancient DNA (aDNA) makes the application of such tools unfeasible for most archaeological samples. To infer family relationships for degraded samples, we developed the software READ (Relationship Estimation from Ancient DNA). We show that our heuristic approach can successfully infer up to second degree relationships with as little as 0.1x shotgun coverage per genome for pairs of individuals. We uncover previously unknown relationships among prehistoric individuals by applying READ to published aDNA data from several human remains excavated from different cultural contexts. In particular, we find a group of five closely related males from the same Corded Ware culture site in modern-day Germany, suggesting patrilocality, which highlights the possibility to uncover social structures of ancient populations by applying READ to genome-wide aDNA data. READ is publicly available from https://bitbucket.org/tguenther/read.
Overview
The claims and statistics of this paper haven’t been checked yet.
Run the check — free, no account needed. It reads the open-access text and checks the sources it cites.
Integrity signals
Registry
Cites
Statistics
Figures
Verification
Claims the paper makes
The claims and statistics of this paper haven’t been checked yet.
Run the check — free, no account needed. It reads the open-access text and checks the sources it cites.
Claims other papers make about this one
Each is checked against this paper’s own text: does it say what the citing paper says it does?
The cited source says what the claim attributes to it.
In the citing paper
“We excluded two individuals from further analysis, as the genetic patterns observed using the method described in Kuhn et al.73. Showed that they were first-degree relatives of higher coverage samples in the dataset.”
From Ancient DNA from Chalcolithic Israel reveals the role of population mixture in cultural transformation (2018) · cites this paper as [73]
The cited source says what the claim attributes to it.
In the citing paper
“Using READ42 and NGSrelate243, we did not find any first- or second-degree relatives among the Ancient Rapanui (Supplementary Figs. 23 and 24 and Supplementary Information section 9) and detected a single pair of third- to fourth-degree relatives on the basis of IBD sharing (highest estimated IBD sharing >15 cM between any two individuals is <1,000 cM; Supplementary Information section 8 and”
From Ancient Rapanui genomes reveal resilience and pre-European contact with the Americas (2024) · cites this paper as [42]
The cited source says what the claim attributes to it.
In the citing paper
“Methods detecting genetic kinship generally make use of population panels in which expectations of identity-by-descent [G] (or allelic mismatch rates) can be derived in unrelated individuals [201][202][203] .”
From Ancient DNA analysis (2021) · cites this paper as [203]
Self-check
Percentages, sums and reported differences re-computed from the paper’s own numbers.
The self-check needs the paper’s full text.
Citations
Cites
R: A Language and Environment for Statistical Computing
R Core Team (2000) · doi:10.32614/r.manuals · Cited by 355,893
The Sequence Alignment/Map format and SAMtools
Li, H., Handsaker, B., Wysoker, A., Fennell, T., Ruan, J., Homer, N., Marth, G., Abecasis, G., Durbin, R., & 1000 Genome Project Data Processing Subgroup (2009) · Bioinformatics · doi:10.1093/bioinformatics/btp352 · Cited by 62,041
PLINK: a tool set for whole-genome association and population-based linkage analyses.
Purcell, S., Neale, B., Todd-Brown, K., Thomas, L., Ferreira, M. A. R., Bender, D., Maller, J., Sklar, P., de Bakker, P. I. W., Daly, M. J., et al. (2007) · The American Journal of Human Genetics · doi:10.1086/519795 · Cited by 34,089
A global reference for human genetic variation
The 1000 Genomes Project Consortium, authors, C., Auton, A., Abecasis, G. R., Steering committee, Altshuler, D. M., Durbin, R. M., Abecasis, G. R., Bentley, D. R., Chakravarti, A., et al. (2015) · Nature · doi:10.1038/nature15393 · Cited by 18,247
The variant call format and VCFtools
Danecek, P., Auton, A., Abecasis, G. R., Albers, C. A., Banks, E., DePristo, M. A., Handsaker, R. E., Lunter, G. A., Marth, G., Sherry, S. T., et al. (2011) · Bioinformatics · doi:10.1093/bioinformatics/btr330 · Cited by 16,450
Robust relationship inference in genome-wide association studies
Manichaikul, A., Mychaleckyj, J. C., Rich, S. S., Daly, K., Sale, M., & Chen, W.-M. (2010) · Bioinformatics · doi:10.1093/bioinformatics/btq559 · Cited by 3,541
The complete genome sequence of a Neanderthal from the Altai Mountains
Prüfer, K., Racimo, F., Patterson, N., Jay, F., Sankararaman, S., Sawyer, S., Heinze, A., Renaud, G., Sudmant, P. H., de Filippo, C., et al. (2014) · Nature · doi:10.1038/nature12886 · Cited by 2,254
Massive migration from the steppe was a source for Indo-European languages in Europe
Haak, W., Lazaridis, I., Patterson, N., Rohland, N., Mallick, S., Llamas, B., Brandt, G., Nordenfelt, S., Harney, E., Stewardson, K., et al. (2015) · Nature · doi:10.1038/nature14317 · Cited by 1,940
Prescribing Personalized Nutrition for Cardiovascular Health: Are We Ready?
Juma, S., Imrhan, V., Vijayagopal, P., & Prasad, C. (2014) · Lifestyle Genomics · doi:10.1159/000370213 · Cited by 1,908
The complete genome of an individual by massively parallel DNA sequencing
Wheeler, D. A., Srinivasan, M., Egholm, M., Shen, Y., Chen, L., McGuire, A., He, W., Chen, Y.-J., Makhijani, V., Roth, G. T., et al. (2008) · Nature · doi:10.1038/nature06884 · Cited by 1,838
Research works printed but not linked: 1
- Van Rossum G, et al. Python Programming Language. In: USENIX Annual Technical Conference. vol. 41; 2007.
Cited by
Sorted by citations
The genomic history of the Iberian Peninsula over the past 8000 years
Olalde, I., Mallick, S., Patterson, N., Rohland, N., Villalba-Mouco, V., Silva, M., Dulias, K., Edwards, C. J., Gandini, F., Pala, M., et al. (2019) · Science · doi:10.1126/science.aav4040 · Cited by 552
Southern African ancient genomes estimate modern human divergence to 350,000 to 260,000 years ago
Schlebusch, C. M., Malmström, H., Günther, T., Sjödin, P., Coutinho, A., Edlund, H., Munters, A. R., Vicente, M., Steyn, M., Soodyall, H., et al. (2017) · Science · doi:10.1126/science.aao6266 · Cited by 519
Self-citationGenomic insights into the formation of human populations in East Asia
Wang, C., Yeh, H., Popov, А. N., Zhang, H., Matsumura, H., Sirak, K. A., Cheronet, O., Kovalev, A., Rohland, N., Kim, A. M., et al. (2021) · Nature · doi:10.1038/s41586-021-03336-2 · Cited by 437
Orlando, L., Allaby, R., Skoglund, P., Der Sarkissian, C., Stockhammer, P. W., Ávila-Arcos, M. C., Fu, Q., Krause, J., Willerslev, E., Stone, A. C., et al. (2021) · Nature Reviews Methods Primers · doi:10.1038/s43586-020-00011-0 · Cited by 411
Ancient genomes show social and reproductive behavior of early Upper Paleolithic foragers
Sikora, M., Seguin-Orlando, A., Sousa, V. C., Albrechtsen, A., Korneliussen, T., Ko, A., Rasmussen, S., Dupanloup, I., Nigst, P. R., Bosch, M. D., et al. (2017) · Science · doi:10.1126/science.aao1807 · Cited by 312
Metadata
- Authors
- Monroy Kuhn, J. M., Jakobsson, M., & Günther, T.
- Affiliations
- Uppsala University (SE)
- Corresponding author
- Jakobsson, Mattias
- Günther, Torsten
- Venue
- PLOS ONE
- Publisher
- Public Library of Science (PLoS)
- Published
- 2018-04-23
- Volume
- 13
- Issue
- 4
- Pages
- e0195491
- ISSN
- 1932-6203 (ISSN-L)
- PMC
- PMC5912749
- OpenAlex
- W2950454348
- Cited by
- 330
- References
- 79
- Citations by year
- 2026: 31 · 2025: 47 · 2024: 53 · 2023: 62 · 2022: 40 · 2021: 42 · 2020: 23 · 2019: 19 · 2018: 11
- FWCI
- 14.33
- Type
- journal article
- Language
- en
- Open access
- gold
- doi.org
- Licence
- Locations
- PLoS ONE (publishedVersion, cc-by)
- bioRxiv (Cold Spring Harbor Laboratory) (acceptedVersion, cc-by-nc)
- Europe PMC (PubMed Central) (publishedVersion, cc-by)
- PubMed Central (publishedVersion, cc-by)
- PubMed (publishedVersion)
- Uppsala University Publications (Uppsala University) (submittedVersion, other-oa)
- DOAJ (DOAJ: Directory of Open Access Journals) (submittedVersion)
- Figshare (submittedVersion, cc-by)
- FreiDok plus (Universitätsbibliothek Freiburg) (submittedVersion)
- Funders
- Erasmus Mundus Master Programme in Evolutionary Biology
- Consejo Nacional de Ciencia y Tecnología
- European Research Council (311413)
- Vetenskapsrådet
- Wenner-Gren-Foundations
- Riksbankens Jubileumsfond
- Knut och Alice Wallenbergs Stiftelse
- Topics
- Life Sciences › Biochemistry, Genetics and Molecular Biology › Genetics › Forensic and Genetic Research
- Life Sciences › Biochemistry, Genetics and Molecular Biology › Genetics › Genetic diversity and population structure
- Social Sciences › Arts and Humanities › Archeology (arts and humanities) › Forensic Anthropology and Bioarchaeology Studies
- Keywords
- genetic relatedness, ancient DNA, prehistoric humans, Corded Ware culture, patrilocality, social structure, degraded DNA, shotgun sequencing, human remains
- MeSH terms
- DNA, Ancient, Computer Simulation, DNA, Mitochondrial, Family, Germany, Haplotypes, Humans, Male, Models, Genetic, Software, Sequence Analysis, DNA, Polymorphism, Single Nucleotide, Chromosomes, Human, Y, DNA Fragmentation
About these checks
Registry, retraction, Cites and statistics results are computed, not judged, with one exception: a printed reference that no index lists is read once by a model before it counts as a citation error. Claims are extracted by a model and kept only when their quote appears verbatim in the text; each cited source is then checked, with a model’s help, for whether it says what the claim relies on. Those verdicts can be wrong — read the claim’s quote and the cited source before relying on one.
Statistics and arithmetic are recomputed, not judged.
Confidence bands are shown only for fields calibrated on our annotated test set. None is calibrated yet, so no band is shown.
What counts as a claim ›How we measure confidence ›How we check this ›
Are you an author, or do you see a problem with this page? Request a review
