

The DOI matches its Crossref record; 38 of the 38 references it cites were found in a registry or an index.
Estimating the impact of drug use on US mortality, 1999-2016
Open accessAbstract
The impact of rising drug use on US mortality may extend beyond deaths coded as drug-related to include excess mortality from other causes affected by drug use. Here, we estimate the full extent of drug-associated mortality. We use annual death rates for 1999-2016 by state, sex, five-year age group, and cause of death to model the relationship between drug-coded mortality-which serves as an indicator of the population-level prevalence of drug use-and mortality from other causes. Among residents aged 15-64 living in the 50 US states, the estimated number of drug-associated deaths in 2016 (141,695) was 2.2 times the number of drug-coded deaths (63,000). Adverse trends since 2010 in midlife mortality are largely attributable to drug-associated mortality. In the absence of drug use, we estimate that the probability of dying between ages 15 and 65 would have continued to decline after 2010 among men (to 15% in 2016) and would have remained at a low level (10%) among women. Our results suggest that an additional 3.9% of men and 1.8% of women died between ages 15 and 65 in 2016 because of drug use. In terms of life expectancy beyond age 15, we estimate that drug use cost men 1.4 years and women 0.7 years, on average. In the hardest-hit state (West Virginia), drug use cost men 3.6 and women 1.9 life years. Recent declines in US life expectancy have been blamed largely on the drug epidemic. Consistent with that inference, our results imply that, in the absence of drug use, life expectancy at age 15 would have increased slightly between 2014 and 2016. Drug-associated mortality in the US is roughly double that implied by drug-coded deaths alone. The drug epidemic is exacting a heavy cost to American lives, not only from overdoses but from a variety of causes.
Overview
The claims and statistics of this paper haven’t been checked yet.
Run the check — free, no account needed. It reads the open-access text and checks the sources it cites.
Integrity signals
Registry
Cites
Statistics
Figures
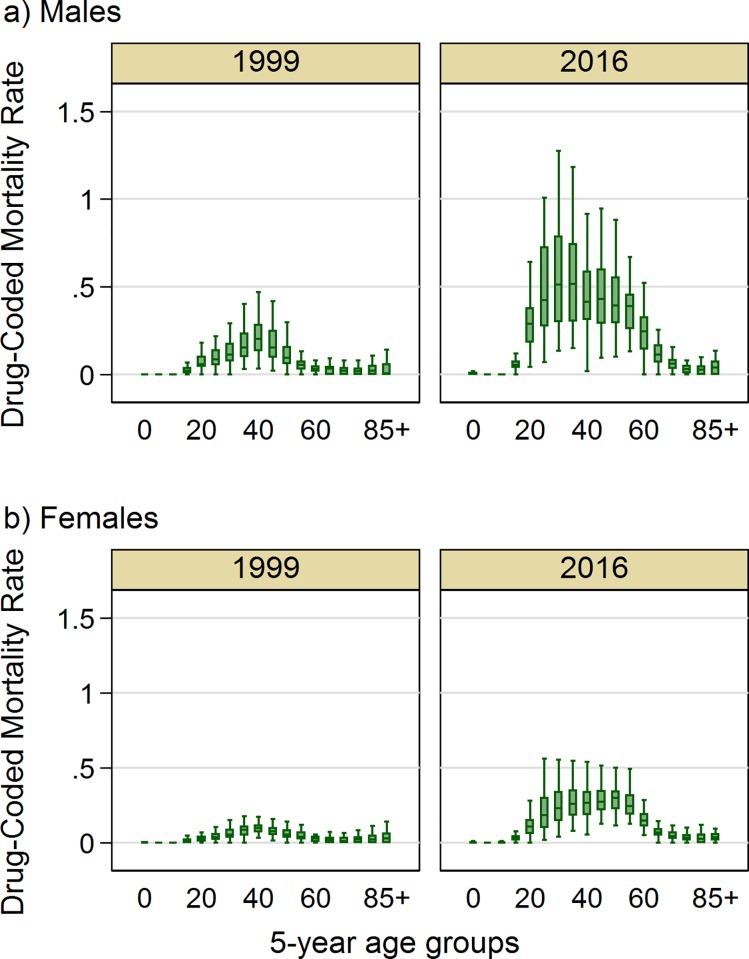
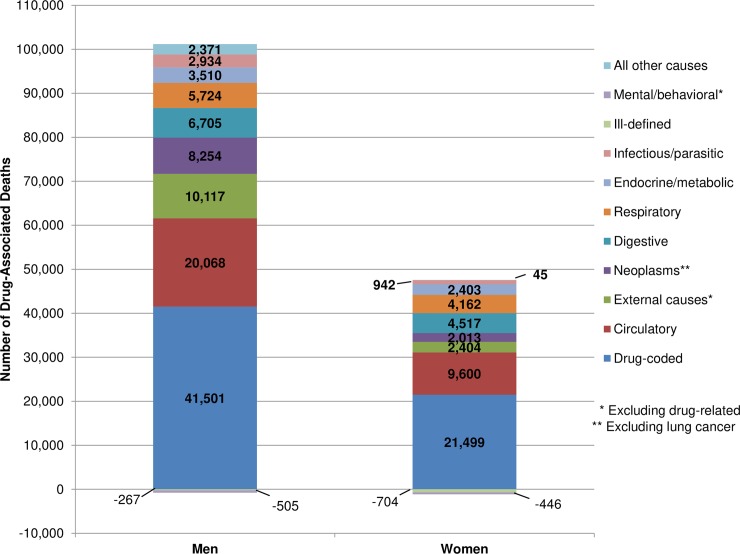
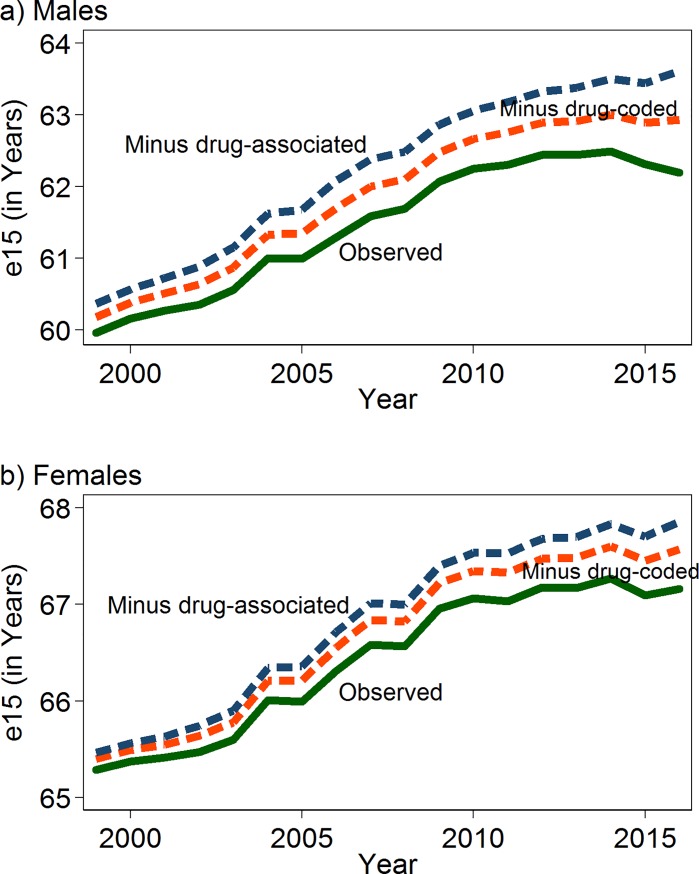
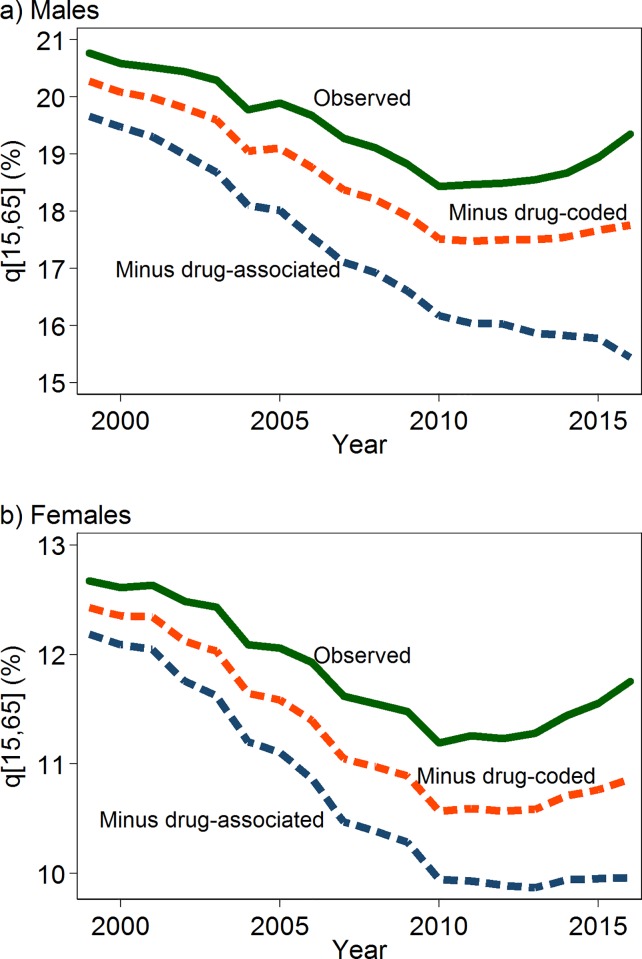
Verification
Claims the paper makes
The claims and statistics of this paper haven’t been checked yet.
Run the check — free, no account needed. It reads the open-access text and checks the sources it cites.
Self-check
Percentages, sums and reported differences re-computed from the paper’s own numbers.
The self-check needs the paper’s full text.
Citations
Cites
Hasin, D. S., Stinson, F. S., Ogburn, E., & Grant, B. F. (2007) · Archives of General Psychiatry · doi:10.1001/archpsyc.64.7.830 · Cited by 2,908
Grant, B. F., Stinson, F. S., Dawson, D. A., Chou, S. P., Dufour, M. C., Compton, W., Pickering, R. P., & Kaplan, K. (2004) · Archives of General Psychiatry · doi:10.1001/archpsyc.61.8.807 · Cited by 2,889
Rising morbidity and mortality in midlife among white non-Hispanic Americans in the 21st century
Case, A., & Deaton, A. (2015) · Proceedings of the National Academy of Sciences · doi:10.1073/pnas.1518393112 · Cited by 2,759
Demography, Measuring and Modeling Population Processes
Véron, J., Preston, S. H., Heuveline, P., & Guillot, M. (2002) · Population · doi:10.2307/1535065 · Cited by 1,709
Self-citationMortality and Morbidity in the 21st Century
Case, A., & Deaton, A. (2017) · Brookings Papers on Economic Activity · doi:10.1353/eca.2017.0005 · Cited by 1,448
Compton, W. M., Thomas, Y. F., Stinson, F. S., & Grant, B. F. (2007) · Archives of General Psychiatry · doi:10.1001/archpsyc.64.5.566 · Cited by 1,152
Degenhardt, L., Bucello, C., Mathers, B., Briegleb, C., Ali, H., Hickman, M., & McLaren, J. (2011) · Addiction · doi:10.1111/j.1360-0443.2010.03140.x · Cited by 856
Changing dynamics of the drug overdose epidemic in the United States from 1979 through 2016
Jalal, H. J., Buchanich, J. M., Roberts, M. S., Balmert, L. C., Zhang, K., & Burke, D. S. (2018) · Science · doi:10.1126/science.aau1184 · Cited by 680
Mortality in the United States
Murphy, S. L., Xu, J., Kochanek, K. D., & Arias, E. (1840) · New England Journal of Medicine · doi:10.1056/nejm184002260220306 · Cited by 648
Mortality among people who inject drugs: a systematic review and meta-analysis
Mathers, B. M., Degenhardt, L., Bucello, C., Lemon, J., Wiessing, L., & Hickman, M. (2013) · Bulletin of the World Health Organization · doi:10.2471/blt.12.108282 · Cited by 476
Research works printed but not linked: 5
- U.S. Department of Health and Human Services (HHS), Office of the Surgeon General, 2016, Facing addiction in American: the Surgeon General's report on alcohol, drugs, and health
- SH Preston, 2010, International differences in mortality at older ages: dimensions and sources. Panel on Understanding Divergent Trends in Longevity in High-Income Countries. Committee on Population, Division of Behavioral and Social Sciences and Education, 105
- StataCorp, 2015, Stata: Release 14. Statistical Software
- AJ Cherlin, 2016, Why are white death rates rising?
- L Bernstein, 2018, U.S. life expectancy declines again, a dismal trend not seen since World War I, Washington Post 2018 November 29
Cited by
Sorted by citations
Handbook of Religion and Health
Koenig, H. G., VanderWeele, T. J., & Peteet, J. R. (2023) · doi:10.1093/oso/9780190088859.001.0001 · Cited by 1,160
US life expectancy stalls due to cardiovascular disease, not drug deaths
Mehta, N. K., Abrams, L. R., & Myrskylä, M. (2020) · Proceedings of the National Academy of Sciences · doi:10.1073/pnas.1920391117 · Cited by 240
Association of Depression and Anxiety With the Accumulation of Chronic Conditions
Bobo, W. V., Grossardt, B. R., Virani, S., Sauver, J. L. S., Boyd, C. M., & Rocca, W. A. (2022) · JAMA Network Open · doi:10.1001/jamanetworkopen.2022.9817 · Cited by 186
Shah, N. S., Molsberry, R. J., Rana, J. S., Sidney, S., Capewell, S., O’Flaherty, M., Carnethon, M. R., Lloyd‐Jones, D. M., & Khan, S. S. (2020) · BMJ · doi:10.1136/bmj.m2688 · Cited by 115
Social Inequality and the Future of US Life Expectancy
Gutin, I., & Hummer, R. A. (2021) · Annual Review of Sociology · doi:10.1146/annurev-soc-072320-100249 · Cited by 68
Rising Geographic Disparities in US Mortality
Couillard, B. K., Foote, C. L., Gandhi, K., Meara, E. R., & Skinner, J. (2021) · The Journal of Economic Perspectives · doi:10.1257/jep.35.4.123 · Cited by 65
Consideration of sex and gender differences in addiction medication response
McKee, S. A., & McRae‐Clark, A. L. (2022) · Biology of Sex Differences · doi:10.1186/s13293-022-00441-3 · Cited by 67
Parisi, A. B., Roberts, R. L., Hanley, A. W., & Garland, E. L. (2022) · Mindfulness · doi:10.1007/s12671-022-01964-x · Cited by 68
Rethinking headache as a global public health case model for reaching the SDG 3 HEALTH by 2030
Martelletti, P., Leonardi, M., Ashina, M., Burstein, R., Cho, S., Charway‐Felli, A., Dodick, D. W., Gil‐Gouveia, R., Grazzi, L., Lampl, C., et al. (2023) · The Journal of Headache and Pain · doi:10.1186/s10194-023-01666-2 · Cited by 63
New Drugs, Old Targets: Tweaking the Dopamine System to Treat Psychostimulant Use Disorders
Newman, A. H., Ku, T. C., Jordan, C. J., Bonifazi, A., & Xi, Z. (2021) · The Annual Review of Pharmacology and Toxicology · doi:10.1146/annurev-pharmtox-030220-124205 · Cited by 62
Trends in U.S. Working-Age non-Hispanic White Mortality: Rural–Urban and Within-Rural Differences
Monnat, S. M. (2020) · Population Research and Policy Review · doi:10.1007/s11113-020-09607-6 · Cited by 57
Maillard, O., Bun, R. S., Laanani, M., Verga-Gérard, A., Leroy, T., Gault, N., Estellat, C., Noïze, P., Kaguelidou, F., Sommet, A., et al. (2024) · Therapies · doi:10.1016/j.therap.2024.05.003 · Cited by 49
Anderson, J., Martin, S. A., Gadomski, A., Krupa, N. L., Mullin, D. J., Cahill, A., & Jenkins, P. (2021) · Substance Abuse · doi:10.1080/08897077.2021.1931633 · Cited by 47
Tackling population health challenges as we build back from the pandemic
McCartney, G., Douglas, M., Taulbut, M., Katikireddi, S. V., & McKee, M. (2021) · BMJ · doi:10.1136/bmj-2021-066232 · Cited by 38
Olfson, M., Cosgrove, C. M., Altekruse, S. F., Wall, M. M., & Blanco, C. (2021) · Health Affairs · doi:10.1377/hlthaff.2020.01573 · Cited by 37
Shmulewitz, D., Stohl, M., Greenstein, E., Roncone, S., Walsh, C. A., Aharonovich, E., Wall, M. M., & Hasin, D. S. (2021) · Psychological Medicine · doi:10.1017/s0033291721003652 · Cited by 31
Acosta, E., Mehta, N., Myrskylä, M., & Ebeling, M. (2022) · The Journals of Gerontology: Series B · doi:10.1093/geronb/gbac032 · Cited by 29
Cycles of Gender Convergence and Divergence in Drug Overdose Mortality
Ho, J. Y. (2020) · Population and Development Review · doi:10.1111/padr.12336 · Cited by 31
Griffin, K. W., Williams, C., Botvin, C. M., Sousa, S. M., & Botvin, G. J. (2022) · Frontiers in Digital Health · doi:10.3389/fdgth.2022.931276 · Cited by 27
The Medication Experience: A Concept Analysis
Hillman, L. A., Peden‐McAlpine, C., de Oliveira, D. R., & Schommer, J. C. (2020) · Pharmacy · doi:10.3390/pharmacy9010007 · Cited by 28
Convergence and divergence in mortality: A global study from 1990 to 2030
Atance, D., Bielsa, M. M. C., Varea, X., & Aburto, J. M. (2024) · PLoS ONE · doi:10.1371/journal.pone.0295842 · Cited by 23
The economic underpinnings of the drug epidemic
Seltzer, N. (2020) · SSM - Population Health · doi:10.1016/j.ssmph.2020.100679 · Cited by 24
Bushman, D., Davidson, A., Pathela, P., Greene, S. K., Weiss, D., Reddy, V., New York City Fatal Case-Control St Team, & Latash, J. (2021) · Journal of Racial and Ethnic Health Disparities · doi:10.1007/s40615-021-01098-1 · Cited by 21
Jia, D., Zhang, K., & Xu, Y. (2023) · Journal of Drug Issues · doi:10.1177/00220426231152912 · Cited by 20
An Overview of Wearable Biosensor Systems for Real-Time Substance Use Detection
Rumbut, J., Fang, H., Carreiro, S., Smelson, D. A., & Boyer, E. W. (2022) · IEEE Internet of Things Journal · doi:10.1109/jiot.2022.3207090 · Cited by 18
Recent mortality in Britain: a review of trends and explanations
Murphy, M. (2021) · Age and Ageing · doi:10.1093/ageing/afab016 · Cited by 16
Zheng, H., & Choi, Y. (2024) · Proceedings of the National Academy of Sciences · doi:10.1073/pnas.2307656121 · Cited by 16
HIV Infection and Depression Among Opiate Users in a US Epicenter of the Opioid Epidemic
Denis, C., Dominique, T., Smith, P., Fiore, D., Ku, Y.-C. J., Culhane, A., Dunbar, D., Brown, D., Daramay, M. G., Voytek, C. D., et al. (2021) · AIDS and Behavior · doi:10.1007/s10461-020-03151-2 · Cited by 16
Illicit Drug Use among Commercial ‘Boda Boda’ Motorcyclists in Uganda
Kwagala, B., Ndugga, P., Nankinga, O., Twaibu, W., Zarugaba, I. T., Richard, S., Misinde, C., Nansubuga, E., Katende, D., & Mbonye, M. K. (2022) · Substance Use & Misuse · doi:10.1080/10826084.2022.2096234 · Cited by 12
Trends in cause-specific mortality: deaths of despair in Spain, 1980–2019
Piñeiro, B., Spijker, J., Trias‐Llimós, S., Blanes, A., & Permanyer, I. (2023) · Journal of Public Health · doi:10.1093/pubmed/fdad133 · Cited by 12
Fischer, B., O’Keefe-Markman, C., Daldegan‐Bueno, D., & Walters, C. (2021) · International Journal of Drug Policy · doi:10.1016/j.drugpo.2021.103166 · Cited by 13
Koenig, H. G., VanderWeele, T. J., & Peteet, J. R. (2023) · Oxford University Press eBooks · doi:10.1093/oso/9780190088859.003.0001 · Cited by 12
Khalfaoui, A., Benalia, A., Laggoun, Z., Bouchareb, R., Zaamta, I., Melloul, R., Menasria, A., Merouani, S., Pizzi, A., & Derbal, K. (2024) · Desalination and Water Treatment · doi:10.1016/j.dwt.2024.100197 · Cited by 11
Huỳnh, C., Kisely, S. R., Rochette, L., Pelletier, É., Morrison, K. B., Li, S., Hopkin, G., Smith, M. J., Burchill, C. A., Lin, E. H. B., et al. (2021) · The Canadian Journal of Psychiatry · doi:10.1177/07067437211043446 · Cited by 11
Previously healthy adults among septic patients: Population-level epidemiology and outcomes
Oud, L., & Garza, J. (2023) · Journal of Critical Care · doi:10.1016/j.jcrc.2023.154427 · Cited by 10
Kerr, W. C., Ye, Y., Williams, E., Mulia, N., & CHERPITEL, C. J. S. (2020) · Injury Prevention · doi:10.1136/injuryprev-2020-043951 · Cited by 10
Bushman, D., Davidson, A., Pathela, P., Greene, S. K., Weiss, D., Reddy, V., New York City Fatal Case-Control Study Team, & Latash, J. (2021) · Journal of Racial and Ethnic Health Disparities · doi:10.1007/s40615-021-01139-9 · Cited by 9
Okobi, O. E., Akueme, N. T., Ugwu, A. O., Ebong, I. L., Osagwu, N., Opiegbe, L., Folorunsho, I. L., Mbah, L. A., Ude, G. I., Khan, A., et al. (2023) · Cureus · doi:10.7759/cureus.49647 · Cited by 8
Role of Cardiovascular Deaths on Changes in the Longevity Gap Between U.S. and Other Countries
Bramajo Hemsi, O., & Mehta, N. (2025) · American Journal of Preventive Medicine · doi:10.1016/j.amepre.2025.02.002 · Cited by 7
Bonilla-Quintana, M., & Rangamani, P. (2022) · Physical Biology · doi:10.1088/1478-3975/ac6cbe · Cited by 7
Art therapy’s engagement of brain networks for enduring recovery from addiction
Quinn, P. (2025) · Frontiers in Psychiatry · doi:10.3389/fpsyt.2024.1458063 · Cited by 7
The Role of Despair in Predicting Self-Destructive Behaviors
Gaydosh, L. M., Kelly, A. L., Gutin, I., Shanahan, L., Godwin, J. W., Harris, K. M., & Copeland, W. (2025) · Population Research and Policy Review · doi:10.1007/s11113-025-09952-4 · Cited by 6
Dent, K. R., Brennan, G. M., Khalifeh, L., & Richmond‐Rakerd, L. S. (2024) · Psychological Medicine · doi:10.1017/s0033291724000916 · Cited by 7
Bhatta, D. N., & Bommer, W. (2024) · Mayo Clinic Proceedings · doi:10.1016/j.mayocp.2024.02.018 · Cited by 5
Cost-effectiveness of drug consumption rooms in France: a modelling study
Cousien, A., Donadille, C., Madrid, L. B., Maradan, G., Jauffret‐Roustide, M., Lalanne, L., Auriacombe, M., Roux, P., & Boyer, S. (2024) · BMC Public Health · doi:10.1186/s12889-024-18909-9 · Cited by 5
Abrams, L., Brower, N., Myrskylä, M., & Mehta, N. K. (2024) · American Journal of Epidemiology · doi:10.1093/aje/kwae414 · Cited by 5
Park, B., Hammond, A. S., Dunn, K. E., Strain, E. C., & Bergeria, C. L. (2023) · Journal of Drug Issues · doi:10.1177/00220426231216086 · Cited by 5
Shearer, R. D., Winkelman, T. N. A., & Khatri, U. G. (2022) · Drug and Alcohol Dependence · doi:10.1016/j.drugalcdep.2022.109651 · Cited by 5
CAMPBELL, B. K., Le, T. L., Pagano, A., McCuistian, C. L., Woodward-Lopez, G. M., Bonniot, C., & Guydish, J. R. (2023) · Drug and Alcohol Dependence Reports · doi:10.1016/j.dadr.2023.100165 · Cited by 5
Tanaka, C., Tagami, T., Nagano, M., Nakayama, F., Kaneko, J., & Kuno, M. (2024) · Acute Medicine & Surgery · doi:10.1002/ams2.942 · Cited by 5
Quilty, L. C., Wardell, J. D., Garner, G., Elison, S., Davies, G., Klekovkina, E., Corman, M. K., Alfonsi, J., Crawford, A. S., de Oliveira, C., et al. (2022) · BMJ Open · doi:10.1136/bmjopen-2022-064360 · Cited by 4
Dezman, Z. D. W., Gorelick, D. A., Buchanan, L. S., & Soderstrom, C. A. (2020) · Injury · doi:10.1016/j.injury.2020.10.048 · Cited by 4
Koenig, H. G., VanderWeele, T. J., & Peteet, J. R. (2023) · Oxford University Press eBooks · doi:10.1093/oso/9780190088859.003.0002 · Cited by 5
A simplified model for measuring longevity risk for life insurance products
Atance, D., & Eliseo Navarro, C. (2024) · Financial Innovation · doi:10.1186/s40854-023-00515-0 · Cited by 5
The Downward Spiral: A Macroeconomic Analysis of the Opioid Crisis
Greenwood, J., Nezih Guner, X., & Kopecky, K. (2024) · Working paper · doi:10.26509/frbc-wp-202418 · Cited by 4
Insights into US life expectancy stagnation from birth cohort mortality dynamics
Abrams, L., Bramajo, O., van Raalte, A., Myrskylä, M., & Mehta, N. K. (2026) · Proceedings of the National Academy of Sciences · doi:10.1073/pnas.2519356123 · Cited by 6
“Conditions and their treatment can interact with each other; for example, cancer treatments and drug abuse affect cardiovascular health (19–22).”
Understanding the Religion, Mental, and Social Health Relationship
Koenig, H. G., VanderWeele, T. J., & Peteet, J. R. (2023) · Oxford University Press eBooks · doi:10.1093/oso/9780190088859.003.0016 · Cited by 7
Characterization of EEG-P300 Signals in Drug Users
Dayanti, N., Kusumandari, D. E., Kusumaningrum, H. B. D., & Alexandra, T. C. (2023) · Journal of Physics Conference Series · doi:10.1088/1742-6596/2673/1/012009 · Cited by 3
Cause-Specific Excess Mortality in the US During the COVID-19 PandemicPreprint
Degtiareva, E., Tilstra, A. M., Schöley, J., Kashyap, R., & Dowd, J. B. (2024) · medRxiv · doi:10.1101/2024.03.05.24303783 · Cited by 3
Spatially Continuous Maps of Disease Risk: An Analysis of Mortality Disparities in the United States
Ruiz‐Suarez, S., & Brown, P. (2025) · AJPM Focus · doi:10.1016/j.focus.2025.100334 · Cited by 2
Psychological Well-Being and Positive Emotions
Koenig, H. G., VanderWeele, T. J., & Peteet, J. R. (2023) · Oxford University Press eBooks · doi:10.1093/oso/9780190088859.003.0012 · Cited by 2
Occupational Status and Health in Early Midlife
Fishman, S. H. (2024) · Population Research and Policy Review · doi:10.1007/s11113-024-09933-z · Cited by 2
Huế, T. T. T., Ngo, H. K. T., Wang, Z., Anh, N. T. K., Binh, V. N., Trung, N. Q., Chinh, P. Q., Luong, H. T., Zheng, Q., Hall, W., et al. (2025) · Addiction · doi:10.1111/add.70147 · Cited by 2
Neuroscience Outside the Box: From the Laboratory to Discussing Drug Abuse at Schools
do Vale, T. C. M., Chagas, L. D. S., Pereira, H. D. S., Giestal‐de‐Araujo, E., Arévalo, A. L., & Oliveira-Silva, P. (2022) · Frontiers in Human Neuroscience · doi:10.3389/fnhum.2022.782205 · Cited by 2
Ruhm, C. J. (2020) · Addiction · doi:10.1111/add.14988 · Cited by 2
Harris, R. A., & Mandell, D. S. (2023) · American Journal on Addictions · doi:10.1111/ajad.13459 · Cited by 1
Koenig, H. G., VanderWeele, T. J., & Peteet, J. R. (2023) · Oxford University Press eBooks · doi:10.1093/oso/9780190088859.003.0025 · Cited by 1
Substance Use and Substance Use Disorders
Koenig, H. G., VanderWeele, T. J., & Peteet, J. R. (2023) · Oxford University Press eBooks · doi:10.1093/oso/9780190088859.003.0010 · Cited by 2
Koenig, H. G., VanderWeele, T. J., & Peteet, J. R. (2023) · Oxford University Press eBooks · doi:10.1093/oso/9780190088859.003.0014 · Cited by 4
Koenig, H. G., VanderWeele, T. J., & Peteet, J. R. (2023) · Oxford University Press eBooks · doi:10.1093/oso/9780190088859.003.0015 · Cited by 1
The dynamic of mortality explained with a reduced number of key ages
Atance, D., Haberman, S., & Millossovich, P. (2025) · Scandinavian Actuarial Journal · doi:10.1080/03461238.2025.2596036 · Cited by 1
Koenig, H. G., VanderWeele, T. J., & Peteet, J. R. (2023) · Oxford University Press eBooks · doi:10.1093/oso/9780190088859.003.0027 · Cited by 1
Koenig, H. G., VanderWeele, T. J., & Peteet, J. R. (2023) · Oxford University Press eBooks · doi:10.1093/oso/9780190088859.003.0008 · Cited by 2
Public Health and Human Flourishing
Koenig, H. G., VanderWeele, T. J., & Peteet, J. R. (2023) · Oxford University Press eBooks · doi:10.1093/oso/9780190088859.003.0032 · Cited by 1
Understanding the Religion–Physical Health Relationship
Koenig, H. G., VanderWeele, T. J., & Peteet, J. R. (2023) · Oxford University Press eBooks · doi:10.1093/oso/9780190088859.003.0031 · Cited by 1
Koenig, H. G., VanderWeele, T. J., & Peteet, J. R. (2023) · Oxford University Press eBooks · doi:10.1093/oso/9780190088859.003.0017 · Cited by 1
Koenig, H. G., VanderWeele, T. J., & Peteet, J. R. (2023) · Oxford University Press eBooks · doi:10.1093/oso/9780190088859.003.0006 · Cited by 1
The Behavioral and Social Sciences in Medical Education
Benbassat, J. (2023) · Springer eBooks · doi:10.1007/978-3-031-26542-6_6 · Cited by 1
Armbrecht, E. S., Guzauskas, G. F., Hansen, R. N., Pandey, R. K., Fazioli, K., Chapman, R., Pearson, S. D., & Rind, D. M. (2020) · HRB National Drugs Library (Health Research Board) · Cited by 1
Koenig, H. G., VanderWeele, T. J., & Peteet, J. R. (2023) · Oxford University Press eBooks · doi:10.1093/oso/9780190088859.002.0003 · Cited by 1
Rising Geographic Disparities in US Mortality
Couillard, B. K., Foote, C. L., Gandhi, K., Meara, E. R., & Skinner, J. (2021) · Working paper series · doi:10.29412/res.wp.2021.09
Greenwood, J., Nezih Guner, X., & Kopecky, K. (2022) · doi:10.29338/wp2022-04
The Hospitalization Risk Profile of Opioids Users
Manno, V., Maraschini, A., Conti, S., & Minelli, G. (2023) · BENTHAM SCIENCE PUBLISHERS eBooks · doi:10.2174/9789815079241123010008
Tatua, P. G., & Abuga, I. M. (2023) · International Journal of Public Policy and Administration · doi:10.47941/ijppa.1486
Koenig, H. G., VanderWeele, T. J., & Peteet, J. R. (2023) · Oxford University Press eBooks · doi:10.1093/oso/9780190088859.003.0034
Koenig, H. G., VanderWeele, T. J., & Peteet, J. R. (2023) · Oxford University Press eBooks · doi:10.1093/oso/9780190088859.003.0021
Koenig, H. G., VanderWeele, T. J., & Peteet, J. R. (2023) · Oxford University Press eBooks · doi:10.1093/oso/9780190088859.003.0007
Koenig, H. G., VanderWeele, T. J., & Peteet, J. R. (2023) · Oxford University Press eBooks · doi:10.1093/oso/9780190088859.003.0005 · Cited by 1
Koenig, H. G., VanderWeele, T. J., & Peteet, J. R. (2023) · Oxford University Press eBooks · doi:10.1093/oso/9780190088859.003.0029
Levin, J. (2023) · Oxford University Press eBooks · doi:10.1093/oso/9780190088859.002.0007
Koenig, H. G., VanderWeele, T. J., & Peteet, J. R. (2023) · Oxford University Press eBooks · doi:10.1093/oso/9780190088859.003.0033
Koenig, H. G., VanderWeele, T. J., & Peteet, J. R. (2023) · Oxford University Press eBooks · doi:10.1093/oso/9780190088859.002.0009
Alzheimer’s Disease and Other Dementias
Koenig, H. G., VanderWeele, T. J., & Peteet, J. R. (2023) · Oxford University Press eBooks · doi:10.1093/oso/9780190088859.003.0023
Koenig, H. G., VanderWeele, T. J., & Peteet, J. R. (2023) · Oxford University Press eBooks · doi:10.1093/oso/9780190088859.003.0024
Koenig, H. G., VanderWeele, T. J., & Peteet, J. R. (2023) · Oxford University Press eBooks · doi:10.1093/oso/9780190088859.003.0020
Koenig, H. G., VanderWeele, T. J., & Peteet, J. R. (2023) · Oxford University Press eBooks · doi:10.1093/oso/9780190088859.003.0026
Disease Prevention, Detection, and Treatment
Koenig, H. G., VanderWeele, T. J., & Peteet, J. R. (2023) · Oxford University Press eBooks · doi:10.1093/oso/9780190088859.003.0030 · Cited by 1
Koenig, H. G., VanderWeele, T. J., & Peteet, J. R. (2023) · Oxford University Press eBooks · doi:10.1093/oso/9780190088859.003.0019
Koenig, H. G., VanderWeele, T. J., & Peteet, J. R. (2023) · Oxford University Press eBooks · doi:10.1093/oso/9780190088859.002.0004
Personality Traits and Disorders
Koenig, H. G., VanderWeele, T. J., & Peteet, J. R. (2023) · Oxford University Press eBooks · doi:10.1093/oso/9780190088859.003.0011
Metadata
- Authors
- Glei, D. A., & Preston, S. H.
- Affiliations
- Georgetown University (US)
- University of Pennsylvania (US)
- Corresponding author
- Glei, Dana A.
- Venue
- PLOS ONE
- Publisher
- Public Library of Science (PLoS)
- Published
- 2020-01-15
- Volume
- 15
- Issue
- 1
- Pages
- e0226732
- ISSN
- 1932-6203 (ISSN-L)
- PMC
- PMC6961845
- OpenAlex
- W2999505629
- Cited by
- 123
- References
- 38
- Citations by year
- 2026: 7 · 2025: 8 · 2024: 18 · 2023: 54 · 2022: 12 · 2021: 14 · 2020: 10
- FWCI
- 16.85
- Type
- journal article
- Language
- en
- Open access
- gold
- doi.org
- Licence
- Locations
- PLoS ONE (publishedVersion, cc-by)
- Europe PMC (PubMed Central) (publishedVersion, cc-by)
- PubMed Central (publishedVersion, cc-by)
- PubMed (publishedVersion)
- DOAJ (DOAJ: Directory of Open Access Journals) (submittedVersion, cc-by-sa)
- Figshare (submittedVersion, cc-by)
- Funders
- National Institute on Aging (1R01AG060115)
- Georgetown University
- Topics
- Health Sciences › Medicine › Public Health, Environmental and Occupational Health › Opioid Use Disorder Treatment
- Health Sciences › Medicine › Epidemiology › Substance Abuse Treatment and Outcomes
- Health Sciences › Medicine › Epidemiology › HIV, Drug Use, Sexual Risk
- Keywords
- drug use, excess mortality, opioid epidemic, life expectancy, midlife mortality, mortality trends, sex differences in mortality, United States
- MeSH terms
- Adolescent, Adult, Female, Humans, Male, Middle Aged, United States, Models, Statistical, Substance-Related Disorders, Young Adult, Drug Overdose
About these checks
Registry, retraction, Cites and statistics results are computed, not judged, with one exception: a printed reference that no index lists is read once by a model before it counts as a citation error. Claims are extracted by a model and kept only when their quote appears verbatim in the text; each cited source is then checked, with a model’s help, for whether it says what the claim relies on. Those verdicts can be wrong — read the claim’s quote and the cited source before relying on one.
Statistics and arithmetic are recomputed, not judged.
Confidence bands are shown only for fields calibrated on our annotated test set. None is calibrated yet, so no band is shown.
What counts as a claim ›How we measure confidence ›How we check this ›
Are you an author, or do you see a problem with this page? Request a review
