Cited by 120Tuberculosis Research and EpidemiologyMycobacterium research and diagnosisInfectious Diseases and Tuberculosis

The DOI matches its Crossref record; 62 of the 62 references it cites were found in a registry or an index.

Systematic, multiparametric analysis of Mycobacterium tuberculosis intracellular infection offers insight into coordinated virulence

Open access

Abstract

A key to the pathogenic success of Mycobacterium tuberculosis (Mtb), the causative agent of tuberculosis, is the capacity to survive within host macrophages. Although several factors required for this survival have been identified, a comprehensive knowledge of such factors and how they work together to manipulate the host environment to benefit bacterial survival are not well understood. To systematically identify Mtb factors required for intracellular growth, we screened an arrayed, non-redundant Mtb transposon mutant library by high-content imaging to characterize the mutant-macrophage interaction. Based on a combination of imaging features, we identified mutants impaired for intracellular survival. We then characterized the phenotype of infection with each mutant by profiling the induced macrophage cytokine response. Taking a systems-level approach to understanding the biology of identified mutants, we performed a multiparametric analysis combining pathogen and host phenotypes to predict functional relationships between mutants based on clustering. Strikingly, mutants defective in two well-known virulence factors, the ESX-1 protein secretion system and the virulence lipid phthiocerol dimycocerosate (PDIM), clustered together. Building upon the shared phenotype of loss of the macrophage type I interferon (IFN) response to infection, we found that PDIM production and export are required for coordinated secretion of ESX-1-substrates, for phagosomal permeabilization, and for downstream induction of the type I IFN response. Multiparametric clustering also identified two novel genes that are required for PDIM production and induction of the type I IFN response. Thus, multiparametric analysis combining host and pathogen infection phenotypes can be used to identify novel functional relationships between genes that play a role in infection.

Overview

The claims and statistics of this paper haven’t been checked yet.

Run the check — free, no account needed. It reads the open-access text and checks the sources it cites.

A few free checks a day · papers already verified open instantly · results are public

Integrity signals

Registry

Crossref · 10.1371/journal.ppat.1006363

Cites

62 of 62 references verified0 citation errors · 0 not checkable

Statistics

Figures

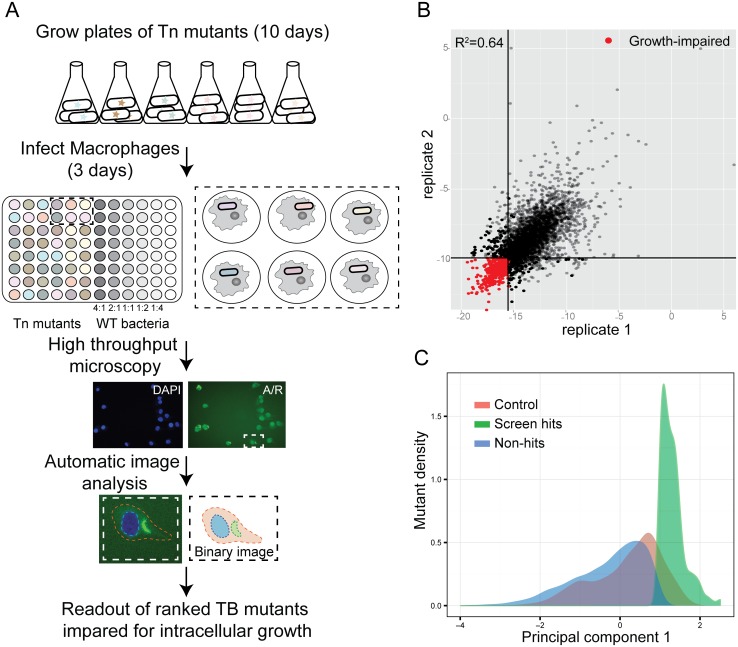
Fig 1 Identification of M. tuberculosis mutants defective for intracellular growth using a high-content imaging screen. (A) Protocol for the high-content imaging assay for the transposon mutant library growth in macrophages. Wild-type Mtb at MOIs varying two-fold from 2:1 to 0.25:1 was included in each plate to allow both accurate normalization between plates and validation of a cutoff for hits based on control population behavior. Because the transposon mutant library does not express a fluorescent protein, Mtb was externally stained with auramine-rhodamine after fixation to permit visualization. (B) Correlation of PC1 score of technical replicates in the full screen. (C) Density function of PC1 values for mutants and controls. While hits were selected based on comparison with OD-matched mutants, the distribution of hit mutants falls almost entirely below the wild-type control distribution as well, confirming that hit mutants also behave differently than wild-type.
Fig 1 Identification of M. tuberculosis mutants defective for intracellular growth using a high-content imaging screen. (A) Protocol for the high-content imaging assay for the transposon mutant library growth in macrophages. Wild-type Mtb at MOIs varying two-fold from 2:1 to 0.25:1 was included in each plate to allow both accurate normalization between plates and validation of a cutoff for hits based on control population behavior. Because the transposon mutant library does not express a fluorescent protein, Mtb was externally stained with auramine-rhodamine after fixation to permit visualization. (B) Correlation of PC1 score of technical replicates in the full screen. (C) Density function of PC1 values for mutants and controls. While hits were selected based on comparison with OD-matched mutants, the distribution of hit mutants falls almost entirely below the wild-type control distribution as well, confirming that hit mutants also behave differently than wild-type.CC BY · PubMed Central
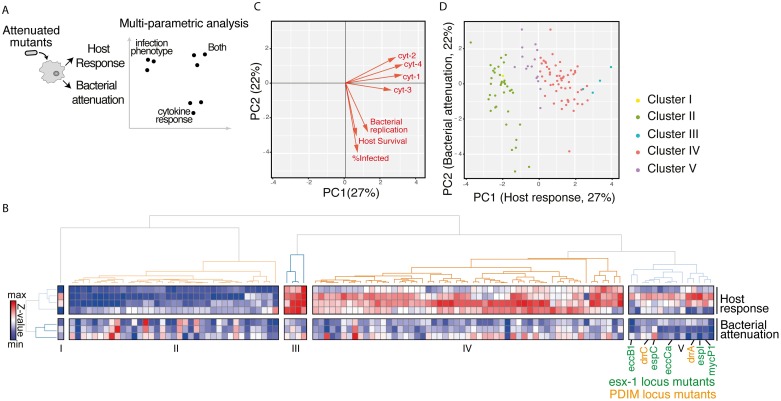
Fig 2 Multiparametric analysis of mutants impaired for intracellular growth identified subsets with shared complex phenotypes. (A) Schematic diagram of the approach to analyzing the mutants. Bacterial attenuation was analyzed based on three imaging parameters (Mtb fluorescence intensity, percent infected, and macrophage count) and host response was analyzed based on multiplexed cytokine analysis for each mutant. The phenotypes for each mutant were then combined into a multiparametric analysis as described in B. (B) Unsupervised 2-D clustering of mutants based on a multiparametric representation of their phenotypes. This analysis combines the four host response clusters (top 4 rows) and three bacterial imaging clusters (bottom 3 rows). Each column represents one of the 113 mutants included in the analysis. Colors indicate low (blue) to high (red) normalized values for each phenotype. Mutants cluster into five groups (Clusters I-V). Mutants in the PDIM locus (labels in orange) and ESX-1 locus (labels in green) group together in Cluster V. (C) Contribution of each bacterial imaging phenotype (bacterial replication, host survival, and % infected: orange vectors) and clustered cytokine response phenotype (cyt-1, cyt-2, cyt-3, and cyt-4: black vectors) to principal component 1 (PC1) and principal component 2 (PC2) of the principal component analysis. PC1 is comprised almost entirely of cytokine phenotypes while PC2 is comprised almost entirely of bacterial imaging features, suggesting that the two sets of features represent orthogonal and complementary information. (D) The 113 mutants included in the multiparametric analysis separate when plotted by PC1 and PC2. Included mutants were those that induced macrophage responses most distinct from the response to wild-type Mtb. Coloring of mutant clusters reflects mapping of the analysis performed in 2D back to the PC1/PC2 graph.
Fig 2 Multiparametric analysis of mutants impaired for intracellular growth identified subsets with shared complex phenotypes. (A) Schematic diagram of the approach to analyzing the mutants. Bacterial attenuation was analyzed based on three imaging parameters (Mtb fluorescence intensity, percent infected, and macrophage count) and host response was analyzed based on multiplexed cytokine analysis for each mutant. The phenotypes for each mutant were then combined into a multiparametric analysis as described in B. (B) Unsupervised 2-D clustering of mutants based on a multiparametric representation of their phenotypes. This analysis combines the four host response clusters (top 4 rows) and three bacterial imaging clusters (bottom 3 rows). Each column represents one of the 113 mutants included in the analysis. Colors indicate low (blue) to high (red) normalized values for each phenotype. Mutants cluster into five groups (Clusters I-V). Mutants in the PDIM locus (labels in orange) and ESX-1 locus (labels in green) group together in Cluster V. (C) Contribution of each bacterial imaging phenotype (bacterial replication, host survival, and % infected: orange vectors) and clustered cytokine response phenotype (cyt-1, cyt-2, cyt-3, and cyt-4: black vectors) to principal component 1 (PC1) and principal component 2 (PC2) of the principal component analysis. PC1 is comprised almost entirely of cytokine phenotypes while PC2 is comprised almost entirely of bacterial imaging features, suggesting that the two sets of features represent orthogonal and complementary information. (D) The 113 mutants included in the multiparametric analysis separate when plotted by PC1 and PC2. Included mutants were those that induced macrophage responses most distinct from the response to wild-type Mtb. Coloring of mutant clusters reflects mapping of the analysis performed in 2D back to the PC1/PC2 graph.CC BY · PubMed Central
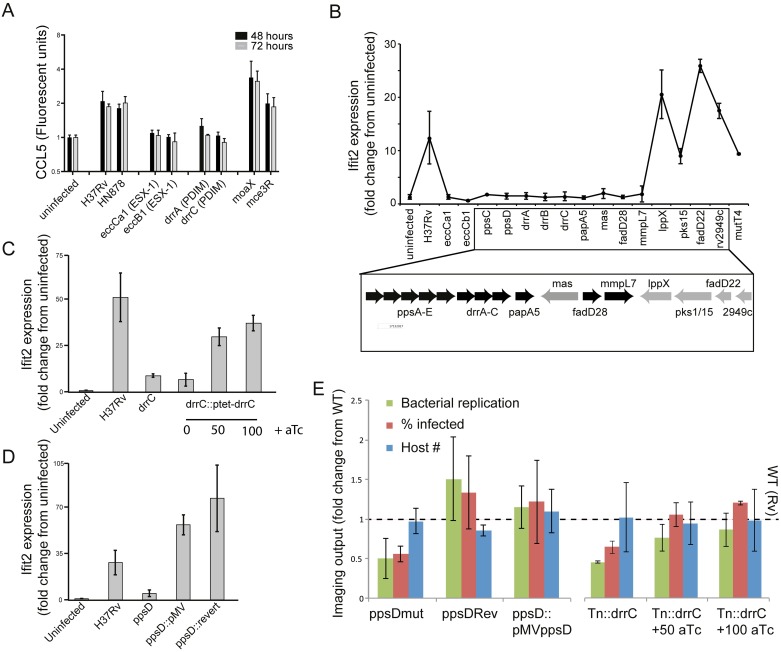
Fig 3 PDIM production and export is required for induction of the macrophage type I IFN response. (A) Measurement of macrophage CCL5 production after infection with Mtb strains. J774.A1 cells were infected with wild-type Mtb strains or transposon mutants at an MOI of 1:1. Supernatants were harvested at 48 or 72 hours after infection for cytokine quantitation using Luminex. Mean +/- SD of three biological replicates. (B-D) The type I IFN response was measured by quantitation of expression of the type I IFN-responsive gene ifit2 expression after macrophage infection with Mtb. Bone marrow-derived macrophages were infected with the indicated Mtb strains at an MOI of 2:1 and RNA was harvested at 24 hours for gene expression analysis by qRT-PCR. (B) Transposon mutants across the PDIM locus, including synthetic function mutants (ppsC, ppsD, mas), transport mutants (drrA, drrB, drrC, mmpL7), and acyl activating mutants (fadD28) failed to induce expression of type I IFN-responsive gene ifit2. P-value by two-tailed t-test for comparisons of Rv with Tn mutants in eccCb1, eccCa1, ppsC, ppsD, drrA, drrB, drrC, papA5, mas, fadD28, and fadD22 were < 0.05, for the comparison of Rv and mmpL7 was 0.05, and for the comparison of Rv with lppX, pks15, Rv2949c, and mutT4 were non-significant. (C) A drrC transposon mutant was complemented with tetracycline-inducible, chromosomally-integrated drrC; drrC expression was induced with 50ng/ml or 100ng/ml aTc. While in the absence of inducer ifit2 expression was substantially decreased relative to wild-type-infected macrophages, induction of drrC expression with aTc restored ifit2 expression. Two-tailed t-test p-value for the comparison of Rv with Tn::drrC and Tn::drrC::ptet-drrC 0 ng/ml aTc was < 0.01. (D) Infection with wild-type H37Rv, ppsD point mutant ppsD(G44C) that fails to produce PDIM, or complemented mutants ppsD(G44C)rev and ppsD(G44C)::pMVppsD. While loss of functional ppsD in the mutant resulted in loss of ifit2 expression, restoring ppsD function restored ifit2 production. Two-tailed t-test p-value for the comparison of Rv with ppsDmut was < 0.05. (B-D) Mean +/- SD of biological duplicates. (E) Microscopy of macrophages infected with PDIM mutant and complemented strains demonstrates that complementation restores wild-type image analysis phenotypes. J774A.1 macrophages were infected with wild-type, PDIM mutant, or complemented strains. After 3 days of infection, cells were washed, fixed, and stained with DAPI to visualize macrophage nuclei and auramine-rhodamine to visualize Mtb. Cells were imaged and CellProfiler automated image analysis was used [29] to quantitate bacterial fluorescent intensity, percent macrophages infected, and macrophage cell count. Mean +/- SD of six biological replicates.
Fig 3 PDIM production and export is required for induction of the macrophage type I IFN response. (A) Measurement of macrophage CCL5 production after infection with Mtb strains. J774.A1 cells were infected with wild-type Mtb strains or transposon mutants at an MOI of 1:1. Supernatants were harvested at 48 or 72 hours after infection for cytokine quantitation using Luminex. Mean +/- SD of three biological replicates. (B-D) The type I IFN response was measured by quantitation of expression of the type I IFN-responsive gene ifit2 expression after macrophage infection with Mtb. Bone marrow-derived macrophages were infected with the indicated Mtb strains at an MOI of 2:1 and RNA was harvested at 24 hours for gene expression analysis by qRT-PCR. (B) Transposon mutants across the PDIM locus, including synthetic function mutants (ppsC, ppsD, mas), transport mutants (drrA, drrB, drrC, mmpL7), and acyl activating mutants (fadD28) failed to induce expression of type I IFN-responsive gene ifit2. P-value by two-tailed t-test for comparisons of Rv with Tn mutants in eccCb1, eccCa1, ppsC, ppsD, drrA, drrB, drrC, papA5, mas, fadD28, and fadD22 were < 0.05, for the comparison of Rv and mmpL7 was 0.05, and for the comparison of Rv with lppX, pks15, Rv2949c, and mutT4 were non-significant. (C) A drrC transposon mutant was complemented with tetracycline-inducible, chromosomally-integrated drrC; drrC expression was induced with 50ng/ml or 100ng/ml aTc. While in the absence of inducer ifit2 expression was substantially decreased relative to wild-type-infected macrophages, induction of drrC expression with aTc restored ifit2 expression. Two-tailed t-test p-value for the comparison of Rv with Tn::drrC and Tn::drrC::ptet-drrC 0 ng/ml aTc was < 0.01. (D) Infection with wild-type H37Rv, ppsD point mutant ppsD(G44C) that fails to produce PDIM, or complemented mutants ppsD(G44C)rev and ppsD(G44C)::pMVppsD. While loss of functional ppsD in the mutant resulted in loss of ifit2 expression, restoring ppsD function restored ifit2 production. Two-tailed t-test p-value for the comparison of Rv with ppsDmut was < 0.05. (B-D) Mean +/- SD of biological duplicates. (E) Microscopy of macrophages infected with PDIM mutant and complemented strains demonstrates that complementation restores wild-type image analysis phenotypes. J774A.1 macrophages were infected with wild-type, PDIM mutant, or complemented strains. After 3 days of infection, cells were washed, fixed, and stained with DAPI to visualize macrophage nuclei and auramine-rhodamine to visualize Mtb. Cells were imaged and CellProfiler automated image analysis was used [29] to quantitate bacterial fluorescent intensity, percent macrophages infected, and macrophage cell count. Mean +/- SD of six biological replicates.CC BY · PubMed Central
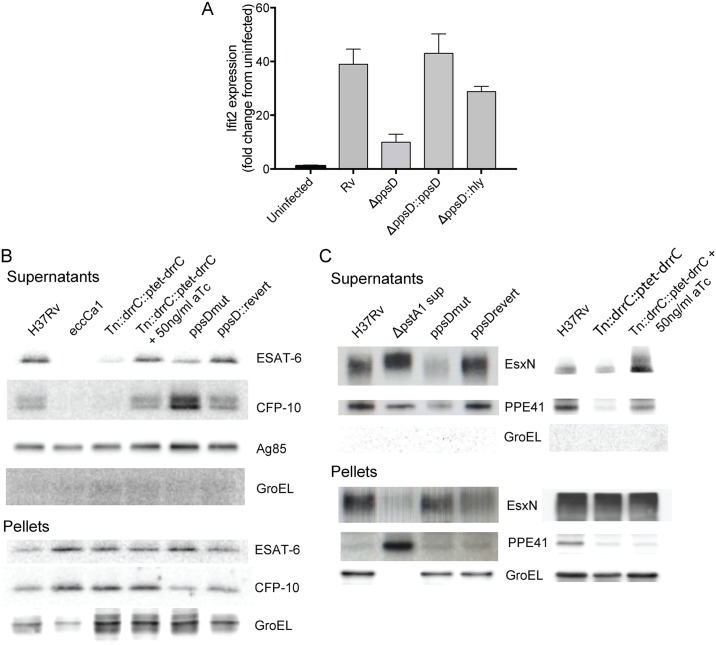
Fig 4 PDIM facilitates phagosome permeabilization and is required for coordinated ESX-1-mediated secretion. (A) Bone marrow-derived macrophages were infected with wild-type Mtb, a ppsD clean deletion strain (ΔppsD), ΔppsD complemented with ppsD, or the ΔppsD expressing listeriolysin O (hly) at an MOI of 2:1. RNA was harvested at 24 hours for gene expression analysis by qRT-PCR. Hly-mediated mediated phagosomal permeabilization restores the type I IFN response in the PDIM mutant. Mean +/- SD of biological duplicates. Two-tailed t-test p-value for the comparison of Rv with ΔppsD was < 0.001 and for the comparison of Rv with ΔppsD::hly was non-significant. (B) Western blot analysis of ESAT-6 and CFP-10 secretion in PDIM mutants. Supernatants from wild-type, ESX-1 mutant (Tn::eccCa1), or PDIM mutants and complements were harvested, concentrated, and probed for ESAT-6, CFP-10, antigen 85 (Sec-secreted control), and GroEL (lysis control). Corresponding pellets were simultaneously lysed and probed for ESAT- or CFP-10 (production control) and GroEL (loading control). Disruption of drrC results in loss of ESAT-6 and CFP-10 secretion; inducibly restoring drrC expression with 50ng/ml aTc restores ESAT-6 and CFP-10 secretion. Loss of ppsD function due to a point mutation in the active site (ppsD(G44C)) similarly results in loss of ESAT-6 secretion, but results in enhanced CFP-10 secretion. Reversion of the mutation back to wild-type ppsD(G44C)rev restores the wild-type phenotype. (C) Western blot analysis of ESX-5 secretion of EsxN and PPE41 in the ppsD point mutant and drrC transposon mutant. Supernatants from phosphate-starved wild-type or PDIM mutant and complement were harvested, concentrated, and probed for ESX-5 substrates EsxN or PPE41 and GroEL (lysis control). Supernatant from an ESX-5 hypersecreter strain (ΔpstA1) was used for definitive band identification [40]. Loss of ppsD function due to the G44C active site point mutation or loss of drrC function in the transposon mutant leads to significant loss of secretion of ESX-5 substrates PPE41 and EsxN. In both cases, secretion of EsxN and PPE41 is restored with complementation. Pellets below demonstrate that the ppsD mutant and drrC transposon mutant do not have a defect in EsxN or PPE41 production.
Fig 4 PDIM facilitates phagosome permeabilization and is required for coordinated ESX-1-mediated secretion. (A) Bone marrow-derived macrophages were infected with wild-type Mtb, a ppsD clean deletion strain (ΔppsD), ΔppsD complemented with ppsD, or the ΔppsD expressing listeriolysin O (hly) at an MOI of 2:1. RNA was harvested at 24 hours for gene expression analysis by qRT-PCR. Hly-mediated mediated phagosomal permeabilization restores the type I IFN response in the PDIM mutant. Mean +/- SD of biological duplicates. Two-tailed t-test p-value for the comparison of Rv with ΔppsD was < 0.001 and for the comparison of Rv with ΔppsD::hly was non-significant. (B) Western blot analysis of ESAT-6 and CFP-10 secretion in PDIM mutants. Supernatants from wild-type, ESX-1 mutant (Tn::eccCa1), or PDIM mutants and complements were harvested, concentrated, and probed for ESAT-6, CFP-10, antigen 85 (Sec-secreted control), and GroEL (lysis control). Corresponding pellets were simultaneously lysed and probed for ESAT- or CFP-10 (production control) and GroEL (loading control). Disruption of drrC results in loss of ESAT-6 and CFP-10 secretion; inducibly restoring drrC expression with 50ng/ml aTc restores ESAT-6 and CFP-10 secretion. Loss of ppsD function due to a point mutation in the active site (ppsD(G44C)) similarly results in loss of ESAT-6 secretion, but results in enhanced CFP-10 secretion. Reversion of the mutation back to wild-type ppsD(G44C)rev restores the wild-type phenotype. (C) Western blot analysis of ESX-5 secretion of EsxN and PPE41 in the ppsD point mutant and drrC transposon mutant. Supernatants from phosphate-starved wild-type or PDIM mutant and complement were harvested, concentrated, and probed for ESX-5 substrates EsxN or PPE41 and GroEL (lysis control). Supernatant from an ESX-5 hypersecreter strain (ΔpstA1) was used for definitive band identification [40]. Loss of ppsD function due to the G44C active site point mutation or loss of drrC function in the transposon mutant leads to significant loss of secretion of ESX-5 substrates PPE41 and EsxN. In both cases, secretion of EsxN and PPE41 is restored with complementation. Pellets below demonstrate that the ppsD mutant and drrC transposon mutant do not have a defect in EsxN or PPE41 production.CC BY · PubMed Central
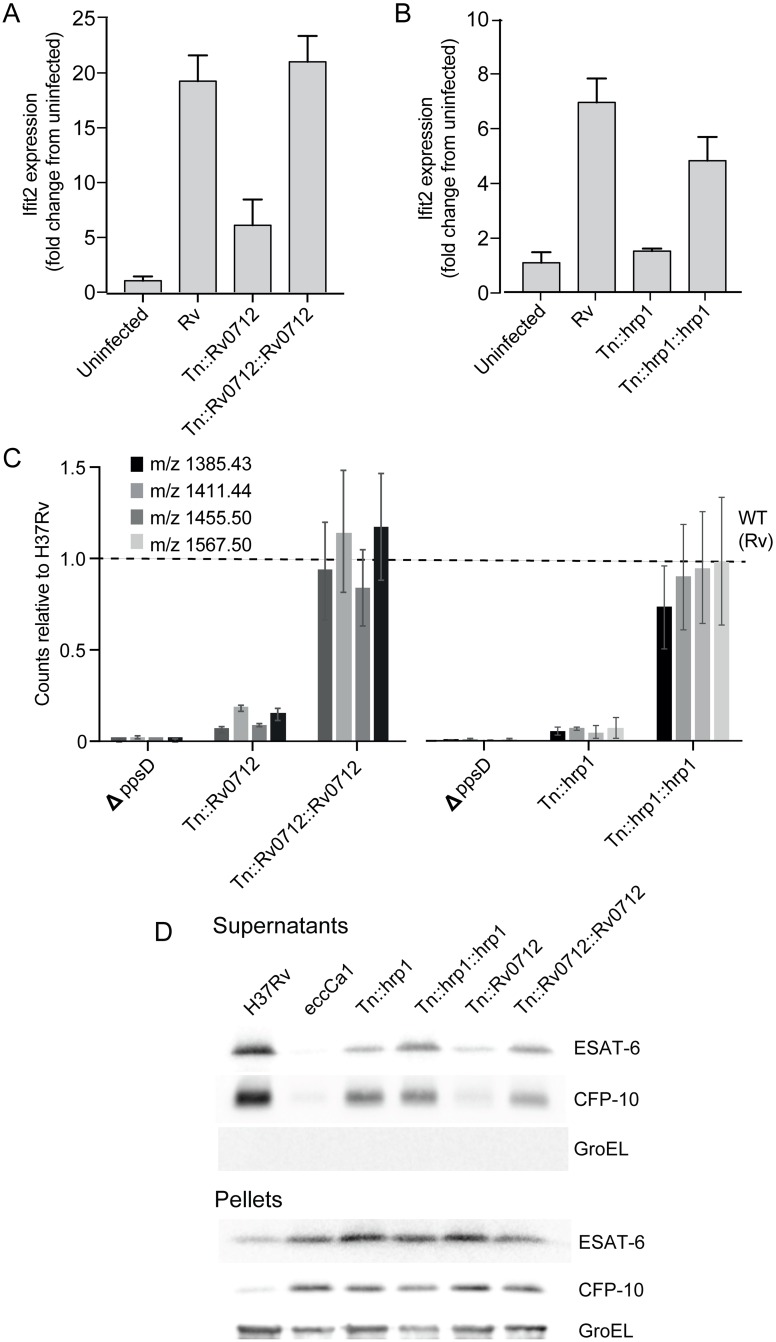
Fig 5 Two additional genes that cluster with PDIM and ESX-1 are required for PDIM production and downstream induction of the type I IFN response. (A-B) The type I IFN response to infection was measured by quantitation of expression of the type I IFN response-representative gene IFIT2. Bone-marrow derived macrophages were infected with wild-type Mtb, the Rv0712 transposon mutant and complemented mutant (A) or hrp1 transposon mutant and complemented mutant (B). RNA was harvested at 24 hours for gene expression analysis by qRT-PCR. IFIT2 was quantitated relative to control expression of GAPDH. Loss of type I IFN response to infection seen with disruption of Tn0712 or hrp1 in each mutant is restored with expression of the respective gene in the complemented strains. (A-B) Mean +/- SD of biological duplicates. Two-tailed t-test p-value for the comparison of Rv with Tn::hrp1 and Tn::Rv0712 was < 0.001. (C) PDIM was quantitated using LC-MS analysis of total cell wall lipid extracts. The indicated strains were grown in tween-free medium; total cell wall lipids were extracted from the bacterial cells. Loss of PDIM production seen in Rv0712 and hrp1 transposon mutants was restored with expression of the respective genes in the complemented strains. Mean +/- SD of biological triplicates. Fragmentation patterns for each quantitated species is listed in S1 Text. (D) Western blot analysis of ESAT-6 and CFP-10 secretion in Rv0712 and hrp1 mutants. Supernatants from each indicated strain including H37Rv wild-type control and Tn::ecca1 (ESX-1 mutant positive control) were harvested, concentrated, and probed for ESAT-6 or CFP-10, and GroEL (lysis control). Corresponding pellets were simultaneously lysed and probed for ESAT- or CFP-10 (production control) and GroEL (loading control). Disruption of Rv0712 resulted in diminished secretion of both ESAT-6 and CFP10; loss of secretion was reversed with complementation. Disruption of hrp1 resulted in diminished ESAT-6 secretion but no change in CFP-10 secretion. Diminished ESAT-6 secretion in the hrp1 mutant was restored with complementation.
Fig 5 Two additional genes that cluster with PDIM and ESX-1 are required for PDIM production and downstream induction of the type I IFN response. (A-B) The type I IFN response to infection was measured by quantitation of expression of the type I IFN response-representative gene IFIT2. Bone-marrow derived macrophages were infected with wild-type Mtb, the Rv0712 transposon mutant and complemented mutant (A) or hrp1 transposon mutant and complemented mutant (B). RNA was harvested at 24 hours for gene expression analysis by qRT-PCR. IFIT2 was quantitated relative to control expression of GAPDH. Loss of type I IFN response to infection seen with disruption of Tn0712 or hrp1 in each mutant is restored with expression of the respective gene in the complemented strains. (A-B) Mean +/- SD of biological duplicates. Two-tailed t-test p-value for the comparison of Rv with Tn::hrp1 and Tn::Rv0712 was < 0.001. (C) PDIM was quantitated using LC-MS analysis of total cell wall lipid extracts. The indicated strains were grown in tween-free medium; total cell wall lipids were extracted from the bacterial cells. Loss of PDIM production seen in Rv0712 and hrp1 transposon mutants was restored with expression of the respective genes in the complemented strains. Mean +/- SD of biological triplicates. Fragmentation patterns for each quantitated species is listed in S1 Text. (D) Western blot analysis of ESAT-6 and CFP-10 secretion in Rv0712 and hrp1 mutants. Supernatants from each indicated strain including H37Rv wild-type control and Tn::ecca1 (ESX-1 mutant positive control) were harvested, concentrated, and probed for ESAT-6 or CFP-10, and GroEL (lysis control). Corresponding pellets were simultaneously lysed and probed for ESAT- or CFP-10 (production control) and GroEL (loading control). Disruption of Rv0712 resulted in diminished secretion of both ESAT-6 and CFP10; loss of secretion was reversed with complementation. Disruption of hrp1 resulted in diminished ESAT-6 secretion but no change in CFP-10 secretion. Diminished ESAT-6 secretion in the hrp1 mutant was restored with complementation.CC BY · PubMed Central

Verification

Claims the paper makes

The claims and statistics of this paper haven’t been checked yet.

Run the check — free, no account needed. It reads the open-access text and checks the sources it cites.

A few free checks a day · papers already verified open instantly · results are public

Claims other papers make about this one

Each is checked against this paper’s own text: does it say what the citing paper says it does?

Self-check

Percentages, sums and reported differences re-computed from the paper’s own numbers.

The self-check needs the paper’s full text.

Citations

Cites

Show all 62 references

Cited by

Sorted by citations

See all 120

Metadata

Authors
Barczak, A. K., Avraham, R., Singh, S., Luo, S. S., Zhang, W. R., Bray, M.-A., Hinman, A. E., Thompson, M., Nietupski, R. M., Golas, A., Montgomery, P., Fitzgerald, M., Smith, R. S., White, D. W., Tischler, A. D., Carpenter, A. E., & Hung, D. T.
Affiliations
  • Broad Institute (US)
  • Harvard University (US)
  • University of Minnesota (US)
Corresponding author
Hung, Deborah T.
Venue
PLOS Pathogens
Published
2017-05-15
Volume
13
Issue
5
Pages
e1006363
ISSN
  • 1553-7366 (ISSN-L)
  • 1553-7374
OpenAlex
W2615762114
Cited by
120
References
62
Citations by year
2026: 16 · 2025: 14 · 2024: 11 · 2023: 14 · 2022: 12 · 2021: 10 · 2020: 14 · 2019: 13 · 2018: 12 · 2017: 4
FWCI
9.05
Type
journal article
Language
en
Open access
Locations
  • PLoS Pathogens (publishedVersion, cc-by)
  • Europe PMC (PubMed Central) (publishedVersion, cc-by)
  • PubMed Central (publishedVersion, cc-by)
  • PubMed (publishedVersion)
  • Digital Access to Scholarship at Harvard (DASH) (Harvard University) (submittedVersion, cc-by)
  • DOAJ (DOAJ: Directory of Open Access Journals) (submittedVersion, cc-by-sa)
  • Figshare (submittedVersion, cc-by)
Funders
  • National Institute of Allergy and Infectious Diseases (K08-AI080944)
  • Massachusetts General Hospital (Claflin Award)
  • Ragon Institute (TB Seed Grant)
  • Broad Institute Tuberculosis Donor Group and Pershing Square Foundation
  • Harvard University Center for AIDS Research (US) (P30-AI060354)
  • Massachusetts General Hospital Department of Medicine (Pingree Transformative Scholar Award)
Topics
  • Health Sciences › Medicine › Infectious Diseases › Tuberculosis Research and Epidemiology
  • Health Sciences › Medicine › Epidemiology › Mycobacterium research and diagnosis
  • Health Sciences › Medicine › Infectious Diseases › Infectious Diseases and Tuberculosis
Keywords
Mycobacterium tuberculosis, intracellular survival, macrophages, virulence factors, ESX-1 secretion system, phthiocerol dimycocerosate, type I interferon response, transposon mutant library, high-content imaging, macrophage cytokine response, tuberculosis pathogenesis
MeSH terms
Animals, Antigens, Bacterial, Bacterial Proteins, Cell Line, Macrophages, Mutation, Mycobacterium tuberculosis, Phagosomes, Phenotype, Tuberculosis, Virulence, Gene Library, Cytokines, Mice, Host-Pathogen Interactions

About these checks

Registry, retraction, Cites and statistics results are computed, not judged, with one exception: a printed reference that no index lists is read once by a model before it counts as a citation error. Claims are extracted by a model and kept only when their quote appears verbatim in the text; each cited source is then checked, with a model’s help, for whether it says what the claim relies on. Those verdicts can be wrong — read the claim’s quote and the cited source before relying on one.

Statistics and arithmetic are recomputed, not judged.

Confidence bands are shown only for fields calibrated on our annotated test set. None is calibrated yet, so no band is shown.

What counts as a claim ›How we measure confidence ›How we check this ›

Are you an author, or do you see a problem with this page? Request a review