CoChat

Murine leukemia virus p12 tethers the capsid-containing pre-integration complex to chromatin by binding directly to host nucleosomes in mitosis

Open access

The DOI matches its Crossref record; 54 of the 54 references it cites were found in a registry or an index.

Abstract

The murine leukaemia virus (MLV) Gag cleavage product, p12, is essential for both early and late steps in viral replication. The N-terminal domain of p12 binds directly to capsid (CA) and stabilises the mature viral core, whereas defects in the C-terminal domain (CTD) of p12 can be rescued by addition of heterologous chromatin binding sequences (CBSs). We and others hypothesised that p12 tethers the pre-integration complex (PIC) to host chromatin ready for integration. Using confocal microscopy, we have observed for the first time that CA localises to mitotic chromatin in infected cells in a p12-dependent manner. GST-tagged p12 alone, however, did not localise to chromatin and mass-spectrometry analysis of its interactions identified only proteins known to bind the p12 region of Gag. Surprisingly, the ability to interact with chromatin was conferred by a single amino acid change, M63I, in the p12 CTD. Interestingly, GST-p12_M63I showed increased phosphorylation in mitosis relative to interphase, which correlated with an increased interaction with mitotic chromatin. Mass-spectrometry analysis of GST-p12_M63I revealed nucleosomal histones as primary interactants. Direct binding of MLV p12_M63I peptides to histones was confirmed by biolayer-interferometry (BLI) assays using highly-avid recombinant poly-nucleosomal arrays. Excitingly, using this method, we also observed binding between MLV p12_WT and nucleosomes. Nucleosome binding was additionally detected with p12 orthologs from feline and gibbon ape leukemia viruses using both pull-down and BLI assays, indicating that this a common feature of gammaretroviral p12 proteins. Importantly, p12 peptides were able to block the binding of the prototypic foamy virus CBS to nucleosomes and vice versa, implying that their docking sites overlap and suggesting a conserved mode of chromatin tethering for different retroviral genera. We propose that p12 is acting in a similar capacity to CPSF6 in HIV-1 infection by facilitating initial chromatin targeting of CA-containing PICs prior to integration.

Overview

The claims and statistics of this paper haven’t been checked yet.

Free: it reads the open-access text and checks the first 5 claims that cite a source we can check. Create a free account to check every claim.

A few free checks a day · papers already verified open instantly · results are public

Integrity signals

Registry

Crossref · 10.1371/journal.ppat.1007117

Cites

54 of 54 references verified0 citation errors · 0 not checkable

Statistics

Figures

Fig 1 The N-terminal domain of MLV p12 directly binds hexameric CA arrays. (A) Schematic representation of the MLV Gag-Pol expression plasmid used in this study, showing the Mo-MLV p12 sequence with alanine substitution mutants below. (B) Immunoblot showing binding of p12 to N-MLV CA. His-tagged WT (lane 2) or P1G mutant (lane 3) CA proteins were immobilised on lipid nanotubes comprising the Ni2+-chelating lipid, DGS-NTA, prior to incubation with purified p12_WT, p12_mut6 (NTD mutant) or p12_mut14 (CTD mutant). No lipid tubes or CA were included in the negative control reactions (lane 4). CA nanotubes were pelleted, and any bound p12 was revealed by SDS-PAGE and immunoblotting with a rabbit anti-p12 antibody. 1/40th of the purified p12 protein input was loaded in lane 1. (C) Co-immunoprecipitation (Co-IP) of CA with p12 from viral lysates. Mo-MLV virus-like particles (VLPs) carrying myc-tagged p12_WT (lanes 1 and 2), p12_mut6 (lanes 3 and 4) or p12_mut14 (lanes 5 and 6) were either untreated (lanes 1, 3 and 5) or fixed in 1% formaldehyde (lanes 2, 4 and 6) prior to lysis. Myc-p12 was immunoprecipitated from normalised viral lysates using an anti-myc antibody. 1/50th of input lysates and 1/5th of Co-IP elutions were analysed by immunoblotting with anti-CA and rabbit anti-p12 antibodies. (D) Immunoblot showing binding of p12 specifically to CA hexamers. His-tagged WT (lanes 2 and 4) or P1G mutant (lanes 3 and 5) CA proteins were immobilised as hexamers on lipid nanotubes (lanes 2 and 3), or randomly on Ni-NTA beads (lanes 4 and 5). No CA, beads or tubes were included in the negative control (lane 6). After incubation with p12, the CA assemblies were pelleted and analysed by SDS-PAGE and immunoblotting for CA (anti-His) and p12 (mouse anti-p12). 1/40th of the purified p12 protein input was loaded in lane 1.
Fig 1 The N-terminal domain of MLV p12 directly binds hexameric CA arrays. (A) Schematic representation of the MLV Gag-Pol expression plasmid used in this study, showing the Mo-MLV p12 sequence with alanine substitution mutants below. (B) Immunoblot showing binding of p12 to N-MLV CA. His-tagged WT (lane 2) or P1G mutant (lane 3) CA proteins were immobilised on lipid nanotubes comprising the Ni2+-chelating lipid, DGS-NTA, prior to incubation with purified p12_WT, p12_mut6 (NTD mutant) or p12_mut14 (CTD mutant). No lipid tubes or CA were included in the negative control reactions (lane 4). CA nanotubes were pelleted, and any bound p12 was revealed by SDS-PAGE and immunoblotting with a rabbit anti-p12 antibody. 1/40th of the purified p12 protein input was loaded in lane 1. (C) Co-immunoprecipitation (Co-IP) of CA with p12 from viral lysates. Mo-MLV virus-like particles (VLPs) carrying myc-tagged p12_WT (lanes 1 and 2), p12_mut6 (lanes 3 and 4) or p12_mut14 (lanes 5 and 6) were either untreated (lanes 1, 3 and 5) or fixed in 1% formaldehyde (lanes 2, 4 and 6) prior to lysis. Myc-p12 was immunoprecipitated from normalised viral lysates using an anti-myc antibody. 1/50th of input lysates and 1/5th of Co-IP elutions were analysed by immunoblotting with anti-CA and rabbit anti-p12 antibodies. (D) Immunoblot showing binding of p12 specifically to CA hexamers. His-tagged WT (lanes 2 and 4) or P1G mutant (lanes 3 and 5) CA proteins were immobilised as hexamers on lipid nanotubes (lanes 2 and 3), or randomly on Ni-NTA beads (lanes 4 and 5). No CA, beads or tubes were included in the negative control (lane 6). After incubation with p12, the CA assemblies were pelleted and analysed by SDS-PAGE and immunoblotting for CA (anti-His) and p12 (mouse anti-p12). 1/40th of the purified p12 protein input was loaded in lane 1.CC BY · PubMed Central
Fig 2 CA and p12 co-localise on mitotic chromatin independently of BET-protein binding. HeLa cells synchronised using a double-aphidicolin block were infected with WT Mo-MLV VLPs or mutants carrying p12_mut14 or IN_W390A. 10 h post-infection, the cells were fixed, stained for p12 (anti-p12, red), CA (anti-CA, green) and DNA (DAPI, blue), and analysed by confocal microscopy. (A) Representative images showing WT p12 and CA co-localisation on mitotic chromatin. Bottom panels are enlarged views of boxed regions in top panels. (B) Representative images of cells infected with VLPs carrying p12_WT (top panels) or p12_mut14 (bottom panels). (C) A representative image of cells infected with VLPs carrying IN_W390A, which is deficient in BET protein binding. (D) Infectivity of Mo-MLV VLPs carrying alterations in p12 and/or IN. HeLa cells were challenged with equivalent RT units of LacZ-encoding VLPs carrying p12_WT, p12_mut14, p12+hCBS or (p12+hCBS)_mut14 in combination with IN_WT or BET-binding deficient IN_W390A. Infectivity was measured 72 h post-infection by detection of beta-galactosidase activity in a chemiluminescent reporter assay. The data are plotted as percentage of WT VLP infectivity (mean ± SEM of >3 biological replicates).
Fig 2 CA and p12 co-localise on mitotic chromatin independently of BET-protein binding. HeLa cells synchronised using a double-aphidicolin block were infected with WT Mo-MLV VLPs or mutants carrying p12_mut14 or IN_W390A. 10 h post-infection, the cells were fixed, stained for p12 (anti-p12, red), CA (anti-CA, green) and DNA (DAPI, blue), and analysed by confocal microscopy. (A) Representative images showing WT p12 and CA co-localisation on mitotic chromatin. Bottom panels are enlarged views of boxed regions in top panels. (B) Representative images of cells infected with VLPs carrying p12_WT (top panels) or p12_mut14 (bottom panels). (C) A representative image of cells infected with VLPs carrying IN_W390A, which is deficient in BET protein binding. (D) Infectivity of Mo-MLV VLPs carrying alterations in p12 and/or IN. HeLa cells were challenged with equivalent RT units of LacZ-encoding VLPs carrying p12_WT, p12_mut14, p12+hCBS or (p12+hCBS)_mut14 in combination with IN_WT or BET-binding deficient IN_W390A. Infectivity was measured 72 h post-infection by detection of beta-galactosidase activity in a chemiluminescent reporter assay. The data are plotted as percentage of WT VLP infectivity (mean ± SEM of >3 biological replicates).CC BY · PubMed Central
Fig 3 Recombinant GST-Mo-MLV p12 does not associate with mitotic chromatin but is phosphorylated. (A) A representative immunoblot showing subcellular distribution of GST-p12. GST-tagged Mo-MLV p12_WT (lanes 1–3), p12_mut14 (lanes 4–6) and p12+hCBS (lanes 7–9) were expressed in 293T cells for ~40 h. Cells were then subjected to biochemical fractionation and equivalent amounts of fractions S2-cytosolic (lanes 1, 4 and 7), S3-soluble nuclear (lanes 2, 5 and 8) and P3-chromatin pellet (lanes 3, 6 and 9) were analysed by SDS-PAGE and immunoblotting with anti-p12, anti-HSP90 (cytosolic marker) and anti-H2B (chromatin marker) antibodies. (B) Representative confocal microscopy images showing GST-p12 localisation in HeLa cells stably transduced with constructs expressing GST-tagged Mo-MLV p12_WT, p12_mut14 or p12+hCBS. Cells were stained for p12 (anti-p12, red) and DNA (DAPI, blue). White boxes indicate mitotic cells. (C) Representative silver-stained SDS-PAGE gel (left) and immunoblot (right) of GST-p12 complexes. 293T cells were transiently-transfected with expression constructs for GST-tagged Mo-MLV p12_WT (lane 2), p12_mut14 (lane 3) or p12+hCBS (lane 4), or GST alone (lane 1). 24 h post-transfection, cells were treated with nocodazole overnight to arrest them in mitosis and then lysed. Cell lysates were normalised on total protein concentration and GST-p12 protein complexes were precipitated with glutathione-sepharose beads. Bead eluates were analysed by SDS-PAGE followed by silver-staining or immunoblotting with anti-H2A, anti-H2B, anti-H3 or anti-H4 antibodies. Bands corresponding to core histones in the silver-stained gel are starred. (D) Immunoblot showing DNA pull down assays. 293T cells were transiently-transfected with expression constructs for GST alone (top panel), GST-tagged Mo-MLV p12_WT (middle panel), or IN-HA (bottom panel) for ~40 h. DNA interacting proteins were precipitated from normalised cell lysates with cellulose beads coated with double stranded (lane 2) or single-stranded (lane 3) calf thymus DNA, and analysed by immunoblotting with anti-GST, anti-p12, or anti-IN antibodies, respectively. The arrows indicate full-length GST-p12 (~38 kDa) and IN-HA (~49 kDa) bands in the western blots. (E) GST-p12 phosphorylation. Normalised, mitotic cell lysates expressing GST-tagged Mo-MLV p12_WT (lane 3) or p12_S61A (lanes 1 and 2) were incubated with glutathione-sepharose beads. Bound proteins were separated by SDS-PAGE and the gel was sequentially stained with ProQ diamond (PQ, specifically stains phosphorylated proteins) and Sypro ruby (SR, stains all proteins) dyes. Prior to SDS-PAGE, one p12_S61A sample was treated with alkaline phosphatase (AP) for 1 h at 37°C. Band intensities were measured using a ChemiDoc imaging system and the bar chart shows PQ/SR ratios, plotted as mean ± SD of 3 technical replicates.
Fig 3 Recombinant GST-Mo-MLV p12 does not associate with mitotic chromatin but is phosphorylated. (A) A representative immunoblot showing subcellular distribution of GST-p12. GST-tagged Mo-MLV p12_WT (lanes 1–3), p12_mut14 (lanes 4–6) and p12+hCBS (lanes 7–9) were expressed in 293T cells for ~40 h. Cells were then subjected to biochemical fractionation and equivalent amounts of fractions S2-cytosolic (lanes 1, 4 and 7), S3-soluble nuclear (lanes 2, 5 and 8) and P3-chromatin pellet (lanes 3, 6 and 9) were analysed by SDS-PAGE and immunoblotting with anti-p12, anti-HSP90 (cytosolic marker) and anti-H2B (chromatin marker) antibodies. (B) Representative confocal microscopy images showing GST-p12 localisation in HeLa cells stably transduced with constructs expressing GST-tagged Mo-MLV p12_WT, p12_mut14 or p12+hCBS. Cells were stained for p12 (anti-p12, red) and DNA (DAPI, blue). White boxes indicate mitotic cells. (C) Representative silver-stained SDS-PAGE gel (left) and immunoblot (right) of GST-p12 complexes. 293T cells were transiently-transfected with expression constructs for GST-tagged Mo-MLV p12_WT (lane 2), p12_mut14 (lane 3) or p12+hCBS (lane 4), or GST alone (lane 1). 24 h post-transfection, cells were treated with nocodazole overnight to arrest them in mitosis and then lysed. Cell lysates were normalised on total protein concentration and GST-p12 protein complexes were precipitated with glutathione-sepharose beads. Bead eluates were analysed by SDS-PAGE followed by silver-staining or immunoblotting with anti-H2A, anti-H2B, anti-H3 or anti-H4 antibodies. Bands corresponding to core histones in the silver-stained gel are starred. (D) Immunoblot showing DNA pull down assays. 293T cells were transiently-transfected with expression constructs for GST alone (top panel), GST-tagged Mo-MLV p12_WT (middle panel), or IN-HA (bottom panel) for ~40 h. DNA interacting proteins were precipitated from normalised cell lysates with cellulose beads coated with double stranded (lane 2) or single-stranded (lane 3) calf thymus DNA, and analysed by immunoblotting with anti-GST, anti-p12, or anti-IN antibodies, respectively. The arrows indicate full-length GST-p12 (~38 kDa) and IN-HA (~49 kDa) bands in the western blots. (E) GST-p12 phosphorylation. Normalised, mitotic cell lysates expressing GST-tagged Mo-MLV p12_WT (lane 3) or p12_S61A (lanes 1 and 2) were incubated with glutathione-sepharose beads. Bound proteins were separated by SDS-PAGE and the gel was sequentially stained with ProQ diamond (PQ, specifically stains phosphorylated proteins) and Sypro ruby (SR, stains all proteins) dyes. Prior to SDS-PAGE, one p12_S61A sample was treated with alkaline phosphatase (AP) for 1 h at 37°C. Band intensities were measured using a ChemiDoc imaging system and the bar chart shows PQ/SR ratios, plotted as mean ± SD of 3 technical replicates.CC BY · PubMed Central
Fig 4 GST-Mo-MLV p12 recapitulates known interactions of the p12 region of Gag. Cellular proteins interacting with GST-p12 were identified using SILAC-MS. Two biological repeats (R1 and R2) were performed. (A) Schematic diagram of the SILAC-MS workflow. GST-protein complexes were isolated from normalised mitotic 293T cell lysates using glutathione-sepharose beads, pooled and subjected to LC-MS/MS analysis. (B) Identification of proteins enriched in the heavy-labelled GST-p12_WT (H) sample relative to light-labelled GST (L) sample. Log2(H/L) silac ratios of the set of MS hits (FDR <5%) from each replicate (R1 and R2) were plotted as a frequency distribution. Mean and standard deviation (SD) of each distribution was estimated by fitting to a normal distribution curve (R2 ≥ 0.98). MS hits with log2(H/L) ratios greater than 2.58 SDs from the mean were selected as significantly enriched in the GST-p12_WT (H) sample. Of the 21 such proteins identified in R1, 7 were also found in R2 (Venn diagram), and were investigated further. (C) Ranking of the 7 potential GST-p12_WT binding proteins. The abundance factor for each protein was calculated by dividing the peptide spectral count by its length. These values were then normalised across the group and the scores for R1 plotted against the scores for R2. The points are coloured according to the protein function shown in the pie chart. CLTC = clathrin heavy chain, CLINT1 = clathrin interactor 1, WWP2 = NEDD4-like E3 ubiquitin ligase, CLTA = clathrin light chain, PI3KC2A = phosphatidylinositol-4-phosphate-3-kinase C2, SEC16A = protein transport protein Sec16A, INCENP = inner centromere protein. (D) The relative enrichment of the 7 proteins (putative GST-p12_WT interactors) in the GST-p12_WT (H) samples compared to GST-p12_mut14 (M) samples was estimated from the log2(H/M) ratios. (E) Representative silver stained gel (left) and immunoblot (right) showing binding of a panel of GST-p12 mutants to selected host proteins. Mutant nomenclature is shown in Fig 1. 293T cells were transiently-transfected with expression constructs for GST-tagged Mo-MLV p12_WT (lane 2), p12 mutants (lanes 3–10) or GST (lane 1) for ~24 h before being treated overnight with nocodazole. GST-p12 protein complexes were precipitated from normalised cell lysates with glutathione-sepharose beads and analysed by SDS-PAGE followed by silver-staining or immunoblotting with anti-CLTC, anti-CLINT1, anti-WWP2 and anti-H2B antibodies.
Fig 4 GST-Mo-MLV p12 recapitulates known interactions of the p12 region of Gag. Cellular proteins interacting with GST-p12 were identified using SILAC-MS. Two biological repeats (R1 and R2) were performed. (A) Schematic diagram of the SILAC-MS workflow. GST-protein complexes were isolated from normalised mitotic 293T cell lysates using glutathione-sepharose beads, pooled and subjected to LC-MS/MS analysis. (B) Identification of proteins enriched in the heavy-labelled GST-p12_WT (H) sample relative to light-labelled GST (L) sample. Log2(H/L) silac ratios of the set of MS hits (FDR <5%) from each replicate (R1 and R2) were plotted as a frequency distribution. Mean and standard deviation (SD) of each distribution was estimated by fitting to a normal distribution curve (R2 ≥ 0.98). MS hits with log2(H/L) ratios greater than 2.58 SDs from the mean were selected as significantly enriched in the GST-p12_WT (H) sample. Of the 21 such proteins identified in R1, 7 were also found in R2 (Venn diagram), and were investigated further. (C) Ranking of the 7 potential GST-p12_WT binding proteins. The abundance factor for each protein was calculated by dividing the peptide spectral count by its length. These values were then normalised across the group and the scores for R1 plotted against the scores for R2. The points are coloured according to the protein function shown in the pie chart. CLTC = clathrin heavy chain, CLINT1 = clathrin interactor 1, WWP2 = NEDD4-like E3 ubiquitin ligase, CLTA = clathrin light chain, PI3KC2A = phosphatidylinositol-4-phosphate-3-kinase C2, SEC16A = protein transport protein Sec16A, INCENP = inner centromere protein. (D) The relative enrichment of the 7 proteins (putative GST-p12_WT interactors) in the GST-p12_WT (H) samples compared to GST-p12_mut14 (M) samples was estimated from the log2(H/M) ratios. (E) Representative silver stained gel (left) and immunoblot (right) showing binding of a panel of GST-p12 mutants to selected host proteins. Mutant nomenclature is shown in Fig 1. 293T cells were transiently-transfected with expression constructs for GST-tagged Mo-MLV p12_WT (lane 2), p12 mutants (lanes 3–10) or GST (lane 1) for ~24 h before being treated overnight with nocodazole. GST-p12 protein complexes were precipitated from normalised cell lysates with glutathione-sepharose beads and analysed by SDS-PAGE followed by silver-staining or immunoblotting with anti-CLTC, anti-CLINT1, anti-WWP2 and anti-H2B antibodies.CC BY · PubMed Central
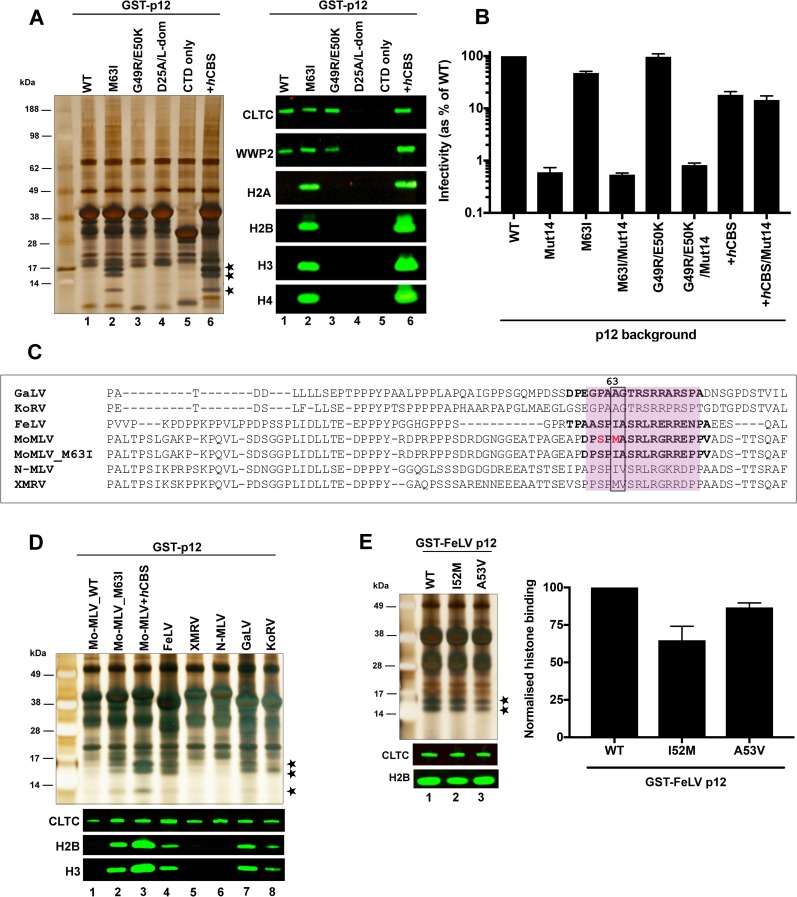
Fig 5 GST-Mo-MLV p12_M63I and other p12 orthologs associate with mitotic chromatin. (A) Representative silver stained gel (left) and immunoblot (right) showing binding of a panel of GST-p12 mutants to host proteins. 293T cells were transiently-transfected with expression constructs for GST-tagged Mo-MLV p12_WT (lane 1) and a panel of Mo-MLV p12 mutants: M63I (lane 2), G49R/E50K (lane 3), D25A/L-dom (carrying alanine substitutions of the PPPY motif as well as D25A, which disrupts clathrin binding, lane 4), p12 CTD only (lane 5) or GST-p12+hCBS (positive control, lane 6) for ~24 h before being treated overnight with nocodazole. GST-p12 protein complexes were precipitated from normalised cell lysates with glutathione-sepharose beads and analysed by SDS-PAGE followed by silver-staining or immunoblotting with anti-CLTC, anti-WWP2, anti-H2A, anti-H2B, anti-H3 and anti-H4 antibodies. Bands corresponding to core histones in the silver-stained gel are starred. (B) Infectivity of Mo-MLV VLPs carrying alterations in p12. HeLa cells were challenged with equivalent RT units of LacZ-encoding VLPs carrying Mo-MLV p12_WT, M63I, G49R/E50K or p12+hCBS +/- Mut14, and infectivity was measured 72 h post-infection by detection of beta-galactosidase activity in a chemiluminescent reporter assay. The data are plotted as percentage of WT VLP infectivity (mean ± SEM of >3 biological replicates). (C) An alignment of p12 sequences from selected gammaretroviruses. The CTD region is shaded pink. The S61 and M63 residues of Mo-MLV p12 are highlighted in red and equivalent residues at position 63 and 64 are boxed. CTD peptide sequences used in subsequent BLI assays (Fig 9) are in bold. (D and E) Representative silver stained gel (top) and immunoblot (bottom) showing interaction of a panel of GST-tagged p12 orthologues (D) and GST-tagged FeLV_p12 mutants I52M and A53V (E) to chromatin associated proteins. GST-pull down assays were performed as in (A). (E) The amount of histone H2B pulled-down with GST-p12 was quantified for each sample by estimating median band intensity of immunoblots using a Li-cor Odyssey imaging system and plotted in the bar chart as mean ± SD of 3 technical replicates.
Fig 5 GST-Mo-MLV p12_M63I and other p12 orthologs associate with mitotic chromatin. (A) Representative silver stained gel (left) and immunoblot (right) showing binding of a panel of GST-p12 mutants to host proteins. 293T cells were transiently-transfected with expression constructs for GST-tagged Mo-MLV p12_WT (lane 1) and a panel of Mo-MLV p12 mutants: M63I (lane 2), G49R/E50K (lane 3), D25A/L-dom (carrying alanine substitutions of the PPPY motif as well as D25A, which disrupts clathrin binding, lane 4), p12 CTD only (lane 5) or GST-p12+hCBS (positive control, lane 6) for ~24 h before being treated overnight with nocodazole. GST-p12 protein complexes were precipitated from normalised cell lysates with glutathione-sepharose beads and analysed by SDS-PAGE followed by silver-staining or immunoblotting with anti-CLTC, anti-WWP2, anti-H2A, anti-H2B, anti-H3 and anti-H4 antibodies. Bands corresponding to core histones in the silver-stained gel are starred. (B) Infectivity of Mo-MLV VLPs carrying alterations in p12. HeLa cells were challenged with equivalent RT units of LacZ-encoding VLPs carrying Mo-MLV p12_WT, M63I, G49R/E50K or p12+hCBS +/- Mut14, and infectivity was measured 72 h post-infection by detection of beta-galactosidase activity in a chemiluminescent reporter assay. The data are plotted as percentage of WT VLP infectivity (mean ± SEM of >3 biological replicates). (C) An alignment of p12 sequences from selected gammaretroviruses. The CTD region is shaded pink. The S61 and M63 residues of Mo-MLV p12 are highlighted in red and equivalent residues at position 63 and 64 are boxed. CTD peptide sequences used in subsequent BLI assays (Fig 9) are in bold. (D and E) Representative silver stained gel (top) and immunoblot (bottom) showing interaction of a panel of GST-tagged p12 orthologues (D) and GST-tagged FeLV_p12 mutants I52M and A53V (E) to chromatin associated proteins. GST-pull down assays were performed as in (A). (E) The amount of histone H2B pulled-down with GST-p12 was quantified for each sample by estimating median band intensity of immunoblots using a Li-cor Odyssey imaging system and plotted in the bar chart as mean ± SD of 3 technical replicates.CC BY · PubMed Central
Fig 6 GST-tagged Mo-MLV p12_M63I shows increased chromatin association and phosphorylation in mitosis. (A) A representative immunoblot showing subcellular distribution of GST-p12 mutants. GST-tagged GST-p12_M63I (lanes 1–3) or GST-p12+hCBS (lanes 4–6) were expressed in 293T cells for ~40 h. Cells were then subjected to biochemical fractionation and equivalent amounts of fractions S2-cytosolic, S3-soluble nuclear and P3-chromatin pellet were analysed by SDS-PAGE and immunoblotting with anti-p12, anti-HSP90 (cytosolic marker) and anti-H2B (chromatin marker) antibodies. (B) Representative confocal microscopy images showing GST-p12 localisation in HeLa cells stably transduced with constructs expressing GST-p12_M63I and GST-p12+hCBS. Cells were stained for p12 (anti-p12, green) and H2B (anti-H2B, red). Blue boxes indicate mitotic cells and red boxes show interphase cells. (C) Representative silver stained gel (top) and immunoblot (bottom) comparing the interaction of GST-p12_M63I and GST-p12+hCBS with mitotic and interphase chromatin. 293T cells were transiently-transfected with expression constructs for GST-tagged Mo-MLV p12_WT, M63I or GST-p12+hCBS for ~24 h before being treated overnight with either nocodazole (to arrest in mitosis) or aphidicolin (to block in interphase). GST-p12 protein complexes were precipitated from normalised cell lysates with glutathione-sepharose beads and analysed by SDS-PAGE followed by silver-staining or immunoblotting with anti-CLTC and anti-H2B antibodies. Bands corresponding to core histones in the silver-stained gel are starred. (D) Quantitation of H2B pulled-down with GST-p12 from mitotic versus interphase cell lysates. Median H2B band intensities from immunoblots in (C) were measured using a Li-cor Odyssey imaging system. The increase in H2B precipitation from mitotic cell lysates relative to interphase cell lysates are plotted in the bar chart (mean ± SEM, three biological replicates). (E) GST-p12 phosphorylation in mitosis and interphase. Normalised, interphase or mitotic 293T cell lysates expressing GST-tagged Mo-MLV p12_WT, M63I or S61A were incubated with glutathione-sepharose beads. Bound proteins were separated by SDS-PAGE and the gel was sequentially stained with ProQ diamond (PQ, specifically stains phosphorylated proteins) and Sypro ruby (SR, stains all proteins) dyes. Band intensities were measured using a ChemiDoc imaging system and the bar chart shows PQ/SR ratios, plotted as mean ± SD of 3 technical replicates.
Fig 6 GST-tagged Mo-MLV p12_M63I shows increased chromatin association and phosphorylation in mitosis. (A) A representative immunoblot showing subcellular distribution of GST-p12 mutants. GST-tagged GST-p12_M63I (lanes 1–3) or GST-p12+hCBS (lanes 4–6) were expressed in 293T cells for ~40 h. Cells were then subjected to biochemical fractionation and equivalent amounts of fractions S2-cytosolic, S3-soluble nuclear and P3-chromatin pellet were analysed by SDS-PAGE and immunoblotting with anti-p12, anti-HSP90 (cytosolic marker) and anti-H2B (chromatin marker) antibodies. (B) Representative confocal microscopy images showing GST-p12 localisation in HeLa cells stably transduced with constructs expressing GST-p12_M63I and GST-p12+hCBS. Cells were stained for p12 (anti-p12, green) and H2B (anti-H2B, red). Blue boxes indicate mitotic cells and red boxes show interphase cells. (C) Representative silver stained gel (top) and immunoblot (bottom) comparing the interaction of GST-p12_M63I and GST-p12+hCBS with mitotic and interphase chromatin. 293T cells were transiently-transfected with expression constructs for GST-tagged Mo-MLV p12_WT, M63I or GST-p12+hCBS for ~24 h before being treated overnight with either nocodazole (to arrest in mitosis) or aphidicolin (to block in interphase). GST-p12 protein complexes were precipitated from normalised cell lysates with glutathione-sepharose beads and analysed by SDS-PAGE followed by silver-staining or immunoblotting with anti-CLTC and anti-H2B antibodies. Bands corresponding to core histones in the silver-stained gel are starred. (D) Quantitation of H2B pulled-down with GST-p12 from mitotic versus interphase cell lysates. Median H2B band intensities from immunoblots in (C) were measured using a Li-cor Odyssey imaging system. The increase in H2B precipitation from mitotic cell lysates relative to interphase cell lysates are plotted in the bar chart (mean ± SEM, three biological replicates). (E) GST-p12 phosphorylation in mitosis and interphase. Normalised, interphase or mitotic 293T cell lysates expressing GST-tagged Mo-MLV p12_WT, M63I or S61A were incubated with glutathione-sepharose beads. Bound proteins were separated by SDS-PAGE and the gel was sequentially stained with ProQ diamond (PQ, specifically stains phosphorylated proteins) and Sypro ruby (SR, stains all proteins) dyes. Band intensities were measured using a ChemiDoc imaging system and the bar chart shows PQ/SR ratios, plotted as mean ± SD of 3 technical replicates.CC BY · PubMed Central
Fig 7 GST-tagged Mo-MLV p12_M63I has a higher affinity for chromatin when phosphorylated. (A and B) The effect of kinase inhibitors on p12 phosphorylation (A) and chromatin association (B). 293T cells transiently-expressing GST-p12_M63I were treated overnight with nocodazole, followed by a kinase inhibitor (LiCl, roscovitine (Ros) or kenpaullone (Ken)) for 3.5 h in the presence of both nocodazole and MG132, before lysis. Normalised cell lysates were incubated with glutathione-sepharose beads, bound proteins were separated by SDS-PAGE and gels were analysed either by sequential staining with ProQ diamond (PQ) and Sypro ruby (SR) dyes (A), or by silver-staining and immunoblotting with anti-CLTC and anti-H2B antibodies. PQ/SR ratios (A) and median H2B band intensities (B) are plotted in the bar charts as mean ± SD, of three technical replicates. (C) Mitotic chromatin association of GST-p12_M63I, S61 double mutants. 293T cells transiently-expressing GST-p12_M63I +/- an S61 mutation (S61A, S61D or S61E), were treated overnight with nocodazole and analysed as in (B). (D) Infectivity of Mo-MLV VLPs carrying alterations in p12. HeLa cells were challenged with equivalent RT units of LacZ-encoding VLPs carrying Mo-MLV p12_WT or M63I, +/- S61 mutations (S61A, S61D or S61E), and infectivity was measured 72 h post-infection by detection of beta-galactosidase activity in a chemiluminescent reporter assay. The data are plotted as percentage of WT VLP infectivity (mean ± SEM of >3 biological replicates).
Fig 7 GST-tagged Mo-MLV p12_M63I has a higher affinity for chromatin when phosphorylated. (A and B) The effect of kinase inhibitors on p12 phosphorylation (A) and chromatin association (B). 293T cells transiently-expressing GST-p12_M63I were treated overnight with nocodazole, followed by a kinase inhibitor (LiCl, roscovitine (Ros) or kenpaullone (Ken)) for 3.5 h in the presence of both nocodazole and MG132, before lysis. Normalised cell lysates were incubated with glutathione-sepharose beads, bound proteins were separated by SDS-PAGE and gels were analysed either by sequential staining with ProQ diamond (PQ) and Sypro ruby (SR) dyes (A), or by silver-staining and immunoblotting with anti-CLTC and anti-H2B antibodies. PQ/SR ratios (A) and median H2B band intensities (B) are plotted in the bar charts as mean ± SD, of three technical replicates. (C) Mitotic chromatin association of GST-p12_M63I, S61 double mutants. 293T cells transiently-expressing GST-p12_M63I +/- an S61 mutation (S61A, S61D or S61E), were treated overnight with nocodazole and analysed as in (B). (D) Infectivity of Mo-MLV VLPs carrying alterations in p12. HeLa cells were challenged with equivalent RT units of LacZ-encoding VLPs carrying Mo-MLV p12_WT or M63I, +/- S61 mutations (S61A, S61D or S61E), and infectivity was measured 72 h post-infection by detection of beta-galactosidase activity in a chemiluminescent reporter assay. The data are plotted as percentage of WT VLP infectivity (mean ± SEM of >3 biological replicates).CC BY · PubMed Central
Fig 8 GST-p12_M63I interacts with the same chromatin-associated proteins as PFV CBS. Cellular proteins interacting with GST-p12_M63I were identified using SILAC-MS. Two biological repeats (R1 and R2) were performed. GST-p12_M63I and GST-p12_WT were transiently expressed in 293T cells cultured in light (R0/K0) or medium (R6/K4) SILAC media respectively. Cells were treated with nocodazole for mitotic enrichment and then lysed for glutathione-sepharose bead pull-down assays followed by MS. (A) Identification of proteins enriched in the light-labelled GST-p12_M63I (L) sample relative to medium-labelled GST-p12_WT (M) sample. Log2(L/M) silac ratios of the set of MS hits (FDR <5%) from each replicate were plotted as a frequency distribution. Mean and standard deviation (SD) of each distribution was estimated by fitting to a normal distribution curve (R2≥0.91). MS hits with log2(L/M) ratios greater than 2.58 SDs from the mean were selected as significantly enriched in the GST-p12_M63I (L) sample. Of the 314 such proteins identified in R1, 68 were also found in R2 (Venn diagram). (B) Functional classification of the 68 GST-p12_M63I interacting proteins in (A) was performed based on InterPro domain annotation. (C) The abundance factor for each protein was calculated by dividing the peptide spectral count by its length. These values were then normalised across the group and the scores for R1 plotted against the scores for R2 (Pearson correlation r = 0.99). MS hits with normalised abundance factors ≥1 in both replicates are boxed in red (top panel) and expanded in the bottom panel. The points are coloured according to the protein function shown in the key: Blue, nucleosomal histone proteins; Red, chromobox homolog proteins; Green, chromosomal passenger complex proteins; Black, others. (D) Validation of SILAC results. 293T cells were transiently-transfected with expression constructs for GST-tagged Mo-MLV p12_WT (lane 1), p12_mut14 (lane 2), p12_M63I (lane 3), p12_M63I/mut14 (lane 4), p12+hCBS (lane 5) and p12+hCBS/mut14 (lane 6) and GST pull-down assays were performed and analysed as in Fig 6. Immunoblots (right hand panels) were probed with a selection of antibodies to host proteins of interest (S4 Table). Bands corresponding to core histones in the silver-stained gel are starred.
Fig 8 GST-p12_M63I interacts with the same chromatin-associated proteins as PFV CBS. Cellular proteins interacting with GST-p12_M63I were identified using SILAC-MS. Two biological repeats (R1 and R2) were performed. GST-p12_M63I and GST-p12_WT were transiently expressed in 293T cells cultured in light (R0/K0) or medium (R6/K4) SILAC media respectively. Cells were treated with nocodazole for mitotic enrichment and then lysed for glutathione-sepharose bead pull-down assays followed by MS. (A) Identification of proteins enriched in the light-labelled GST-p12_M63I (L) sample relative to medium-labelled GST-p12_WT (M) sample. Log2(L/M) silac ratios of the set of MS hits (FDR <5%) from each replicate were plotted as a frequency distribution. Mean and standard deviation (SD) of each distribution was estimated by fitting to a normal distribution curve (R2≥0.91). MS hits with log2(L/M) ratios greater than 2.58 SDs from the mean were selected as significantly enriched in the GST-p12_M63I (L) sample. Of the 314 such proteins identified in R1, 68 were also found in R2 (Venn diagram). (B) Functional classification of the 68 GST-p12_M63I interacting proteins in (A) was performed based on InterPro domain annotation. (C) The abundance factor for each protein was calculated by dividing the peptide spectral count by its length. These values were then normalised across the group and the scores for R1 plotted against the scores for R2 (Pearson correlation r = 0.99). MS hits with normalised abundance factors ≥1 in both replicates are boxed in red (top panel) and expanded in the bottom panel. The points are coloured according to the protein function shown in the key: Blue, nucleosomal histone proteins; Red, chromobox homolog proteins; Green, chromosomal passenger complex proteins; Black, others. (D) Validation of SILAC results. 293T cells were transiently-transfected with expression constructs for GST-tagged Mo-MLV p12_WT (lane 1), p12_mut14 (lane 2), p12_M63I (lane 3), p12_M63I/mut14 (lane 4), p12+hCBS (lane 5) and p12+hCBS/mut14 (lane 6) and GST pull-down assays were performed and analysed as in Fig 6. Immunoblots (right hand panels) were probed with a selection of antibodies to host proteins of interest (S4 Table). Bands corresponding to core histones in the silver-stained gel are starred.CC BY · PubMed Central
Fig 9 The p12 CTD directly binds recombinant nucleosomal arrays. Direct interactions between p12 CTD peptides and nucleosomal histone proteins was tested using biolayer interferometry (BIL). Streptavidin sensor probes were coated with biotinylated p12 CTD or hCBS (positive control) peptides to equivalent levels and then immersed in analyte solutions containing recombinant poly-nucleosomes to measure binding. (A) Representative sensorgrams showing binding of peptides corresponding to the CTD of Mo-MLV p12_M63I, phos p12-M63I (S61-phosphorylated), p12_M63I/R66A or hCBS to recombinant poly-nucleosomes (~250 nM). Black arrows indicate the beginning and end of the association phase. (B-D) Affinity measurements were derived by probing peptides corresponding to hCBS (B-D) or the CTD of Mo-MLV p12_M63I, phos p12-M63I (B), GaLV p12, FeLV p12 (C) or Mo-MLV p12_WT (D) against a range of serially-diluted nucleosomes. Equilibrium binding data from two technical replicates were pooled for the analysis. The plotted data are fractional saturation of binding as a function of nucleosome concentration. (E) Competition assay inhibiting nucleosome binding to immobilised biotin-tagged hCBS with soluble non-biotinylated hCBS or Mo-MLV p12 CTD peptides as indicated in key (100 μM). Left panel shows representative sensorgrams with black arrows indicating the beginning and end of the association phase. The bar chart shows equilibrium binding of hCBS in the presence and absence of competing peptides as mean ± SD from three technical replicates. (F) Representative sensorgrams showing competition assay inhibiting nucleosome binding to immobilised biotin-tagged p12 CTD peptides or hCBS, as indicated in graph title, with soluble non-biotinylated hCBS (100 μM, red lines). Black arrows indicate the beginning and end of the association phase. See methods for peptide sequences.
Fig 9 The p12 CTD directly binds recombinant nucleosomal arrays. Direct interactions between p12 CTD peptides and nucleosomal histone proteins was tested using biolayer interferometry (BIL). Streptavidin sensor probes were coated with biotinylated p12 CTD or hCBS (positive control) peptides to equivalent levels and then immersed in analyte solutions containing recombinant poly-nucleosomes to measure binding. (A) Representative sensorgrams showing binding of peptides corresponding to the CTD of Mo-MLV p12_M63I, phos p12-M63I (S61-phosphorylated), p12_M63I/R66A or hCBS to recombinant poly-nucleosomes (~250 nM). Black arrows indicate the beginning and end of the association phase. (B-D) Affinity measurements were derived by probing peptides corresponding to hCBS (B-D) or the CTD of Mo-MLV p12_M63I, phos p12-M63I (B), GaLV p12, FeLV p12 (C) or Mo-MLV p12_WT (D) against a range of serially-diluted nucleosomes. Equilibrium binding data from two technical replicates were pooled for the analysis. The plotted data are fractional saturation of binding as a function of nucleosome concentration. (E) Competition assay inhibiting nucleosome binding to immobilised biotin-tagged hCBS with soluble non-biotinylated hCBS or Mo-MLV p12 CTD peptides as indicated in key (100 μM). Left panel shows representative sensorgrams with black arrows indicating the beginning and end of the association phase. The bar chart shows equilibrium binding of hCBS in the presence and absence of competing peptides as mean ± SD from three technical replicates. (F) Representative sensorgrams showing competition assay inhibiting nucleosome binding to immobilised biotin-tagged p12 CTD peptides or hCBS, as indicated in graph title, with soluble non-biotinylated hCBS (100 μM, red lines). Black arrows indicate the beginning and end of the association phase. See methods for peptide sequences.CC BY · PubMed Central
Fig 10 Models for p12-chromatin binding. (A) Proposed model for the different functions of p12. The p12 region of Gag and p12 protein in the viral PIC differ in their affinity for cellular proteins and chromatin. We propose that as part of Gag, or when expressed as a recombinant GST-fusion protein, p12 exists in an unstructured conformation with low affinity for nucleosomes but relatively high affinity for host proteins such as clathrin and NEDD4-like E3 ligases which facilitate late replication events. Following Gag cleavage, the binding of the p12 NTD to the CA lattice promotes a change in the conformation of p12 which increases the affinity of the p12 CTD for nucleosomes. During mitosis, the breakdown of the nuclear envelope allows the p12/CA-containing PIC to access chromatin. The PIC is targeted to nucleosomes on mitotic chromatin by CA-bound, phosphorylated p12. Exit from mitosis promotes the de-phosphorylation of p12 and the dissociation of p12 and CA from chromatin. BET proteins can then bind IN and direct the viral cDNA to gene promoter regions where integration occurs. (B) Proposed relationship between virus infectivity and affinity of p12 for chromatin. We suggest that the affinity of p12 for chromatin is fine-tuned for optimal infectivity with deviations incurring a fitness cost. Mutations in p12 that increase or decrease chromatin binding (measured, in blue, or extrapolated, in red) alter viral infectivity as shown on the left. Only interactions above an arbitrary threshold can be detected by GST-pull down assays.
Fig 10 Models for p12-chromatin binding. (A) Proposed model for the different functions of p12. The p12 region of Gag and p12 protein in the viral PIC differ in their affinity for cellular proteins and chromatin. We propose that as part of Gag, or when expressed as a recombinant GST-fusion protein, p12 exists in an unstructured conformation with low affinity for nucleosomes but relatively high affinity for host proteins such as clathrin and NEDD4-like E3 ligases which facilitate late replication events. Following Gag cleavage, the binding of the p12 NTD to the CA lattice promotes a change in the conformation of p12 which increases the affinity of the p12 CTD for nucleosomes. During mitosis, the breakdown of the nuclear envelope allows the p12/CA-containing PIC to access chromatin. The PIC is targeted to nucleosomes on mitotic chromatin by CA-bound, phosphorylated p12. Exit from mitosis promotes the de-phosphorylation of p12 and the dissociation of p12 and CA from chromatin. BET proteins can then bind IN and direct the viral cDNA to gene promoter regions where integration occurs. (B) Proposed relationship between virus infectivity and affinity of p12 for chromatin. We suggest that the affinity of p12 for chromatin is fine-tuned for optimal infectivity with deviations incurring a fitness cost. Mutations in p12 that increase or decrease chromatin binding (measured, in blue, or extrapolated, in red) alter viral infectivity as shown on the left. Only interactions above an arbitrary threshold can be detected by GST-pull down assays.CC BY · PubMed Central

Verification

Claims the paper makes

The claims and statistics of this paper haven’t been checked yet.

Free: it reads the open-access text and checks the first 5 claims that cite a source we can check. Create a free account to check every claim.

A few free checks a day · papers already verified open instantly · results are public

Claims other papers make about this one

Each is checked against this paper’s own text: does it say what the citing paper says it does?

Self-check

Percentages, sums and reported differences re-computed from the paper’s own numbers.

The self-check needs the paper’s full text.

Citations

Cites

Show all 54 references

Cited by

Metadata

Authors
Wanaguru, M., Barry, D. J., Benton, D. J., O’Reilly, N. J., & Bishop, K. N.
Affiliations
The Francis Crick Institute (GB)
Corresponding author
Bishop, Kate N.
Venue
PLOS Pathogens
Published
2018-06-15
Volume
14
Issue
6
Pages
e1007117
ISSN
  • 1553-7366 (ISSN-L)
  • 1553-7374
OpenAlex
W2807878793
Cited by
27
References
54
Citations by year
2026: 1 · 2025: 2 · 2024: 2 · 2023: 2 · 2022: 6 · 2021: 7 · 2020: 4 · 2019: 2
FWCI
1.70
Type
journal article
Language
en
Open access
Locations
  • PLoS Pathogens (publishedVersion, cc-by)
  • Europe PMC (PubMed Central) (publishedVersion, cc-by)
  • PubMed Central (publishedVersion, cc-by)
  • PubMed (publishedVersion)
  • DOAJ (DOAJ: Directory of Open Access Journals) (submittedVersion, cc-by-sa)
  • Figshare (submittedVersion, cc-by)
Funders
The Francis Crick Institute (FC001042)
Topics
  • Life Sciences › Immunology and Microbiology › Virology › HIV Research and Treatment
  • Life Sciences › Immunology and Microbiology › Immunology › T-cell and Retrovirus Studies
  • Life Sciences › Biochemistry, Genetics and Molecular Biology › Genetics › Virus-based gene therapy research
Keywords
murine leukemia virus, p12, preintegration complex, chromatin tethering, nucleosome binding, mitotic chromatin, capsid protein, histone binding, C-terminal domain, phosphorylation, retroviral integration, CPSF6, HIV-1
MeSH terms
Animals, Capsid, Chromatin, Gene Expression Regulation, HeLa Cells, Histones, Humans, Mitosis, Mutation, Nucleosomes, Protein Binding, Virion, Virus Replication, Gene Products, gag, Virus Integration, Virus Assembly, Mice

About these checks

Registry, retraction, Cites and statistics results are computed, not judged, with one exception: a printed reference that no index lists is read once by a model before it counts as a citation error. Claims are extracted by a model and kept only when their quote appears verbatim in the text; each cited source is then checked, with a model’s help, for whether it says what the claim relies on. Those verdicts can be wrong — read the claim’s quote and the cited source before relying on one.

Statistics and arithmetic are recomputed, not judged.

Confidence bands are shown only for fields calibrated on our annotated test set. None is calibrated yet, so no band is shown.

What counts as a claim ›How we measure confidence ›How we check this ›

Are you an author, or do you see a problem with this page? Request a review

Data sources

Bibliographic data: Semantic Scholar, OpenAlex, Crossref.

Contains information from the Semantic Scholar Academic Graph Datasets, made available under the ODC Attribution License (ODC-BY 1.0).

Semantic Scholar’s data is described in: Kinney, R., et al. (2023). The Semantic Scholar Open Data Platform. arXiv:2301.10140.