

The DOI matches its Crossref record; 58 of the 58 references it cites were found in a registry or an index.
Updating Beliefs under Perceived Threat
Open accessAbstract
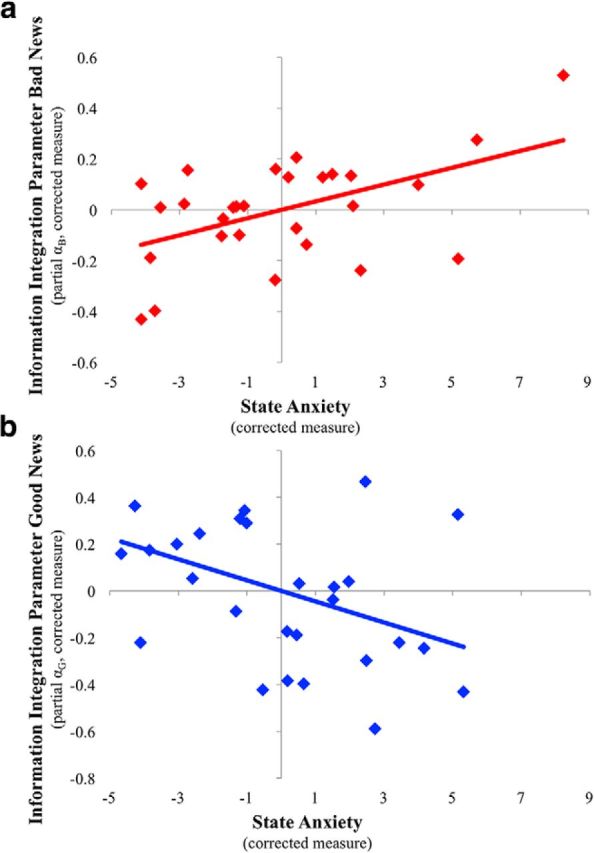
Humans are better at integrating desirable information into their beliefs than undesirable information. This asymmetry poses an evolutionary puzzle, as it can lead to an underestimation of risk and thus failure to take precautionary action. Here, we suggest a mechanism that can speak to this conundrum. In particular, we show that the bias vanishes in response to perceived threat in the environment. We report that an improvement in participants9 tendency to incorporate bad news into their beliefs is associated with physiological arousal in response to threat indexed by galvanic skin response and self-reported anxiety. This pattern of results was observed in a controlled laboratory setting (Experiment I), where perceived threat was manipulated, and in firefighters on duty (Experiment II), where it naturally varied. Such flexibility in how individuals integrate information may enhance the likelihood of responding to warnings with caution in environments rife with threat, while maintaining a positivity bias otherwise, a strategy that can increase well-being. SIGNIFICANCE STATEMENT The human tendency to be overly optimistic has mystified scholars and lay people for decades: How could biased beliefs have been selected over unbiased beliefs? Scholars have suggested that although the optimism bias can lead to negative outcomes, including financial collapse and war, it can also facilitate health and productivity. Here, we demonstrate that a mechanism generating the optimism bias, namely asymmetric information integration, evaporates under threat. Such flexibility could result in enhanced caution in dangerous environments while supporting an optimism bias otherwise, potentially increasing well-being.
Overview
The claims and statistics of this paper haven’t been checked yet.
Run the check — free, no account needed. It reads the open-access text and checks the sources it cites.
Integrity signals
Registry
Cites
Statistics
Figures
Verification
Claims the paper makes
The claims and statistics of this paper haven’t been checked yet.
Run the check — free, no account needed. It reads the open-access text and checks the sources it cites.
Claims other papers make about this one
Each is checked against this paper’s own text: does it say what the citing paper says it does?
The cited source says what the claim attributes to it.
In the citing paper
“This mech anism, also known as optimism bias, disappears when subjects perceive a threatening environment (Garrett et al., 2018).”
From Predictive coding in neuropsychiatric disorders: a systematic transdiagnostic review. (2025) · cites this paper as Garrett et al., 2018
Self-check
Percentages, sums and reported differences re-computed from the paper’s own numbers.
The self-check needs the paper’s full text.
Citations
Cites
Reinforcement Learning: An Introduction
Sutton, R. S., & Barto, A. G. (1998) · IEEE Transactions on Neural Networks · doi:10.1109/tnn.1998.712192 · Cited by 27,225
Reinforcement Learning: An Introduction
Sutton, R. S., & Barto, A. (2005) · IEEE Transactions on Neural Networks · doi:10.1109/tnn.2004.842673 · Cited by 25,268
A neural substrate of prediction and reward
Schultz, W., Dayan, P., & Montague, P. R. (1997) · Science · doi:10.1126/science.275.5306.1593 · Cited by 9,388
Human agency in social cognitive theory.
Bandura, A. (1989) · American Psychologist · doi:10.1037/0003-066x.44.9.1175 · Cited by 8,263
Influence of life stress on depression: moderation by a polymorphism in the 5-HTT gene
Caspi, A., Sugden, K., Moffitt, T. E., Taylor, A., Craig, I. W., Harrington, H., McClay, J., Mill, J., Martin, J., Braithwaite, A., et al. (2003) · Science · doi:10.1126/science.1083968 · Cited by 8,120
Illusion and well‐being: A social psychological perspective on mental health
Taylor, S. E., & Brown, J. D. (1988) · Psychological Bulletin · doi:10.1037/0033-2909.103.2.193 · Cited by 7,814
Marteau, T. M., & Bekker, H. (1992) · British Journal of Clinical Psychology · doi:10.1111/j.2044-8260.1992.tb00997.x · Cited by 3,238
The neurobiology of stress and development.
Gunnar, M., & Quevedo, K. (2007) · Annual Review of Psychology · doi:10.1146/annurev.psych.58.110405.085605 · Cited by 2,011 · cited 2×
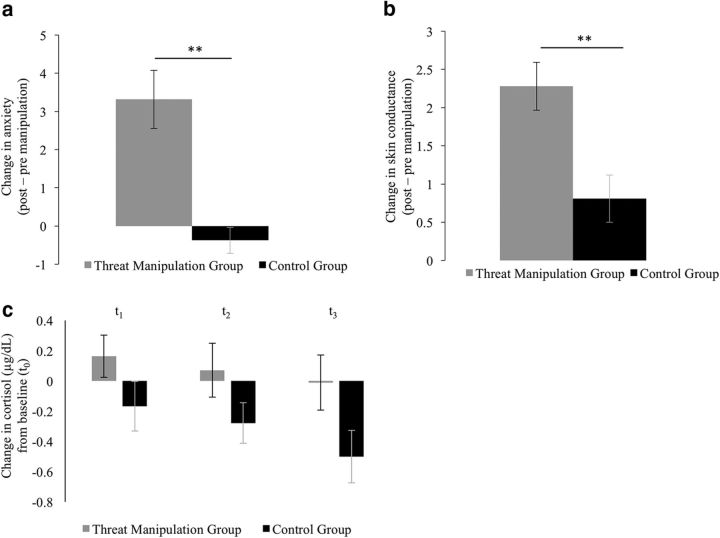
“Change in cortisol, which is suggested to reflect the HPA axis component of the stress response (Gunnar and Quevedo, 2007), did not relate to information integration for bad news (F(1,16) 0.”
BackgroundInfluentialBy Carrot or by Stick: Cognitive Reinforcement Learning in Parkinsonism
Frank, M. J., Seeberger, L. C., & O'Reilly, R. C. (2004) · Science · doi:10.1126/science.1102941 · Cited by 1,964
Bechara, A., Tranel, D., Damasio, H., & Damasio, A. R. (1996) · Cerebral Cortex · doi:10.1093/cercor/6.2.215 · Cited by 1,179
Cognitive bias and affective state
Harding, E. J., Paul, E. S., & Mendl, M. (2004) · Nature · doi:10.1038/427312a · Cited by 835
How unrealistic optimism is maintained in the face of reality
Sharot, T., Korn, C. W., & Dolan, R. J. (2011) · Nature Neuroscience · doi:10.1038/nn.2949 · Cited by 729
Diagnostic and Statistical Manual of Mental Disorders (DSM)
Leigh, H. (2017) · Springer eBooks · doi:10.1007/978-3-319-56782-2_9129-1 · Cited by 706
The Good News-Bad News Effect: Asymmetric Processing of Objective Information about Yourself
Eil, D., & Rao, J. M. (2011) · American Economic Journal Microeconomics · doi:10.1257/mic.3.2.114 · Cited by 681
The evolution of overconfidence
JOHNSON, D. D. P., & Fowler, J. H. (2011) · Nature · doi:10.1038/nature10384 · Cited by 649
Cognitive Mechanisms of Treatment in Depression
Roiser, J. P., Elliott, R., & Sahakian, B. J. (2012) · Neuropsychopharmacology · doi:10.1038/npp.2011.183 · Cited by 535
On the self-erasing nature of errors of prediction.
Sherman, S. J. (1980) · Journal of Personality and Social Psychology · doi:10.1037/0022-3514.39.2.211 · Cited by 525
Working-memory capacity protects model-based learning from stress
Otto, A. R., Raio, C. M., Chiang, A., Phelps, E. A., & Daw, N. D. (2013) · Proceedings of the National Academy of Sciences · doi:10.1073/pnas.1312011110 · Cited by 490
McKay, R. T., & Dennett, D. C. (2009) · Behavioral and Brain Sciences · doi:10.1017/s0140525x09990975 · Cited by 474
Forming beliefs: Why valence matters
Sharot, T., & Garrett, N. (2016) · Trends in Cognitive Sciences · doi:10.1016/j.tics.2015.11.002 · Cited by 345
Korn, C. W., Sharot, T., Walter, H., Heekeren, H. R., & Dolan, R. J. (2014) · Psychological Medicine · doi:10.1017/s0033291713001074 · Cited by 334
Severe stress switches CRF action in the nucleus accumbens from appetitive to aversive
Lemos, J. C., Wanat, M. J., Smith, J. S., Reyes, B. A. S., Hollon, N. G., Bockstaele, E. J. V., Chavkin, C., & Phillips, P. E. M. (2012) · Nature · doi:10.1038/nature11436 · Cited by 319
Behavioural and neural characterization of optimistic reinforcement learning
Lefebvre, G., Lebreton, M. P., Meyniel, F., Bourgeois‐Gironde, S., & Palminteri, S. (2017) · Nature Human Behaviour · doi:10.1038/s41562-017-0067 · Cited by 314
Depressive symptoms are associated with unrealistic negative predictions of future life events
Strunk, D. R., Lopez, H., & DeRubeis, R. J. (2006) · Behaviour Research and Therapy · doi:10.1016/j.brat.2005.07.001 · Cited by 307
The Trier Social Stress Test protocol for inducing psychological stress.
Birkett, M. (2011) · Journal of Visualized Experiments · doi:10.3791/3238 · Cited by 285
Using skin conductance in judgment and decision making research
Figner, B., Murphy, R. O., Schulte-Mecklenbeck, M., Kühberger, A., & Ranyard, R. (2011) · UvA-DARE (University of Amsterdam) · Cited by 274
Matheson, S. M., Asher, L., & Melissa Bateson, B. (2007) · Applied Animal Behaviour Science · doi:10.1016/j.applanim.2007.03.007 · Cited by 248
Tiger, L. (1979) · DigitalGeorgetown (Georgetown University Library) · Cited by 234
Managing Self-Confidence: Theory and Experimental Evidence
Möbius, M., Niederle, M., Niehaus, P., & Rosenblat, T. (2011) · National Bureau of Economic Research · doi:10.3386/w17014 · Cited by 230
How Dopamine Enhances an Optimism Bias in Humans
Sharot, T., Guitart‐Masip, M., Korn, C. W., Chowdhury, R., & Dolan, R. J. (2012) · Current Biology · doi:10.1016/j.cub.2012.05.053 · Cited by 227
Stress potentiates decision biases: A stress induced deliberation-to-intuition (SIDI) model
Yu, R. (2016) · Neurobiology of Stress · doi:10.1016/j.ynstr.2015.12.006 · Cited by 227
How Do College Students Respond to Public Information about Earnings?
Wiswall, M., & Zafar, B. (2015) · Journal of Human Capital · doi:10.1086/681542 · Cited by 227
Positively Biased Processing of Self-Relevant Social Feedback
Korn, C. W., Prehn, K., Park, S. Q., Walter, H., & Heekeren, H. R. (2012) · Journal of Neuroscience · doi:10.1523/jneurosci.3016-12.2012 · Cited by 206
Stress alters personal moral decision making
Youssef, F. F., Dookeeram, K., Basdeo, V., Francis, E., Doman, M., Mamed, D., Maloo, S., Degannes, J., Dobo, L., Ditshotlo, P., et al. (2011) · Psychoneuroendocrinology · doi:10.1016/j.psyneuen.2011.07.017 · Cited by 195
Selectively altering belief formation in the human brain
Sharot, T., Ryota Kanai, C., Marston, D., Korn, C. W., Rees, G. E., & Dolan, R. J. (2012) · Proceedings of the National Academy of Sciences · doi:10.1073/pnas.1205828109 · Cited by 193
Losing the rose tinted glasses: neural substrates of unbiased belief updating in depression
Garrett, N., Sharot, T., Faulkner, P., Korn, C. W., Roiser, J. P., & Dolan, R. J. (2014) · Frontiers in Human Neuroscience · doi:10.3389/fnhum.2014.00639 · Cited by 174 · cited 10×
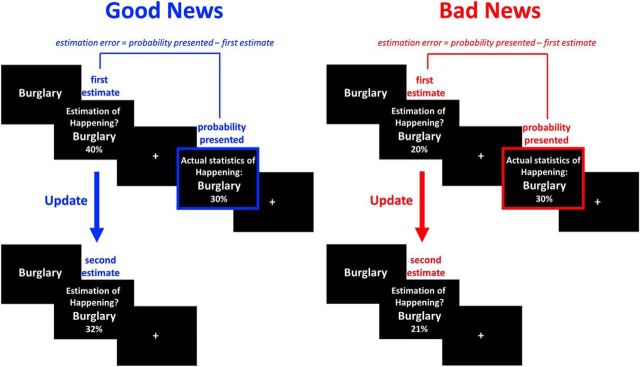
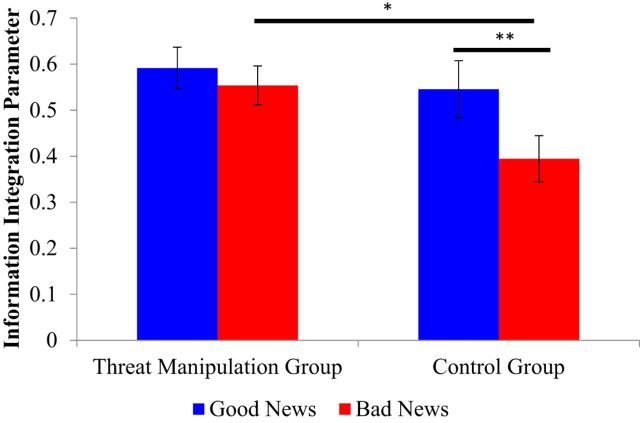
“Threat eliminates asymmetric information integration Our results show that the acute threat manipulation eliminated the well established asymmetry in information integration (Sharot et al., 2011; Moutsiana et al., 2013; Garrett et al., 2014).”
BackgroundMethodResultInfluentialTrait Pessimism Predicts Vulnerability to Stress-Induced Anhedonia in Rats
Ryguła, R., Hinchcliffe, J. K., & Popik, P. (2013) · Neuropsychopharmacology · doi:10.1038/npp.2013.116 · Cited by 131
Optimistic update bias holds firm: three tests of robustness following Shah et al
Garrett, N., & Sharot, T. (2017) · Consciousness and Cognition · doi:10.1016/j.concog.2016.10.013 · Cited by 123 · cited 3×
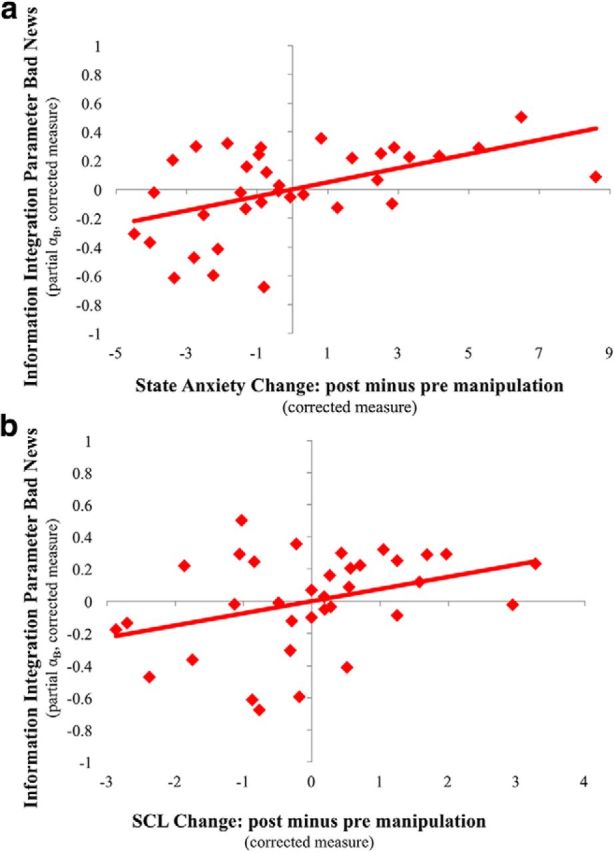
“…self-reported anxiety significantly explained the variance in information integration parameters for bad news, B (F(1,22) 10.52, p 0.004, p 2 0.32, bi 0.05; Table 4), an effect that remained significant if estimation errors are also controlled for (F(1,21) 9.79, p 0.005; Garrett and Sharot, 2017).”
BackgroundInfluentialSelf-citationStress modulates reinforcement learning in younger and older adults.
Lighthall, N. R., Gorlick, M. A., Schoeke, A., Frank, M. J., & Mather, M. (2012) · Psychology and Aging · doi:10.1037/a0029823 · Cited by 119
Human development of the ability to learn from bad news
Moutsiana, C., Garrett, N., Clarke, R. C., Lotto, R. B., Blakemore, S.-J., & Sharot, T. (2013) · Proceedings of the National Academy of Sciences · doi:10.1073/pnas.1305631110 · Cited by 119
Age-dependent diet choice in an avian top predator
Rutz, C., Whittingham, M. J., & Newton, I. (2005) · Proceedings of the Royal Society B Biological Sciences · doi:10.1098/rspb.2005.3353 · Cited by 119
Chlan, L. L., Savik, K., & Weinert, C. (2003) · Journal of Nursing Measurement · doi:10.1891/jnum.11.3.283.61269 · Cited by 116
Managing Self-Confidence: Theory and Experimental EvidencePreprint
Möbius, M., Niederle, M., Niehaus, P., & Rosenblat, T. (2013) · SSRN Electronic Journal · doi:10.2139/ssrn.2285056 · Cited by 114
Optimistic update bias increases in older age
Chowdhury, R., Sharot, T., Wolfe, T., Düzel, E., & Dolan, R. J. (2013) · Psychological Medicine · doi:10.1017/s0033291713002602 · Cited by 111
The role of the neural reward circuitry in self-referential optimistic belief updates
Kuzmanovic, B., Jefferson, A., & Vogeley, K. T. (2016) · NeuroImage · doi:10.1016/j.neuroimage.2016.02.014 · Cited by 102
Stress increases aversive prediction error signal in the ventral striatum
Robinson, O. J., Overstreet, C. M., Charney, D. R., Vytal, K. E., & Grillon, C. (2013) · Proceedings of the National Academy of Sciences · doi:10.1073/pnas.1213923110 · Cited by 97
Social stress reactivity alters reward and punishment learning
Cavanagh, J. F., Frank, M. J., & Allen, J. J. B. (2010) · Social Cognitive and Affective Neuroscience · doi:10.1093/scan/nsq041 · Cited by 97
Chronic and Acute Stress Promote Overexploitation in Serial Decision Making
Lenow, J. K., Constantino, S. M., Daw, N. D., & Phelps, E. A. (2017) · Journal of Neuroscience · doi:10.1523/jneurosci.3618-16.2017 · Cited by 94
Self‐specific Optimism Bias in Belief Updating Is Associated with High Trait Optimism
Kuzmanovic, B., Jefferson, A., & Vogeley, K. T. (2014) · Journal of Behavioral Decision Making · doi:10.1002/bdm.1849 · Cited by 87
Human Frontal–Subcortical Circuit and Asymmetric Belief Updating
Moutsiana, C., Charpentier, C. J., Garrett, N., Cohen, M. X., & Sharot, T. (2015) · Journal of Neuroscience · doi:10.1523/jneurosci.1120-15.2015 · Cited by 78
Adaptive learning of host preference in a herbivorous arthropod
Egas, M., & Sabelis, M. W. (2001) · Ecology Letters · doi:10.1046/j.1461-0248.2001.00219.x · Cited by 74
Valence-Dependent Belief Updating: Computational Validation
Kuzmanovic, B., & Rigoux, L. (2017) · Frontiers in Psychology · doi:10.3389/fpsyg.2017.01087 · Cited by 68
How Psychological Pitfalls Generated the Global Financial CrisisPreprint
Shefrin, H. (2009) · SSRN Electronic Journal · doi:10.4324/9781315780931-29 · Cited by 61
The Glass is Half-Full: Overestimating the Quality of a Novel Environment is Advantageous
Berger‐Tal, O., & Avgar, T. (2012) · PLoS ONE · doi:10.1371/journal.pone.0034578 · Cited by 57
How Robust Is the Optimistic Update Bias for Estimating Self-Risk and Population Base Rates?
Garrett, N., & Sharot, T. (2014) · PLoS ONE · doi:10.1371/journal.pone.0098848 · Cited by 51
Concern for Others Leads to Vicarious Optimism
Kappes, A., Faber, N. S., Kahane, G., Savulescu, J., & Crockett, M. J. (2018) · Psychological Science · doi:10.1177/0956797617737129 · Cited by 45
The effect of stress on salivary cortisol in panic disorder patients
Stones, A., Groóme, D., Perry, D., Hucklebridge, F. H., & Evans, P. (1999) · Journal of Affective Disorders · doi:10.1016/s0165-0327(98)00058-5 · Cited by 39
Concern for Others Leads to Vicarious OptimismPreprint
Kappes, A., Crockett, M. J., Faber, N. S., Savulescu, J., & Kahane, G. (2018) · doi:10.31234/osf.io/na9db · Cited by 20
Cited by
Sorted by citations
When Beliefs Face Reality: An Integrative Review of Belief Updating in Mental Health and Illness
Κube, T., & Rozenkrantz, L. (2020) · Perspectives on Psychological Science · doi:10.1177/1745691620931496 · Cited by 165
Fatalism, Beliefs, and Behaviors During the COVID-19 Pandemic
Akesson, J., Ashworth-Hayes, S., Hahn, R. W., Metcalfe, R., & Rasooly, I. (2020) · National Bureau of Economic Research · doi:10.3386/w27245 · Cited by 103
Inattentive responding can induce spurious associations between task behaviour and symptom measures
Zorowitz, S., Solis, J., Niv, Y., & Bennett, D. (2023) · Nature Human Behaviour · doi:10.1038/s41562-023-01640-7 · Cited by 107
Fatalism, beliefs, and behaviors during the COVID-19 pandemic
Akesson, J., Ashworth-Hayes, S., Hahn, R. W., Metcalfe, R., & Rasooly, I. (2022) · Journal of Risk and Uncertainty · doi:10.1007/s11166-022-09375-y · Cited by 94
Rethinking post-traumatic stress disorder – A predictive processing perspective
Κube, T., Berg, M., Kleim, B., & Herzog, P. (2020) · Neuroscience & Biobehavioral Reviews · doi:10.1016/j.neubiorev.2020.04.014 · Cited by 107
Metadata
- Authors
- Garrett, N., González-Garzón, A. M., Foulkes, L., Levita, L., & Sharot, T.
- Affiliations
- Princeton University (US)
- University College London (GB)
- University of Sheffield (GB)
- Corresponding author
- Garrett, Neil
- Sharot, Tali
- Venue
- The Journal of Neuroscience
- Publisher
- Society for Neuroscience
- Published
- 2018-08-06
- Volume
- 38
- Issue
- 36
- Pages
- 7901-7911
- ISSN
- 0270-6474 (ISSN-L)
- 1529-2401
- PMC
- PMC6125815
- OpenAlex
- W2885599406
- Cited by
- 109
- References
- 58
- Citations by year
- 2026: 14 · 2025: 16 · 2024: 13 · 2023: 14 · 2022: 17 · 2021: 12 · 2020: 17 · 2019: 6
- FWCI
- 7.31
- Type
- journal article
- Language
- en
- Open access
- hybrid
- doi.org
- Licence
- cc-by
- Locations
- Journal of Neuroscience (publishedVersion, cc-by)
- SSRN Electronic Journal (publishedVersion)
- Europe PMC (PubMed Central) (publishedVersion, cc-by)
- PubMed Central (publishedVersion, cc-by)
- PubMed (publishedVersion)
- White Rose Research Online (University of Leeds, The University of Sheffield, University of York) (acceptedVersion)
- UEA Digital Repository (University of East Anglia) (submittedVersion)
- UCL Discovery (University College London) (submittedVersion)
- Funders
- Wellcome Trust
- Topics
- Social Sciences › Decision Sciences › General Decision Sciences › Decision-Making and Behavioral Economics
- Life Sciences › Neuroscience › Cognitive Neuroscience › Neural and Behavioral Psychology Studies
- Social Sciences › Psychology › Applied Psychology › Optimism, Hope, and Well-being
- Keywords
- optimism bias, positivity bias, threat perception, risk underestimation, skin conductance, physiological arousal, anxiety, firefighters, belief updating, precautionary behavior
- MeSH terms
- Optimism, Adult, Anxiety, Arousal, Female, Galvanic Skin Response, Humans, Male, Stress, Psychological, Young Adult
About these checks
Registry, retraction, Cites and statistics results are computed, not judged, with one exception: a printed reference that no index lists is read once by a model before it counts as a citation error. Claims are extracted by a model and kept only when their quote appears verbatim in the text; each cited source is then checked, with a model’s help, for whether it says what the claim relies on. Those verdicts can be wrong — read the claim’s quote and the cited source before relying on one.
Statistics and arithmetic are recomputed, not judged.
Confidence bands are shown only for fields calibrated on our annotated test set. None is calibrated yet, so no band is shown.
What counts as a claim ›How we measure confidence ›How we check this ›
Are you an author, or do you see a problem with this page? Request a review
