Cited by 341Parkinson's Disease Mechanisms and TreatmentsNeuroinflammation and Neurodegeneration MechanismsAlzheimer's disease research and treatments

The DOI matches its Crossref record; 74 of the 75 references it cites were found in a registry or an index.

Human Astrocytes Transfer Aggregated Alpha-Synuclein via Tunneling Nanotubes

Open access

Abstract

Many lines of evidence suggest that the Parkinson's disease (PD)-related protein α-synuclein (α-SYN) can propagate from cell to cell in a prion-like manner. However, the cellular mechanisms behind the spreading remain elusive. Here, we show that human astrocytes derived from embryonic stem cells actively transfer aggregated α-SYN to nearby astrocytes via direct contact and tunneling nanotubes (TNTs). Failure in the astrocytes' lysosomal digestion of excess α-SYN oligomers results in α-SYN deposits in the trans-Golgi network followed by endoplasmic reticulum swelling and mitochondrial disturbances. The stressed astrocytes respond by conspicuously sending out TNTs, enabling intercellular transfer of α-SYN to healthy astrocytes, which in return deliver mitochondria, indicating a TNT-mediated rescue mechanism. Using a pharmacological approach to inhibit TNT formation, we abolished the transfer of both α-SYN and mitochondria. Together, our results highlight the role of astrocytes in α-SYN cell-to-cell transfer, identifying possible pathophysiological events in the PD brain that could be of therapeutic relevance. SIGNIFICANCE STATEMENT Astrocytes are the major cell type in the brain, yet their role in Parkinson's disease progression remains elusive. Here, we show that human astrocytes actively transfer aggregated α-synuclein (α-SYN) to healthy astrocytes via direct contact and tunneling nanotubes (TNTs), rather than degrade it. The astrocytes engulf large amounts of oligomeric α-SYN that are subsequently stored in the trans-Golgi network region. The accumulation of α-SYN in the astrocytes affects their lysosomal machinery and induces mitochondrial damage. The stressed astrocytes respond by sending out TNTs, enabling intercellular transfer of α-SYN to healthy astrocytes. Our findings highlight an unexpected role of astrocytes in the propagation of α-SYN pathology via TNTs, revealing astrocytes as a potential target for therapeutic intervention.

Overview

The claims and statistics of this paper haven’t been checked yet.

Run the check — free, no account needed. It reads the open-access text and checks the sources it cites.

A few free checks a day · papers already verified open instantly · results are public

Integrity signals

Registry

Crossref · 10.1523/jneurosci.0983-17.2017

Cites

74 of 74 references verified0 citation errors · 0 not checkable

Statistics

Figures

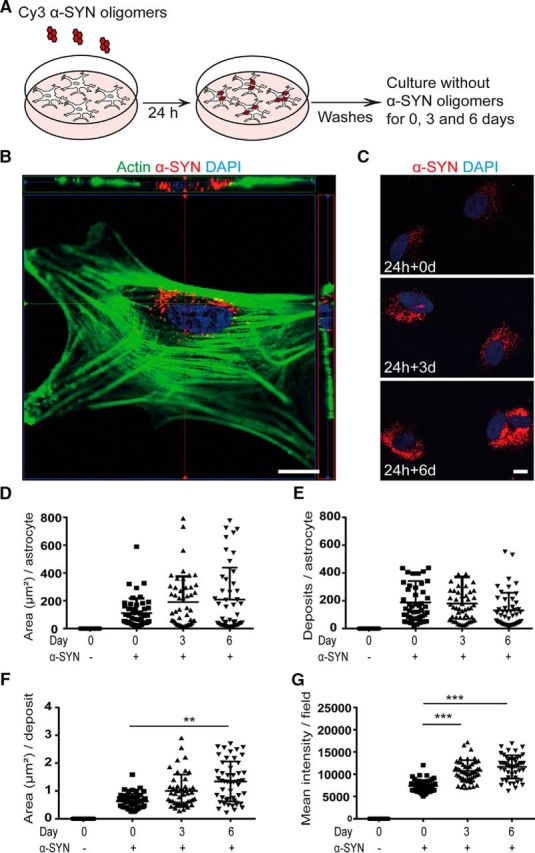
Figure 1. Intracellular α-SYN is stored rather than degraded. Human ESC-derived astrocytes (see Fig. 1-1A) were exposed to 0.5 μm Cy3-labeled α-SYN oligomers (see Fig. 1-1B) for 24 h, washed thoroughly, and cultured for an additional 0, 3, or 6 d in α-SYN-free medium before fixation (A). The intracellular location of the α-SYN-Cy3 after ingestion (see Fig. 1-2A) was confirmed with confocal imaging (B). Quantification of the α-SYN-Cy3 signal at days 0, 3, and 6 (C and Fig. 1-2B) reveled the total area of the α-SYN deposits per astrocyte in square millimeters (D), the number of α-SYN deposits per astrocyte (E), the mean area of the deposits in square millimeters (F), and the mean intensity of the intracellular α-SYN-Cy3 per field (G). Western blot analysis confirmed the presence of high-molecular-weight α-SYN species in the astrocytes at all three time points (Fig. 1-2C), demonstrating that only minimal degradation of the ingested oligomeric α-SYN occurred, whereas the monomeric α-SYN was completely degraded during the 6 d time period (see Fig. 1-3A, B). Scale bars: B, 10 μm; C, 20 μm. Data are presented as mean ± SD from four independent experiments and the levels of significance were set to *p < 0.05, **p < 0.01, and ***p < 0.001 (E–G).
Figure 1. Intracellular α-SYN is stored rather than degraded. Human ESC-derived astrocytes (see Fig. 1-1A) were exposed to 0.5 μm Cy3-labeled α-SYN oligomers (see Fig. 1-1B) for 24 h, washed thoroughly, and cultured for an additional 0, 3, or 6 d in α-SYN-free medium before fixation (A). The intracellular location of the α-SYN-Cy3 after ingestion (see Fig. 1-2A) was confirmed with confocal imaging (B). Quantification of the α-SYN-Cy3 signal at days 0, 3, and 6 (C and Fig. 1-2B) reveled the total area of the α-SYN deposits per astrocyte in square millimeters (D), the number of α-SYN deposits per astrocyte (E), the mean area of the deposits in square millimeters (F), and the mean intensity of the intracellular α-SYN-Cy3 per field (G). Western blot analysis confirmed the presence of high-molecular-weight α-SYN species in the astrocytes at all three time points (Fig. 1-2C), demonstrating that only minimal degradation of the ingested oligomeric α-SYN occurred, whereas the monomeric α-SYN was completely degraded during the 6 d time period (see Fig. 1-3A, B). Scale bars: B, 10 μm; C, 20 μm. Data are presented as mean ± SD from four independent experiments and the levels of significance were set to *p < 0.05, **p < 0.01, and ***p < 0.001 (E–G).CC BY · PubMed Central
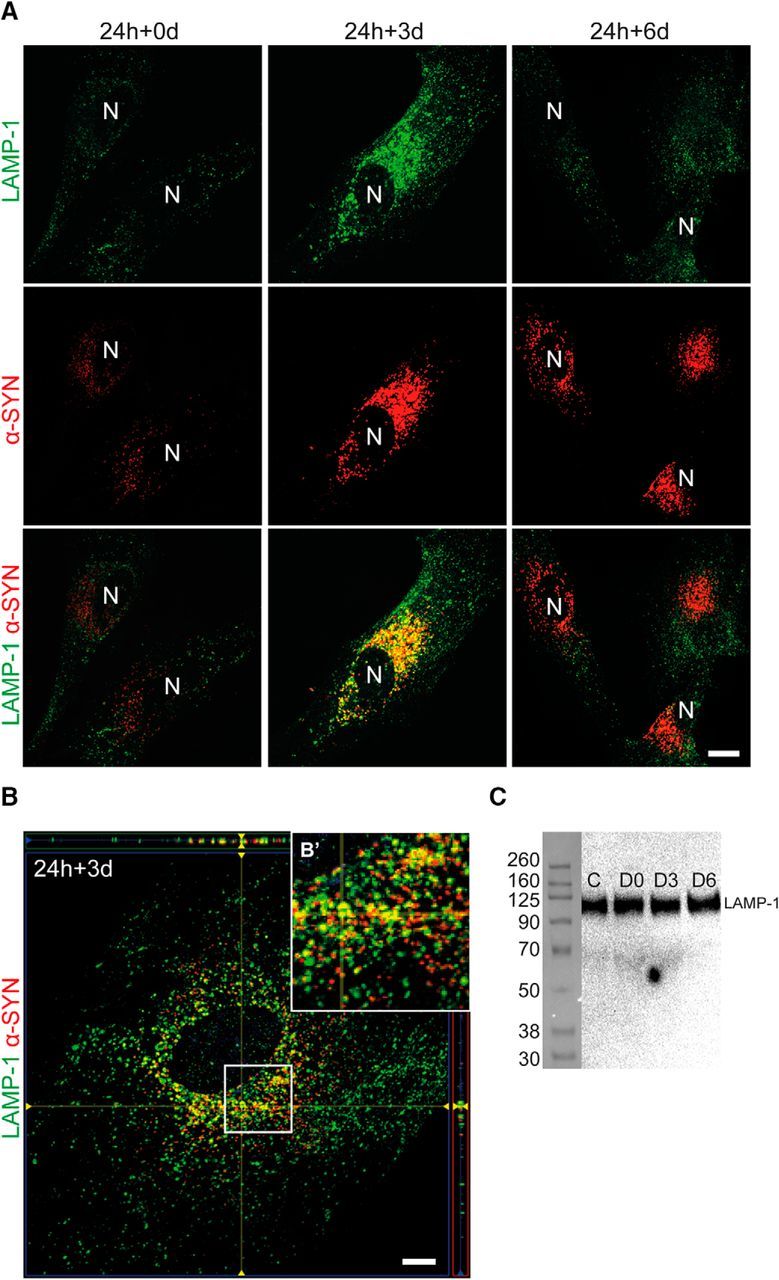
Figure 2. Ingested α-SYN only temporarily colocalizes with the lysosomal protein LAMP-1. Representative images of LAMP-1 staining from α-SYN oligomer-exposed astrocytes and control cells showed a pronounced colocalization of LAMP-1 and α-SYN at day 3 (24 h + 3 d). At day 6 (24 h + 6 d), the colocalization was lost, although the α-SYN deposits were not degraded (A, Fig. 2-1, and Fig. 2-2). N, Nucleus. Confocal imaging demonstrated clear colocalization of LAMP-1 and α-SYN at day 3 (24 h + 3 d) (B). A close-up of the white rectangle is shown in B′. Western blot analysis revealed no differences in LAMP-1 protein expression between the control and the α-SYN oligomer-exposed astrocytes (C). Scale bars: A, 20 μm; B, 10 μm.
Figure 2. Ingested α-SYN only temporarily colocalizes with the lysosomal protein LAMP-1. Representative images of LAMP-1 staining from α-SYN oligomer-exposed astrocytes and control cells showed a pronounced colocalization of LAMP-1 and α-SYN at day 3 (24 h + 3 d). At day 6 (24 h + 6 d), the colocalization was lost, although the α-SYN deposits were not degraded (A, Fig. 2-1, and Fig. 2-2). N, Nucleus. Confocal imaging demonstrated clear colocalization of LAMP-1 and α-SYN at day 3 (24 h + 3 d) (B). A close-up of the white rectangle is shown in B′. Western blot analysis revealed no differences in LAMP-1 protein expression between the control and the α-SYN oligomer-exposed astrocytes (C). Scale bars: A, 20 μm; B, 10 μm.CC BY · PubMed Central
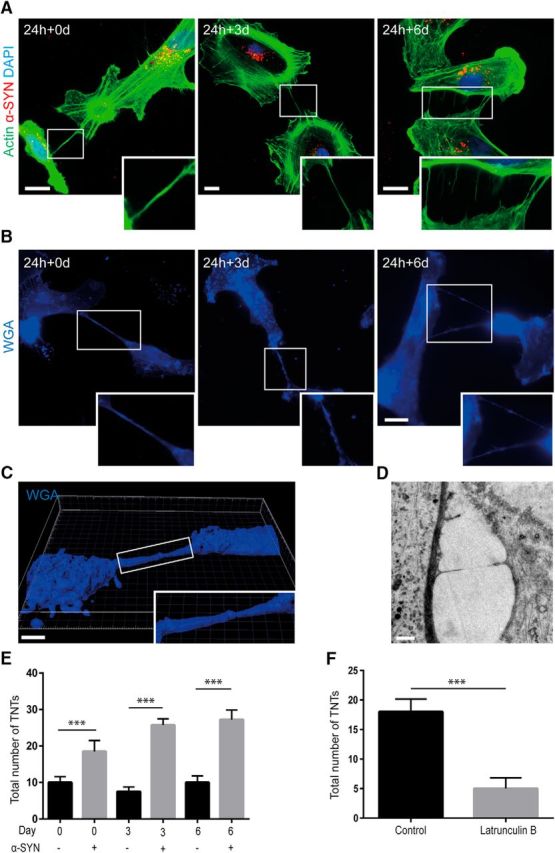
Figure 3. Accumulation of α-SYN oligomers induces TNT formation. F-actin labeling using phalloidin (A) and membrane staining using WGA (B) showed that TNTs were formed between the astrocytes at 0, 3, and 6 d (24 h + 0 d, 24 h + 3 d, and 24 h + 6 d) after α-SYN oligomer exposure. Confocal 3D imaging (C and Fig. 3-1A) and TEM analysis (D) confirmed the presence of TNTs. Quantification of the total number of TNTs in cultures treated with α-SYN oligomers or in parallel control cultures showed that the number of TNTs was increased significantly after α-SYN oligomer exposure at all time points. Moreover, the number of TNTs increased over time in the α-SYN oligomer-treated cultures (E). Latruculin B treatment reduced the number of TNTs significantly (F). Importantly, neither the high load of α-SYN oligomers nor the treatment with latrunculin B at the concentration and exposure time used induced any obvious toxicity or cell death, as indicated by TUNEL staining and the total cell number (Fig. 3-1B, C). Scale bars: A, B, 20 μm; C, 5 μm; D, 1 μm. Data are presented as mean ± SD from four independent experiments and the levels of significance were set to *p < 0.05, **p < 0.01, and ***p < 0.001 (E, F).
Figure 3. Accumulation of α-SYN oligomers induces TNT formation. F-actin labeling using phalloidin (A) and membrane staining using WGA (B) showed that TNTs were formed between the astrocytes at 0, 3, and 6 d (24 h + 0 d, 24 h + 3 d, and 24 h + 6 d) after α-SYN oligomer exposure. Confocal 3D imaging (C and Fig. 3-1A) and TEM analysis (D) confirmed the presence of TNTs. Quantification of the total number of TNTs in cultures treated with α-SYN oligomers or in parallel control cultures showed that the number of TNTs was increased significantly after α-SYN oligomer exposure at all time points. Moreover, the number of TNTs increased over time in the α-SYN oligomer-treated cultures (E). Latruculin B treatment reduced the number of TNTs significantly (F). Importantly, neither the high load of α-SYN oligomers nor the treatment with latrunculin B at the concentration and exposure time used induced any obvious toxicity or cell death, as indicated by TUNEL staining and the total cell number (Fig. 3-1B, C). Scale bars: A, B, 20 μm; C, 5 μm; D, 1 μm. Data are presented as mean ± SD from four independent experiments and the levels of significance were set to *p < 0.05, **p < 0.01, and ***p < 0.001 (E, F).CC BY · PubMed Central
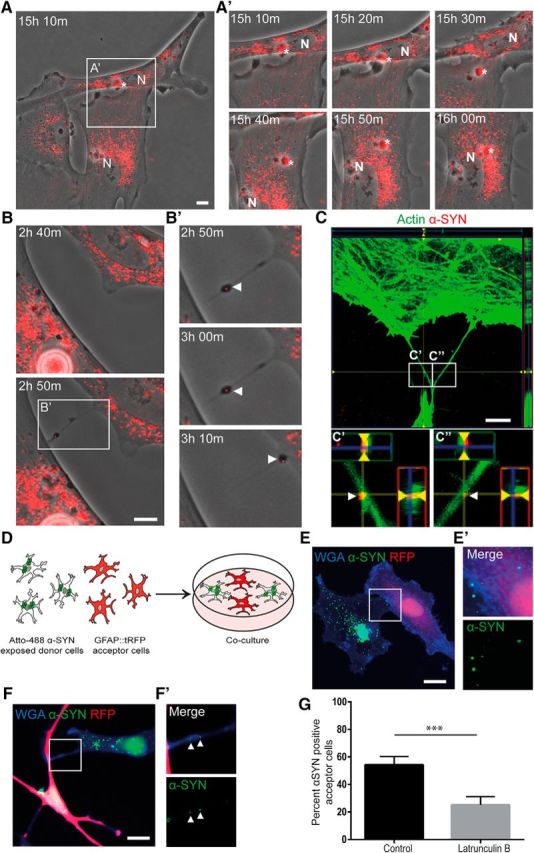
Figure 4. TNTs contribute to α-SYN transmission. Time-lapse experiments of α-SYN-Cy3 oligomer-exposed cultures showed that α-SYN was transported between the astrocytes in the culture via direct contact or via TNTs (see Fig. 4-1A). The different time points after α-SYN oligomer exposure are indicated. Direct transmission by membrane fusion of two astrocytes is shown in A. Close-ups of the cell-to-cell contact region (white rectangle) demonstrate transmission of an α-SYN aggregate (white star) from the top cell to the bottom cell (15 h 20 min to 15 h 30 m after 24 h of α-SYN oligomer exposure) (A′). The α-SYN is then relocated toward the cell nuclei (N). Transfer of α-SYN-Cy3 via TNTs is shown in B. The TNT formation was rather quick and took <10 min (2 h 40 min to 2 h 50 min) (B). Close-up imaging (white rectangle) over the after 20 min demonstrated clear TNT-mediated transfer of aggregated α-SYN (white arrowheads) (B′). Confocal microscopy confirmed the presence of α-SYN in actin-labeled TNTs (C and Fig. 4-1B), close-up of the white rectangles are shown in C′ and C″ (white arrowheads indicate α-SYN). Cocultures of unlabeled astrocytes exposed to Atto 488-labeled α-SYN oligomers and untreated GFAP::tRFP astrocytes (D and Fig. 4-2) demonstrated transfer of α-SYN to unaffected astrocytes via direct transfer (E) and TNTs (F). Close-ups of the cell-to-cell direct contact region and TNTs (white rectangles) are shown in E′ and F′, respectively (white arrowheads in F′ indicate α-SYN). Latruculin B treatment reduced the percentage of α-SYN+ acceptor cells significantly (G). Scale bars: A–C, 10 μm; E, F, 20 μm. Data are presented as mean ± SEM from three independent experiments and the levels of significance were set to *p < 0.05, **p < 0.01, and ***p < 0.001 (G).
Figure 4. TNTs contribute to α-SYN transmission. Time-lapse experiments of α-SYN-Cy3 oligomer-exposed cultures showed that α-SYN was transported between the astrocytes in the culture via direct contact or via TNTs (see Fig. 4-1A). The different time points after α-SYN oligomer exposure are indicated. Direct transmission by membrane fusion of two astrocytes is shown in A. Close-ups of the cell-to-cell contact region (white rectangle) demonstrate transmission of an α-SYN aggregate (white star) from the top cell to the bottom cell (15 h 20 min to 15 h 30 m after 24 h of α-SYN oligomer exposure) (A′). The α-SYN is then relocated toward the cell nuclei (N). Transfer of α-SYN-Cy3 via TNTs is shown in B. The TNT formation was rather quick and took <10 min (2 h 40 min to 2 h 50 min) (B). Close-up imaging (white rectangle) over the after 20 min demonstrated clear TNT-mediated transfer of aggregated α-SYN (white arrowheads) (B′). Confocal microscopy confirmed the presence of α-SYN in actin-labeled TNTs (C and Fig. 4-1B), close-up of the white rectangles are shown in C′ and C″ (white arrowheads indicate α-SYN). Cocultures of unlabeled astrocytes exposed to Atto 488-labeled α-SYN oligomers and untreated GFAP::tRFP astrocytes (D and Fig. 4-2) demonstrated transfer of α-SYN to unaffected astrocytes via direct transfer (E) and TNTs (F). Close-ups of the cell-to-cell direct contact region and TNTs (white rectangles) are shown in E′ and F′, respectively (white arrowheads in F′ indicate α-SYN). Latruculin B treatment reduced the percentage of α-SYN+ acceptor cells significantly (G). Scale bars: A–C, 10 μm; E, F, 20 μm. Data are presented as mean ± SEM from three independent experiments and the levels of significance were set to *p < 0.05, **p < 0.01, and ***p < 0.001 (G).CC BY · PubMed Central
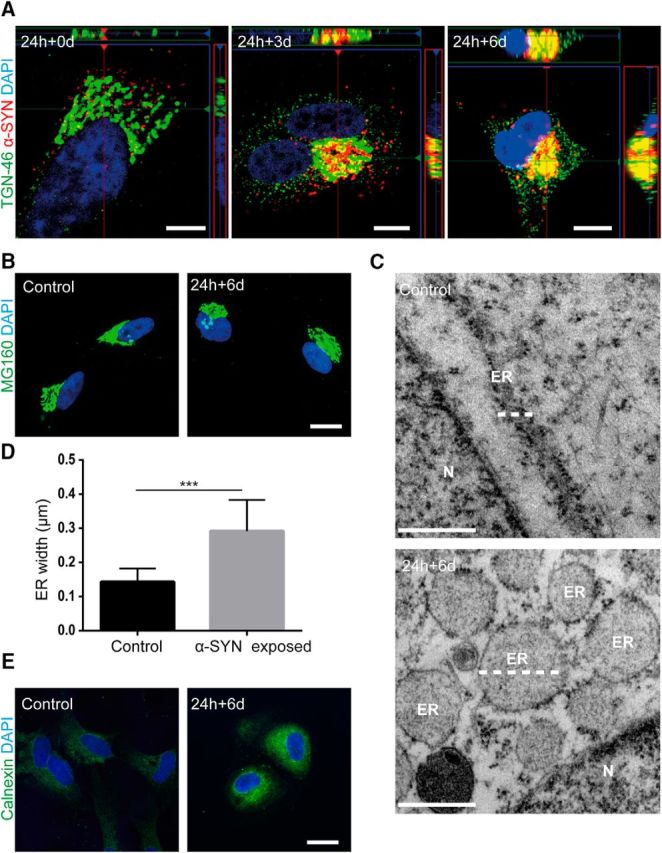
Figure 5. Intracellular storage of α-SYN in the TGN region causes ER swelling. Confocal microscopy imaging showed that α-SYN-Cy3 inclusions localized to the region of the TGN46+ TGN over time (A and Fig. 5-1A). Immunostainings with specific anti-Golgi complex antibodies demonstrated that the accumulation of ingested α-SYN oligomers in the TGN region did not induce Golgi fragmentation (B). TEM analysis of astrocytes 6 d after α-SYN oligomer exposure (24 h + 6 d) indicated that the α-SYN storage induced ER swelling (C) (white dotted lines indicate ER). Quantification of the ER width confirmed the induced ER swelling in oligomer-exposed astrocytes (D). Representative images from immunostainings with the anti-calnexin antibody showed a higher expression of calnexin in the perinuclear region of α-SYN oligomer-exposed astrocytes compared with control (E and Fig. 5-1B). Scale bars: A, 10 μm; B, 20 μm; C, 500 nm; E, 20 μm. Data are presented as mean ± SD from 14 α-SYN-exposed and 13 control astrocytes and the levels of significance were set to *p < 0.05, **p < 0.01, and ***p < 0.001 (D).
Figure 5. Intracellular storage of α-SYN in the TGN region causes ER swelling. Confocal microscopy imaging showed that α-SYN-Cy3 inclusions localized to the region of the TGN46+ TGN over time (A and Fig. 5-1A). Immunostainings with specific anti-Golgi complex antibodies demonstrated that the accumulation of ingested α-SYN oligomers in the TGN region did not induce Golgi fragmentation (B). TEM analysis of astrocytes 6 d after α-SYN oligomer exposure (24 h + 6 d) indicated that the α-SYN storage induced ER swelling (C) (white dotted lines indicate ER). Quantification of the ER width confirmed the induced ER swelling in oligomer-exposed astrocytes (D). Representative images from immunostainings with the anti-calnexin antibody showed a higher expression of calnexin in the perinuclear region of α-SYN oligomer-exposed astrocytes compared with control (E and Fig. 5-1B). Scale bars: A, 10 μm; B, 20 μm; C, 500 nm; E, 20 μm. Data are presented as mean ± SD from 14 α-SYN-exposed and 13 control astrocytes and the levels of significance were set to *p < 0.05, **p < 0.01, and ***p < 0.001 (D).CC BY · PubMed Central
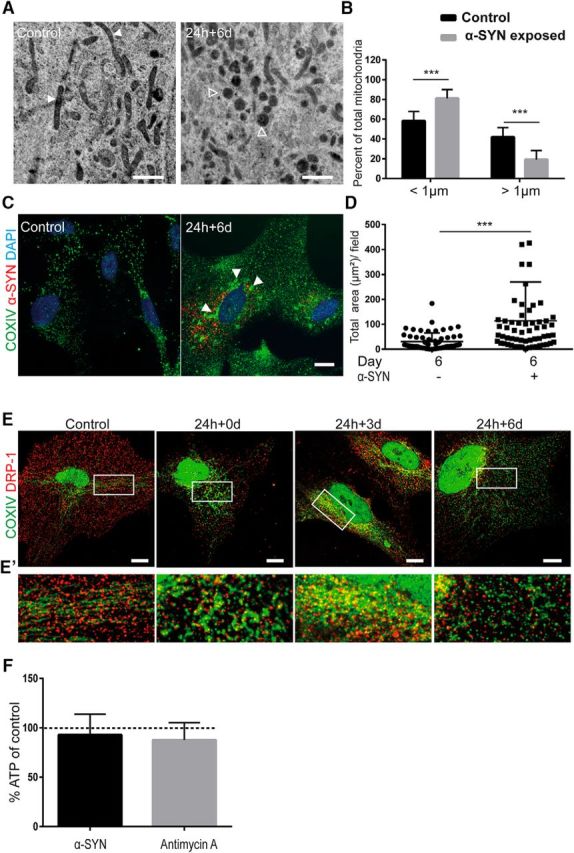
Figure 6. Accumulation of α-SYN oligomers results in mitochondrial defects and autophagy dysfunction. TEM analysis showed widespread mitochondrial fragmentation in α-SYN oligomer-exposed astrocytes compared with control cells (A) (white arrowheads indicate normal mitochondria and empty arrowheads indicate dense/fragmented mitochondria). Quantification of the percentage of normal mitochondria versus dense/fragmented mitochondria using ImageJ demonstrated a significant increase of dense mitochondria in oligomer-exposed cultures (B). Immunostaining with COXIV antibody demonstrated increased formation of mitochondria aggregates (C and Fig. 6-1A, white arrowheads). The increased area of the mitochondria aggregates was confirmed by quantification using ImageJ analysis (D). Double staining with specific antibodies to COX IV and DRP-1 followed by confocal imaging displayed an organized pattern of mitochondria and the fission-regulating protein DRP-1 3 d after α-SYN oligomer exposure (24 h + 3 d), preceding an excessive amount of fragmented mitochondria at day 6 (24 h + 6 d) (E and Fig. 6-1B). Close-ups of the white rectangles are shown in E′. ATP measurement showed only a very moderate decrease (7%) in ATP levels after α-SYN oligomer treatment. In control cultures treated with the electron transport inhibitor antimycin A, there was also a very low decrease in ATP levels (13%) compared with untreated cultures (F). Scale bars: A, 1 μm; C, E, 20 μm. Data are presented as mean ± SD from 14 α-SYN oligomer-exposed and 12 control astrocytes (B) and as mean ± SD from three independent experiments (D). The levels of significance were set to *p < 0.05, **p < 0.01, and ***p < 0.001 (B, D).
Figure 6. Accumulation of α-SYN oligomers results in mitochondrial defects and autophagy dysfunction. TEM analysis showed widespread mitochondrial fragmentation in α-SYN oligomer-exposed astrocytes compared with control cells (A) (white arrowheads indicate normal mitochondria and empty arrowheads indicate dense/fragmented mitochondria). Quantification of the percentage of normal mitochondria versus dense/fragmented mitochondria using ImageJ demonstrated a significant increase of dense mitochondria in oligomer-exposed cultures (B). Immunostaining with COXIV antibody demonstrated increased formation of mitochondria aggregates (C and Fig. 6-1A, white arrowheads). The increased area of the mitochondria aggregates was confirmed by quantification using ImageJ analysis (D). Double staining with specific antibodies to COX IV and DRP-1 followed by confocal imaging displayed an organized pattern of mitochondria and the fission-regulating protein DRP-1 3 d after α-SYN oligomer exposure (24 h + 3 d), preceding an excessive amount of fragmented mitochondria at day 6 (24 h + 6 d) (E and Fig. 6-1B). Close-ups of the white rectangles are shown in E′. ATP measurement showed only a very moderate decrease (7%) in ATP levels after α-SYN oligomer treatment. In control cultures treated with the electron transport inhibitor antimycin A, there was also a very low decrease in ATP levels (13%) compared with untreated cultures (F). Scale bars: A, 1 μm; C, E, 20 μm. Data are presented as mean ± SD from 14 α-SYN oligomer-exposed and 12 control astrocytes (B) and as mean ± SD from three independent experiments (D). The levels of significance were set to *p < 0.05, **p < 0.01, and ***p < 0.001 (B, D).CC BY · PubMed Central
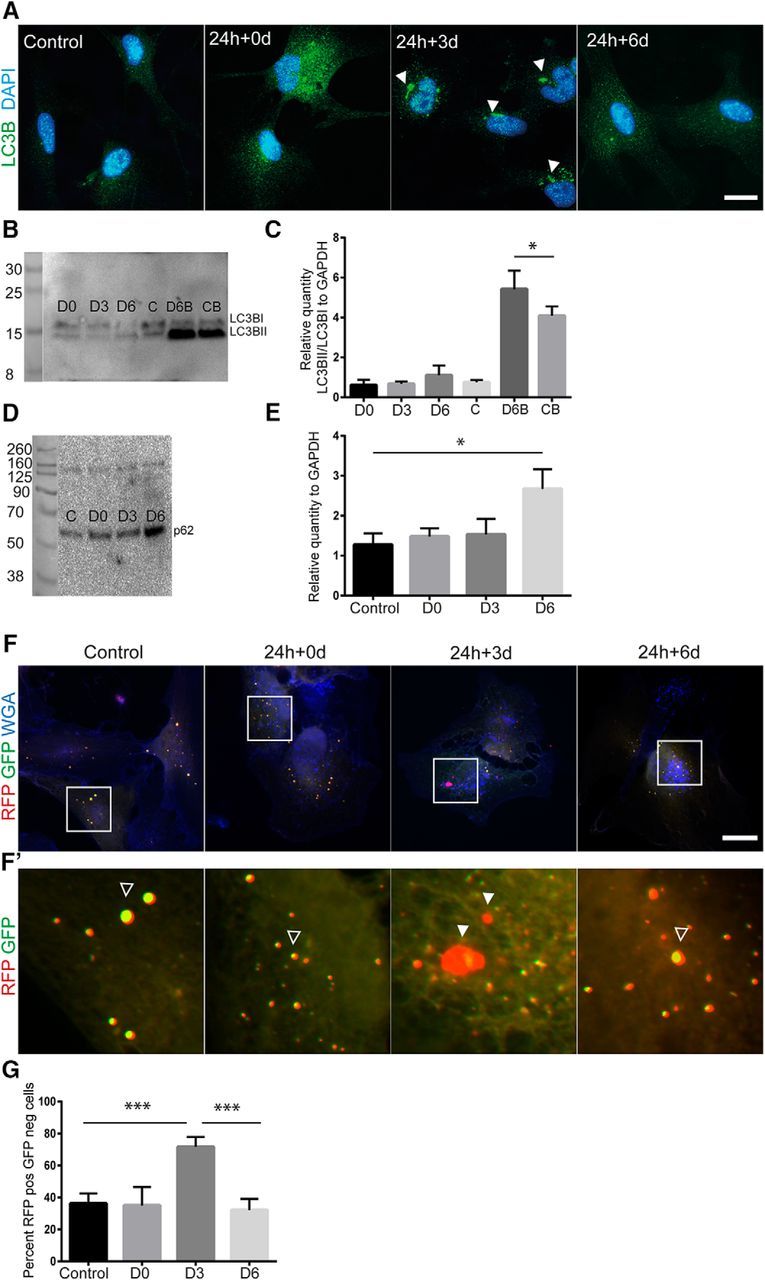
Figure 7. α-SYN oligomer exposure affects the autophagosomal pathway. Immunostainings with specific antibodies to the autophagy marker LC3B showed an increased presence of LC3B puncta after α-SYN oligomer exposure (24 h + 0 and 24 h + 3 d) compared with untreated control cultures (A). Western blot analysis of LC3BI and II showed a significantly increased LC3BII/I ratio (normalized to GAPDH) at 24 h + 6 d when the cells were treated with the inhibitor bafilomycin A, suggesting a partial block of the autophagosomal machinery by the α-SYN oligomers (B, C). Western blot analysis of p62 showed a significant increased protein expression at day 6 after oligomer exposure (24 h + 6 d) compared with untreated controls, (n = 3) (D, E). Next, astrocytes were transfected with plasmids containing the LC3B gene coupled to RFP and pH-sensitive GFP. This autophagy tandem sensor RFP–GFP technique makes it possible to follow the turnover of autophagosomes to autolysosomes because the GFP protein is degraded when it comes into contact with low pH. Representative images from the staining demonstrate that significantly more cells with RFP+ but GFP− autophagosomes were present at 24 h+3 d compared with untreated control cultures (F–H and Fig. 7-1) Filled arrowheads indicate RFP+ GPP− vesicles and empty arrowheads indicate RFP+ GPP+ vesicles. Scale bars: A, E, 20 μm. Data are presented as mean ± SD.
Figure 7. α-SYN oligomer exposure affects the autophagosomal pathway. Immunostainings with specific antibodies to the autophagy marker LC3B showed an increased presence of LC3B puncta after α-SYN oligomer exposure (24 h + 0 and 24 h + 3 d) compared with untreated control cultures (A). Western blot analysis of LC3BI and II showed a significantly increased LC3BII/I ratio (normalized to GAPDH) at 24 h + 6 d when the cells were treated with the inhibitor bafilomycin A, suggesting a partial block of the autophagosomal machinery by the α-SYN oligomers (B, C). Western blot analysis of p62 showed a significant increased protein expression at day 6 after oligomer exposure (24 h + 6 d) compared with untreated controls, (n = 3) (D, E). Next, astrocytes were transfected with plasmids containing the LC3B gene coupled to RFP and pH-sensitive GFP. This autophagy tandem sensor RFP–GFP technique makes it possible to follow the turnover of autophagosomes to autolysosomes because the GFP protein is degraded when it comes into contact with low pH. Representative images from the staining demonstrate that significantly more cells with RFP+ but GFP− autophagosomes were present at 24 h+3 d compared with untreated control cultures (F–H and Fig. 7-1) Filled arrowheads indicate RFP+ GPP− vesicles and empty arrowheads indicate RFP+ GPP+ vesicles. Scale bars: A, E, 20 μm. Data are presented as mean ± SD.CC BY · PubMed Central
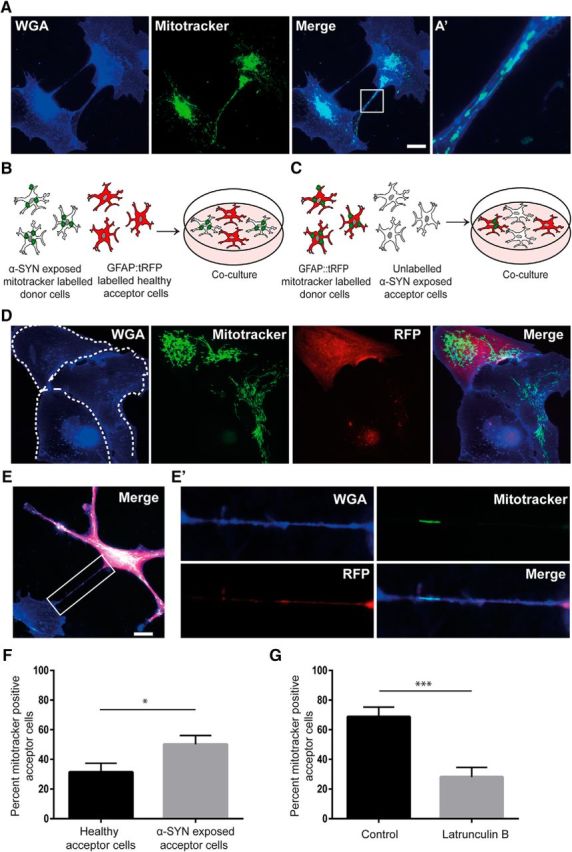
Figure 8. Healthy astrocytes deliver mitochondria to α-SYN oligomer-exposed astrocytes. Using Mitotracker transfection, we could demonstrate that mitochondria were present within TNTs connecting the astrocytes (A). A close-up of the white rectangle is shown in A′. Coculture experiments were performed using two different set-ups. Either, GFAP::tRFP astrocytes (red acceptor cells) were cocultured with Mitotracker-transfected, α-SYN oligomer-exposed astrocytes (donor cells) (B) or α-SYN oligomer-exposed astrocytes (acceptor cells) were cocultured with GFAP::tRFP, Mitotracker-transfected astrocytes (red donor cells) (C). Using immunocytochemistry, we identified transfer of mitochondria between the GFAP::tRFP astrocytes and the unlabeled astrocytes via direct contact (dashed areas show the outline of separate cells) (D) and TNTs (E), a close-up of the white rectangle is shown in E′. Quantification of the number of Mitotracker+ acceptor cells in the two coculture setups indicated that the healthy astrocytes transferred significantly more mitochondria to α-SYN oligomer-exposed cells than the other way around (F). Addition of latrunculin B to the cocultures significantly decreased the percentage of Mitotracker+ acceptor cells (G). In addition, basal level of mitochondrial transfer was investigated in untreated control cultures. Compared with α-SYN oligomer-exposed cultures, the number of Mitotracker+ acceptor cells was significantly lower in the control cultures (see Fig. 8-1). Scale bars: A, 20 μm; D, E, 20 μm. Data are presented as mean ± SEM from three independent experiments and the levels of significance were set to *p < 0.05, **p < 0.01, and ***p < 0.001 (F, G).
Figure 8. Healthy astrocytes deliver mitochondria to α-SYN oligomer-exposed astrocytes. Using Mitotracker transfection, we could demonstrate that mitochondria were present within TNTs connecting the astrocytes (A). A close-up of the white rectangle is shown in A′. Coculture experiments were performed using two different set-ups. Either, GFAP::tRFP astrocytes (red acceptor cells) were cocultured with Mitotracker-transfected, α-SYN oligomer-exposed astrocytes (donor cells) (B) or α-SYN oligomer-exposed astrocytes (acceptor cells) were cocultured with GFAP::tRFP, Mitotracker-transfected astrocytes (red donor cells) (C). Using immunocytochemistry, we identified transfer of mitochondria between the GFAP::tRFP astrocytes and the unlabeled astrocytes via direct contact (dashed areas show the outline of separate cells) (D) and TNTs (E), a close-up of the white rectangle is shown in E′. Quantification of the number of Mitotracker+ acceptor cells in the two coculture setups indicated that the healthy astrocytes transferred significantly more mitochondria to α-SYN oligomer-exposed cells than the other way around (F). Addition of latrunculin B to the cocultures significantly decreased the percentage of Mitotracker+ acceptor cells (G). In addition, basal level of mitochondrial transfer was investigated in untreated control cultures. Compared with α-SYN oligomer-exposed cultures, the number of Mitotracker+ acceptor cells was significantly lower in the control cultures (see Fig. 8-1). Scale bars: A, 20 μm; D, E, 20 μm. Data are presented as mean ± SEM from three independent experiments and the levels of significance were set to *p < 0.05, **p < 0.01, and ***p < 0.001 (F, G).CC BY · PubMed Central
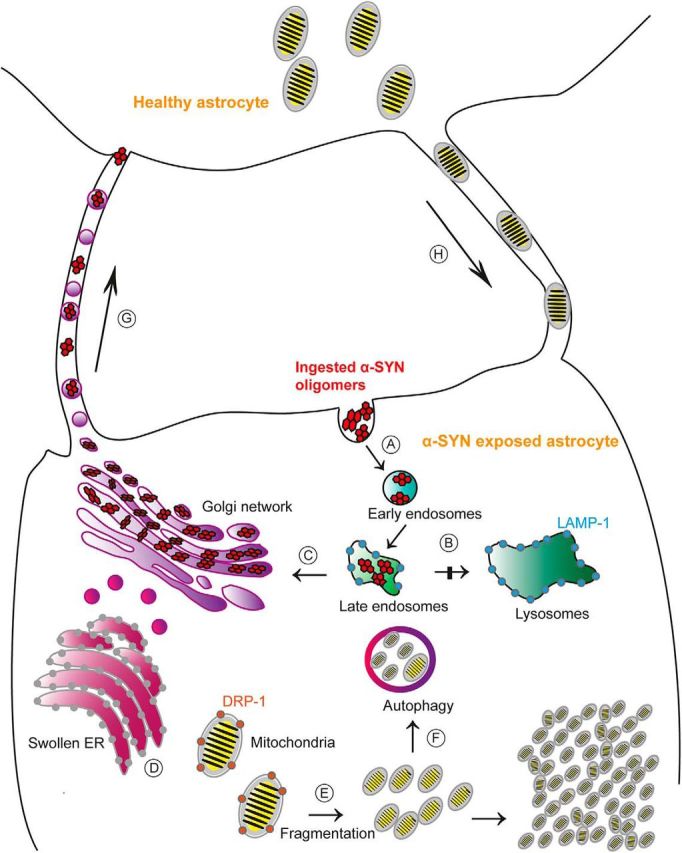
Figure 9. Proposed model for the cellular effects of α-SYN accumulation in astrocytes. Ingested α-SYN oligomers are transported to early/late endsosomes (A), but the lysosomal degradation is not completed (B). Instead, the aggregated α-SYN is stored intracellularly in the TGN region (C). The α-SYN accumulation is clearly stressful for the cell and results in swollen ER (D) and mitochondria fragmentation (E). Impaired mitochondria are initially degraded by the autophagosomes (F). However, the mitophagy is insufficient and pathological mitochondria remain in the astrocyte. Moreover, α-SYN oligomer-exposed astrocytes rapidly deploy a “defense mechanism” that consists of sending out TNTs to other astrocytes, enabling direct intercellular transmission of the toxic protein to healthy astrocytes (G). In return, healthy astrocytes send mitochondria to “rescue” stressed astrocytes (H).
Figure 9. Proposed model for the cellular effects of α-SYN accumulation in astrocytes. Ingested α-SYN oligomers are transported to early/late endsosomes (A), but the lysosomal degradation is not completed (B). Instead, the aggregated α-SYN is stored intracellularly in the TGN region (C). The α-SYN accumulation is clearly stressful for the cell and results in swollen ER (D) and mitochondria fragmentation (E). Impaired mitochondria are initially degraded by the autophagosomes (F). However, the mitophagy is insufficient and pathological mitochondria remain in the astrocyte. Moreover, α-SYN oligomer-exposed astrocytes rapidly deploy a “defense mechanism” that consists of sending out TNTs to other astrocytes, enabling direct intercellular transmission of the toxic protein to healthy astrocytes (G). In return, healthy astrocytes send mitochondria to “rescue” stressed astrocytes (H).CC BY · PubMed Central

Verification

Claims the paper makes

The claims and statistics of this paper haven’t been checked yet.

Run the check — free, no account needed. It reads the open-access text and checks the sources it cites.

A few free checks a day · papers already verified open instantly · results are public

Claims other papers make about this one

Each is checked against this paper’s own text: does it say what the citing paper says it does?

Self-check

Percentages, sums and reported differences re-computed from the paper’s own numbers.

The self-check needs the paper’s full text.

Citations

Cites

Show all 75 references

Cited by

Sorted by citations

See all 341

Metadata

Authors
Rostami, J., Holmqvist, S., Lindström, V., Sigvardson, J., Westermark, G. T., Ingelsson, M., Bergström, J., Roybon, L., & Erlandsson, A.
Affiliations
  • Uppsala University (SE)
  • Lund University (SE)
Corresponding author
Erlandsson, Anna
Venue
The Journal of Neuroscience
Published
2017-10-31
Volume
37
Issue
49
Pages
11835-11853
ISSN
  • 0270-6474 (ISSN-L)
  • 1529-2401
OpenAlex
W2765364382
Cited by
339
References
75
Citations by year
2026: 45 · 2025: 30 · 2024: 64 · 2023: 47 · 2022: 34 · 2021: 38 · 2020: 26 · 2019: 31 · 2018: 24
FWCI
15.43
Type
journal article
Language
en
Open access
Locations
  • Journal of Neuroscience (publishedVersion, cc-by)
  • Europe PMC (PubMed Central) (publishedVersion, cc-by)
  • PubMed Central (publishedVersion, cc-by)
  • PubMed (publishedVersion)
  • Uppsala University Publications (Uppsala University) (submittedVersion, other-oa)
  • Lund University Publications (Lund University) (submittedVersion)
  • Apollo (University of Cambridge) (submittedVersion, cc-by)
  • Apollo (cc-by)
Funders
  • Åke Wiberg Stiftelse
  • Innovationsfonden
  • Vetenskapsrådet
Topics
  • Health Sciences › Medicine › Clinical Neurology › Parkinson's Disease Mechanisms and Treatments
  • Life Sciences › Neuroscience › Neurology › Neuroinflammation and Neurodegeneration Mechanisms
  • Life Sciences › Neuroscience › Cellular and Molecular Neuroscience › Alzheimer's disease research and treatments
Keywords
alpha-synuclein, Parkinson's disease, tunneling nanotubes, astrocytes, prion-like propagation, intercellular transfer, lysosomal degradation, trans-Golgi network, mitochondrial damage, endoplasmic reticulum stress, mitochondrial transfer
MeSH terms
Astrocytes, Cell Communication, Cells, Cultured, Humans, Nanotubes, alpha-Synuclein, Embryonic Stem Cells

About these checks

Registry, retraction, Cites and statistics results are computed, not judged, with one exception: a printed reference that no index lists is read once by a model before it counts as a citation error. Claims are extracted by a model and kept only when their quote appears verbatim in the text; each cited source is then checked, with a model’s help, for whether it says what the claim relies on. Those verdicts can be wrong — read the claim’s quote and the cited source before relying on one.

Statistics and arithmetic are recomputed, not judged.

Confidence bands are shown only for fields calibrated on our annotated test set. None is calibrated yet, so no band is shown.

What counts as a claim ›How we measure confidence ›How we check this ›

Are you an author, or do you see a problem with this page? Request a review