

The DOI matches its Crossref record; 87 of the 88 references it cites were found in a registry or an index.
HDAC6 inhibition restores TDP‐43 pathology and axonal transport defects in human motor neurons with TARDBP mutations
Open accessAbstract
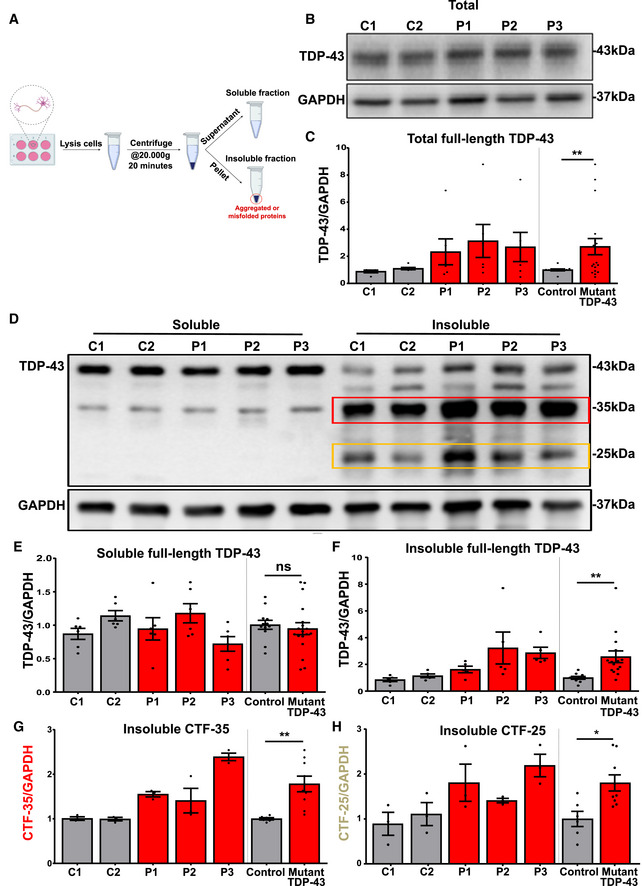
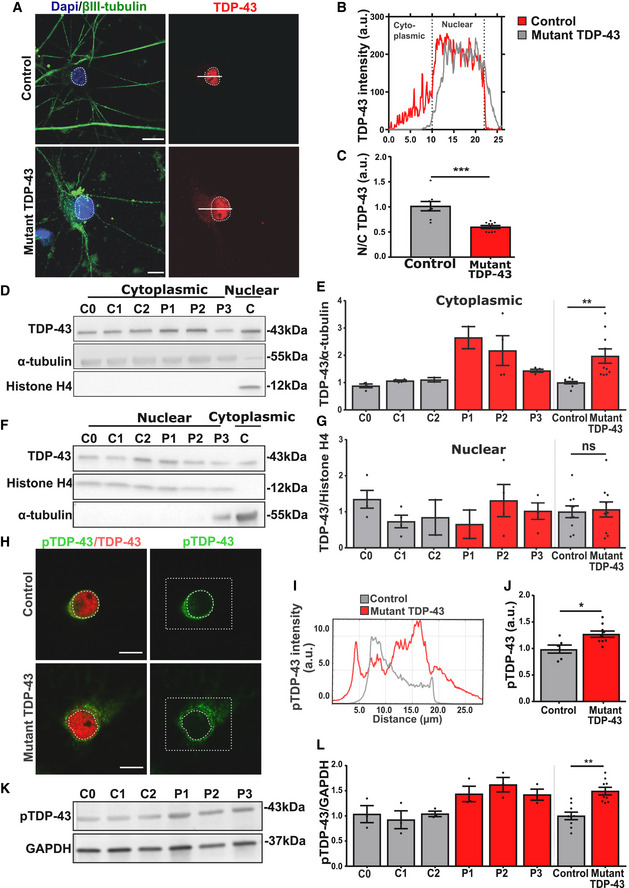
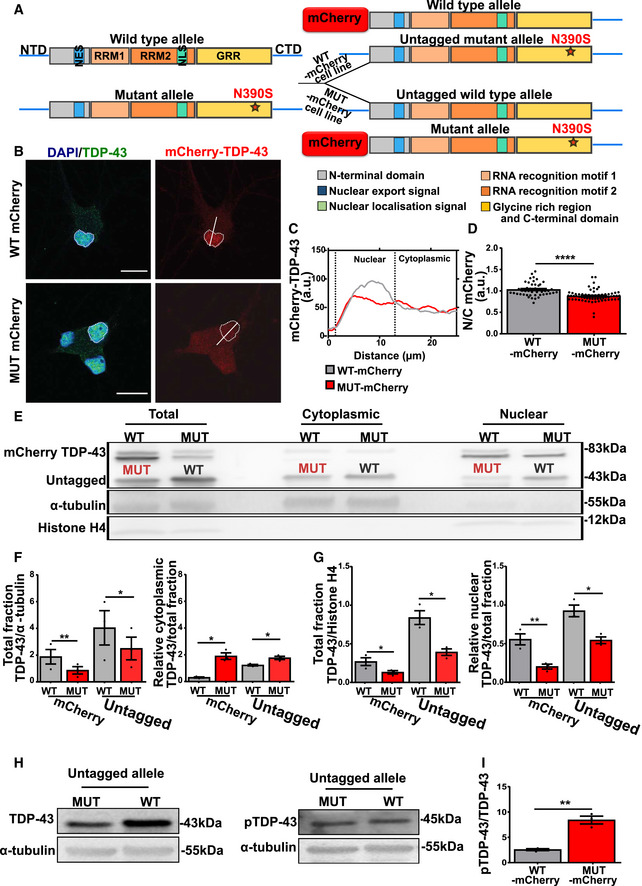
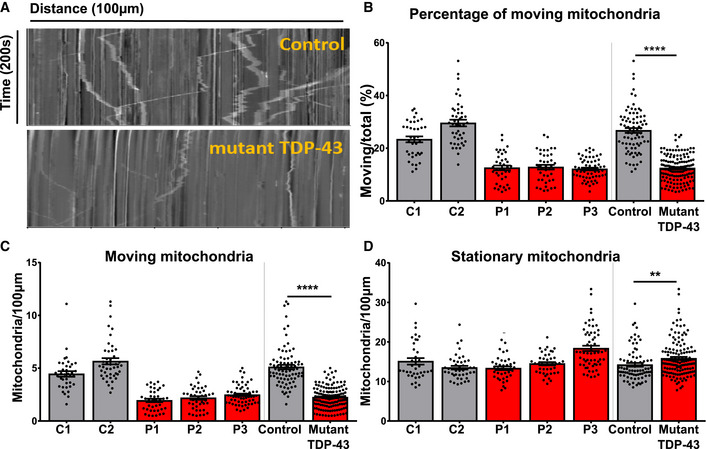
TDP‐43 is the major component of pathological inclusions in most ALS patients and in up to 50% of patients with frontotemporal dementia (FTD). Heterozygous missense mutations in TARDBP , the gene encoding TDP‐43, are one of the common causes of familial ALS. In this study, we investigate TDP‐43 protein behavior in induced pluripotent stem cell (iPSC)‐derived motor neurons from three ALS patients with different TARDBP mutations, three healthy controls and an isogenic control. TARDPB mutations induce several TDP‐43 changes in spinal motor neurons, including cytoplasmic mislocalization and accumulation of insoluble TDP‐43, C‐terminal fragments, and phospho‐TDP‐43. By generating iPSC lines with allele‐specific tagging of TDP‐43, we find that mutant TDP‐43 initiates the observed disease phenotypes and has an altered interactome as indicated by mass spectrometry. Our findings also indicate that TDP‐43 proteinopathy results in a defect in mitochondrial transport. Lastly, we show that pharmacological inhibition of histone deacetylase 6 (HDAC6) restores the observed TDP‐43 pathologies and the axonal mitochondrial motility, suggesting that HDAC6 inhibition may be an interesting therapeutic target for neurodegenerative disorders linked to TDP‐43 pathology.
Overview
The claims and statistics of this paper haven’t been checked yet.
Run the check — free, no account needed. It reads the open-access text and checks the sources it cites.
Integrity signals
Registry
Cites
Statistics
Figures
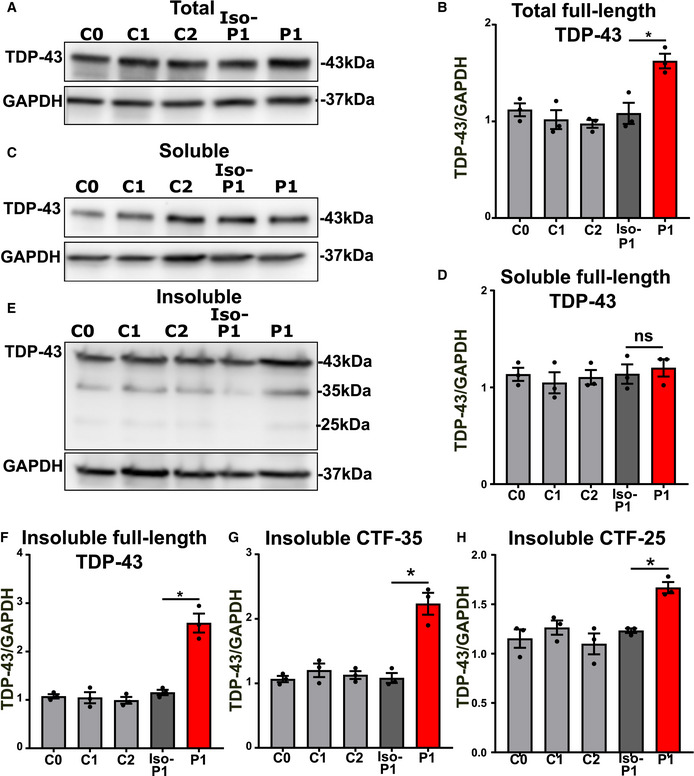
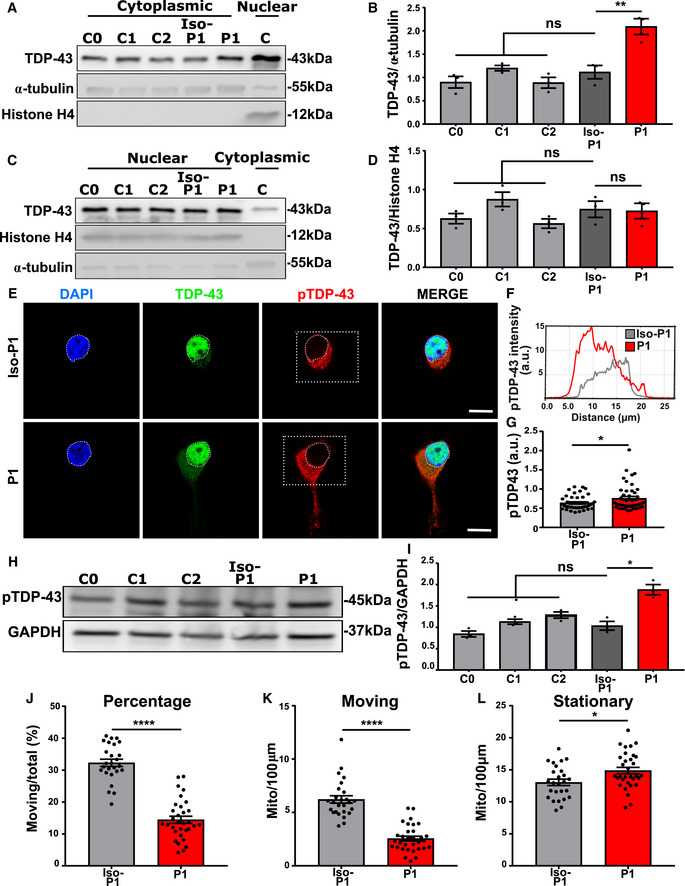
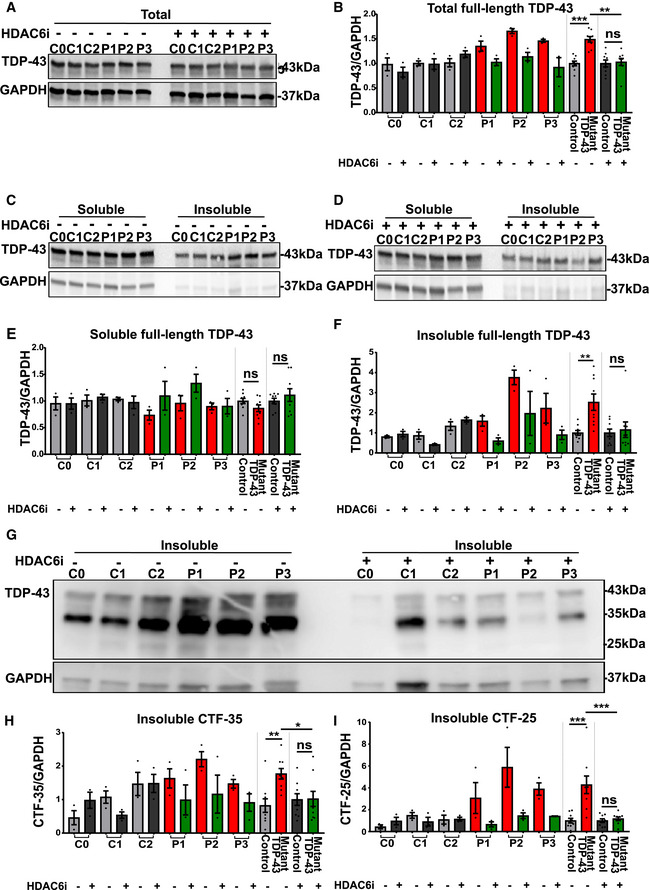
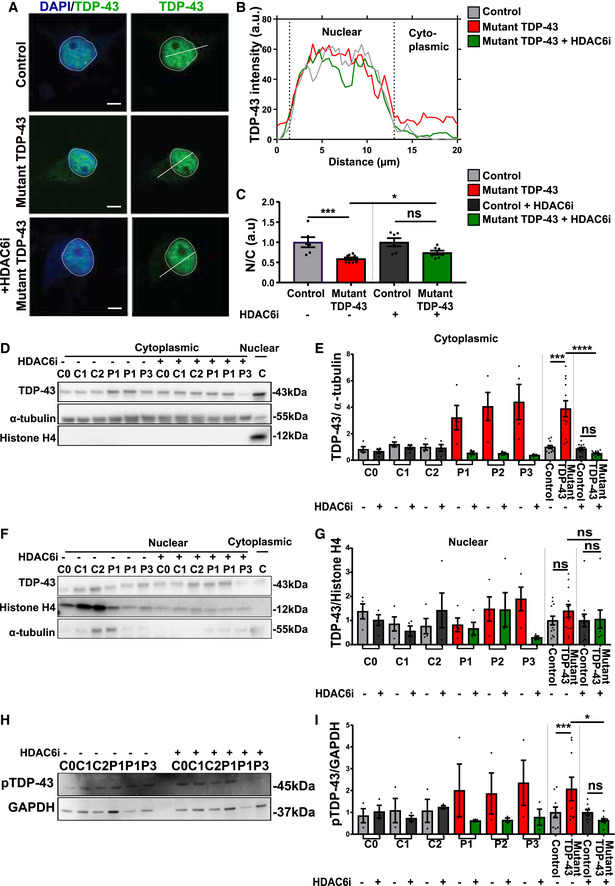
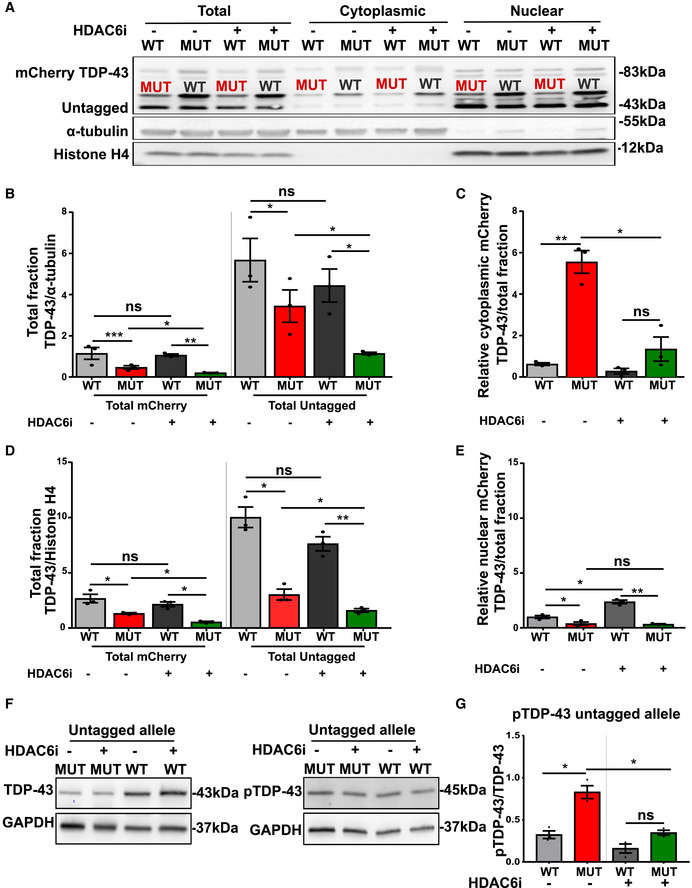
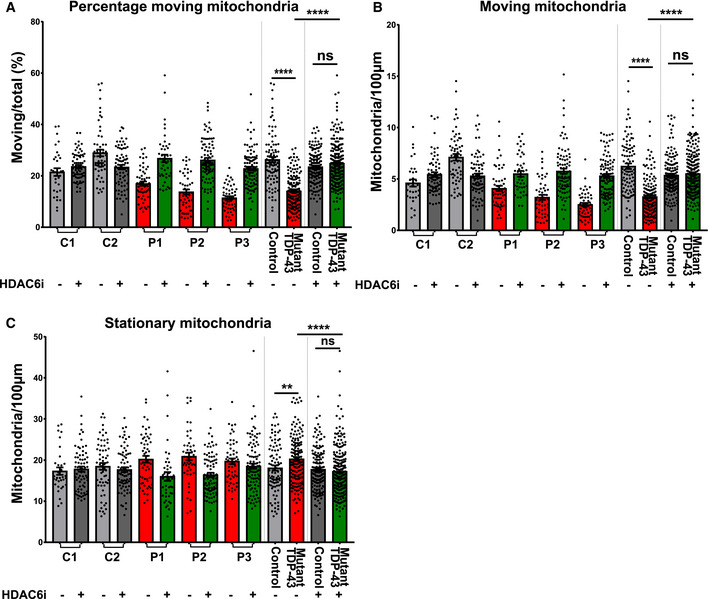
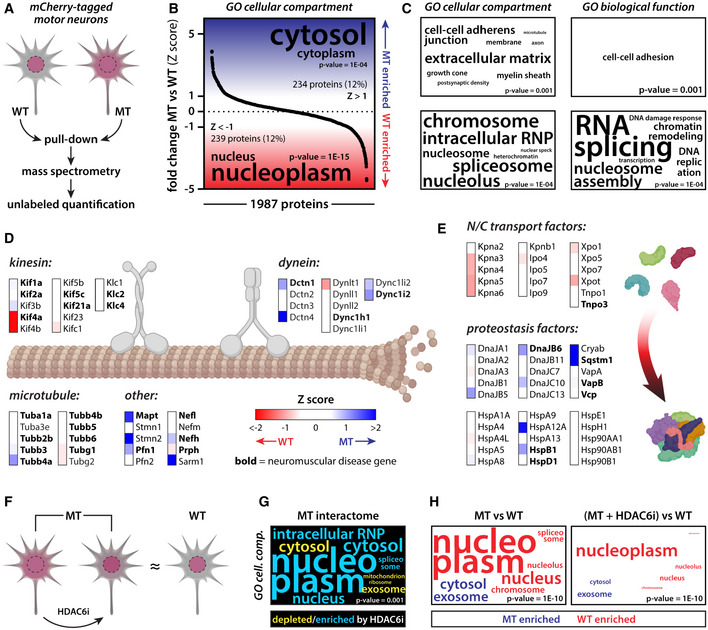
Verification
Claims the paper makes
The claims and statistics of this paper haven’t been checked yet.
Run the check — free, no account needed. It reads the open-access text and checks the sources it cites.
Claims other papers make about this one
Each is checked against this paper’s own text: does it say what the citing paper says it does?
In the citing paper
“Notably, genetic knockdown and pharmacological inhibition of HDACs have been shown to ameliorate ALS pathology in different ALS models.341–344”
From Microbiota–gut–brain axis and its therapeutic applications in neurodegenerative diseases (2024) · cites this paper as [343]
Self-check
Percentages, sums and reported differences re-computed from the paper’s own numbers.
The self-check needs the paper’s full text.
Citations
Cites
Systematic and integrative analysis of large gene lists using DAVID bioinformatics resources
Huang, D. W., Sherman, B. T., & Lempicki, R. A. (2009) · Nature Protocols · doi:10.1038/nprot.2008.211 · Cited by 35,890
Cox, J., & Mann, M. (2008) · Nature Biotechnology · doi:10.1038/nbt.1511 · Cited by 14,855
Salmon provides fast and bias-aware quantification of transcript expression
Patro, R., Duggal, G., Love, M. I., Irizarry, R. A., & Kingsford, C. (2017) · Nature Methods · doi:10.1038/nmeth.4197 · Cited by 12,700
The Perseus computational platform for comprehensive analysis of (prote)omics data
Tyanova, S., Temu, T., Sinitcyn, P., Carlson, A., Hein, M. Y., Geiger, T., Mann, M., & Cox, J. (2016) · Nature Methods · doi:10.1038/nmeth.3901 · Cited by 8,803
Ubiquitinated TDP-43 in Frontotemporal Lobar Degeneration and Amyotrophic Lateral Sclerosis
Neumann, M., Sampathu, D. M., Kwong, L. K., Truax, A. C., Micsenyi, M. C., Chou, T. T., Bruce, J., Schuck, T., Grossman, M., Clark, C. M., et al. (2006) · Science · doi:10.1126/science.1134108 · Cited by 6,576
Cox, J., Hein, M. Y., Luber, C. A., Paron, I., Nagaraj, N., & Mann, M. (2014) · Molecular & Cellular Proteomics · doi:10.1074/mcp.m113.031591 · Cited by 5,180
Differential analyses for RNA-seq: transcript-level estimates improve gene-level inferences
Soneson, C., Love, M. I., & Robinson, M. D. (2015) · F1000Research · doi:10.12688/f1000research.7563.1 · Cited by 3,929
Arai, T., Hasegawa, M., Akiyama, H., Ikeda, K., Nonaka, T., Mori, H., Mann, D., Tsuchiya, K., Yoshida, M., Hashizume, Y., et al. (2006) · Biochemical and Biophysical Research Communications · doi:10.1016/j.bbrc.2006.10.093 · Cited by 2,732
TDP-43 Mutations in Familial and Sporadic Amyotrophic Lateral Sclerosis
Sreedharan, J., Blair, I. P., Tripathi, V. B., Hu, X., Vance, C., Rogelj, B., Ackerley, S., Durnall, J. C., Williams, K. L., Buratti, E., et al. (2008) · Science · doi:10.1126/science.1154584 · Cited by 2,630
Brown, R. H., & Al‐Chalabi, A. (2017) · New England Journal of Medicine · doi:10.1056/nejmra1603471 · Cited by 2,580
HDAC6 is a microtubule-associated deacetylase
Hubbert, C., Guardiola, A., Shao, R., Kawaguchi, Y., Ito, A., Nixon, A., Yoshida, M., Wang, X.-F., & Yao, T.-P. (2002) · Nature · doi:10.1038/417455a · Cited by 2,403
Hardiman, O. M., Al‐Chalabi, A., Chiò, A., Corr, E. M., Logroscino, G., Robberecht, W., Shaw, P. J., Simmons, Z., & van den Berg, L. H. (2017) · Nature Reviews Disease Primers · doi:10.1038/nrdp.2017.71 · Cited by 2,262
A Controlled Trial of Riluzole in Amyotrophic Lateral Sclerosis
Bensimon, G., Lacomblez, L., & Meininger, V. (1994) · New England Journal of Medicine · doi:10.1056/nejm199403033300901 · Cited by 2,239
Limbic-predominant age-related TDP-43 encephalopathy (LATE): consensus working group report
Nelson, P. T., Dickson, D. W., Trojanowski, J. Q., Jack, C. R., Boyle, P. A., Arfanakis, K., Rademakers, R., Alafuzoff, I., Attems, J., Brayne, C., et al. (2019) · Brain · doi:10.1093/brain/awz099 · Cited by 1,547
TARDBP mutations in individuals with sporadic and familial amyotrophic lateral sclerosis
Kabashi, E., Valdmanis, P. N., Dion, P., Spiegelman, D., McConkey, B. J., Velde, C. V., Bouchard, J.-P., Lacomblez, L., Pochigaeva, K., Salachas, F., et al. (2008) · Nature Genetics · doi:10.1038/ng.132 · Cited by 1,544
Long pre-mRNA depletion and RNA missplicing contribute to neuronal vulnerability from loss of TDP-43
Polymenidou, M., Lagier-Tourenne, C., Hutt, K. R., Huelga, S. C., Moran, J., Liang, T. Y., Ling, S.-C., Sun, E., Wancewicz, E., Mazur, C., et al. (2011) · Nature Neuroscience · doi:10.1038/nn.2779 · Cited by 1,335
Amyotrophic lateral sclerosis: a clinical review
Masrori, P., & Damme, P. V. (2020) · European Journal of Neurology · doi:10.1111/ene.14393 · Cited by 1,315
HDAC6 rescues neurodegeneration and provides an essential link between autophagy and the UPS.
Pandey, U. B., Nie, Z., Batlevi, Y., McCray, B. A., Ritson, G. P., Nedelsky, N. B., Schwartz, S. L., DiProspero, N. A., Knight, M. A., Schuldiner, O., et al. (2007) · Nature · doi:10.1038/nature05853 · Cited by 1,234
Johnson, B. S., Snead, D., Lee, J. J., McCaffery, J. M., Shorter, J., & Gitler, A. D. (2009) · Journal of Biological Chemistry · doi:10.1074/jbc.m109.010264 · Cited by 812
Phosphorylated TDP‐43 in frontotemporal lobar degeneration and amyotrophic lateral sclerosis
Hasegawa, M., Arai, T., Nonaka, T., Kametani, F., Yoshida, M., Hashizume, Y., Beach, T. G., Buratti, E., Baralle, F., Morita, M., et al. (2008) · Annals of Neurology · doi:10.1002/ana.21425 · Cited by 777
Van Deerlin, V. M., Leverenz, J. B., Bekris, L. M., Bird, T. D., Yuan, W., Elman, L. B., Clay, D., Wood, E. M., Chen-Plotkin, A. S., Martinez-Lage, M., et al. (2008) · The Lancet Neurology · doi:10.1016/s1474-4422(08)70071-1 · Cited by 723
Winton, M. J., Igaz, L. M., Wong, M. M., Kwong, L. K., Trojanowski, J. Q., & Lee, V. M. ‐. (2008) · Journal of Biological Chemistry · doi:10.1074/jbc.m800342200 · Cited by 660
Axonal Transport of TDP-43 mRNA Granules Is Impaired by ALS-Causing Mutations
Alami, N. H., Smith, R. B., Carrasco, M. A., Williams, L. A., Winborn, C. S., Han, S. S. W., Kiskinis, E., Winborn, B., Freibaum, B. D., Kanagaraj, A., et al. (2014) · Neuron · doi:10.1016/j.neuron.2013.12.018 · Cited by 660
ALS-implicated protein TDP-43 sustains levels of STMN2, a mediator of motor neuron growth and repair
Klim, J. R., Williams, L. A., Limone, F., Guerra San Juan, I., Davis-Dusenbery, B. N., Mordes, D. A., Burberry, A., Steinbaugh, M. J., Gamage, K. K., Kirchner, R., et al. (2019) · Nature Neuroscience · doi:10.1038/s41593-018-0300-4 · Cited by 653
TDP‐43 regulates its mRNA levels through a negative feedback loop
Ayala, Y. M., Conti, L. D., Avendaño-Vázquez, S. E., Dhir, A., Romano, M., D’Ambrogio, A., Tollervey, J. R., Ule, J., Baralle, M., Buratti, E., et al. (2010) · The EMBO Journal · doi:10.1038/emboj.2010.310 · Cited by 649
Structural determinants of the cellular localization and shuttling of TDP-43
Ayala, Y. M., Zago, P., D’Ambrogio, A., Xu, Y.-F., Petrucelli, L., Buratti, E., & Baralle, F. E. (2008) · Journal of Cell Science · doi:10.1242/jcs.038950 · Cited by 643
Melamed, Z., López-Erauskin, J., Baughn, M. W., Zhang, O., Drenner, K., Sun, Y., Freyermuth, F., McMahon, M. A., Beccari, M. S., Artates, J. W., et al. (2019) · Nature Neuroscience · doi:10.1038/s41593-018-0293-z · Cited by 635
Neary, D., Snowden, J. S., & Mann, D. M. A. (2005) · The Lancet Neurology · doi:10.1016/s1474-4422(05)70223-4 · Cited by 558
Barmada, S. J., Skibinski, G., Korb, E., Rao, E. J., Wu, J. Y., & Finkbeiner, S. (2010) · The Journal of Neuroscience · doi:10.1523/jneurosci.4988-09.2010 · Cited by 554
Freibaum, B. D., Chitta, R. K., High, A. A., & Taylor, J. P. (2009) · Journal of Proteome Research · doi:10.1021/pr901076y · Cited by 529
Arnold, E. S., Ling, S., Huelga, S. C., Lagier‐Tourenne, C., Polymenidou, M., Ditsworth, D., Kordasiewicz, H. B., McAlonis‐Downes, M., Platoshyn, O., Parone, P. A., et al. (2013) · Proceedings of the National Academy of Sciences · doi:10.1073/pnas.1222809110 · Cited by 508
TDP-43 is a key player in the clinical features associated with Alzheimer’s disease
Josephs, K. A., Whitwell, J. L., Weigand, S. D., Murray, M. E., Tosakulwong, N., Liesinger, A. M., Petrucelli, L., Senjem, M. L., Knopman, D. S., Boeve, B. F., et al. (2014) · Acta Neuropathologica · doi:10.1007/s00401-014-1269-z · Cited by 481
d’Ydewalle, C. V. O., Krishnan, J., Chiheb, D., Damme, P. V., Irobi, J., Kozikowski, A. P., Berghe, P. V., Timmerman, V., Robberecht, W., & Bosch, L. V. D. (2011) · Nature Medicine · doi:10.1038/nm.2396 · Cited by 462
Pathways Disrupted in Human ALS Motor Neurons Identified through Genetic Correction of Mutant SOD1
Kiskinis, E., Sandoe, J., Williams, L. A., Boulting, G. L., Moccia, R., Wainger, B. J., Han, S., Peng, T., Thams, S., Mikkilineni, S., et al. (2014) · Cell stem cell · doi:10.1016/j.stem.2014.03.004 · Cited by 441
Maury, Y., Côme, J., Piskorowski, R. A., Salah‐Mohellibi, N., Chevaleyre, V., Peschanski, M., Martinat, C., & Nedelec, S. (2014) · Nature Biotechnology · doi:10.1038/nbt.3049 · Cited by 431
HDAC6 inhibition reverses axonal transport defects in motor neurons derived from FUS-ALS patients
Guo, W., Naujock, M., Fumagalli, L., Vandoorne, T., Baatsen, P., Boon, R., Ordovás, L., Patel, A., Welters, M., Vanwelden, T., et al. (2017) · Nature Communications · doi:10.1038/s41467-017-00911-y · Cited by 373
Self-citationUnderstanding the role of TDP-43 and FUS/TLS in ALS and beyond
Da Cruz, S., & Cleveland, D. W. (2011) · Current Opinion in Neurobiology · doi:10.1016/j.conb.2011.05.029 · Cited by 351
HDAC6 as a target for neurodegenerative diseases: what makes it different from the other HDACs?
Simões-Pires, C., Zwick, V., Nurisso, A., Schenker, E., Carrupt, P.-A., & Cuendet, M. (2013) · Molecular Neurodegeneration · doi:10.1186/1750-1326-8-7 · Cited by 341
Igaz, L. M., Kwong, L. K., Xu, Y., Truax, A. C., Uryu, K., Neumann, M., Clark, C. M., Elman, L. B., Miller, B. L., Grossman, M., et al. (2008) · American Journal Of Pathology · doi:10.2353/ajpath.2008.080003 · Cited by 332
Bilican, B., Serio, A., Barmada, S. J., Nishimura, A. L., Sullivan, G. J., Carrasco, M., Phatnani, H. P., Puddifoot, C. A., Story, D., Fletcher, J., et al. (2012) · Proceedings of the National Academy of Sciences · doi:10.1073/pnas.1202922109 · Cited by 328
A cellular model for sporadic ALS using patient-derived induced pluripotent stem cells
Burkhardt, M. F., Martinez, F. J., Wright, S., Ramos, C., Volfson, D., Mason, M. J., Garnes, J., Dang, V., Lievers, J., Shoukat-Mumtaz, U., et al. (2013) · Molecular and Cellular Neuroscience · doi:10.1016/j.mcn.2013.07.007 · Cited by 316
Stem-cell-derived human microglia transplanted in mouse brain to study human disease
Mancuso, R., Van Den Daele, J., Fattorelli, N., Wolfs, L., Balusu, S., Burton, O., Liston, A., Sierksma, A., Fourne, Y., Poovathingal, S., et al. (2019) · Nature Neuroscience · doi:10.1038/s41593-019-0525-x · Cited by 295
Self-citationTDP-43 gains function due to perturbed autoregulation in a Tardbp knock-in mouse model of ALS-FTD
White, M. A., Kim, E., Duffy, A., Adalbert, R., Phillips, B. U., Peters, O. M., Stephenson, J., Yang, S., Massenzio, F., Lin, Z., et al. (2018) · Nature Neuroscience · doi:10.1038/s41593-018-0113-5 · Cited by 289
Gene discovery in amyotrophic lateral sclerosis: implications for clinical management
Al-Chalabi, A., van den Berg, L. H., & Veldink, J. (2017) · Nature Reviews Neurology · doi:10.1038/nrneurol.2016.182 · Cited by 287
A Drosophila model for TDP-43 proteinopathy
Li, Y., Ray, P., Rao, E. J., Chen, S., Guo, W., Chen, X., Woodruff, E. A., Fushimi, K., & Wu, J. Y. (2010) · Proceedings of the National Academy of Sciences · doi:10.1073/pnas.0913602107 · Cited by 279
Self-citationTDP-43 functions and pathogenic mechanisms implicated in TDP-43 proteinopathies
Cohen, T. J., Lee, V. M. ‐., & Trojanowski, J. Q. (2011) · Trends in Molecular Medicine · doi:10.1016/j.molmed.2011.06.004 · Cited by 271
Mutation within TARDBP leads to Frontotemporal Dementia without motor neuron disease
Borroni, B., Bonvicini, C., Alberici, A., Buratti, E., Agosti, C., Archetti, S., Papetti, A., Stuani, C., Luca, M. D., Gennarelli, M., et al. (2009) · Human Mutation · doi:10.1002/humu.21100 · Cited by 254
Nuclear factor TDP‐43 can affect selected microRNA levels
Buratti, E., Conti, L. D., Stuani, C., Romano, M., Baralle, M., & Baralle, F. E. (2010) · FEBS Journal · doi:10.1111/j.1742-4658.2010.07643.x · Cited by 250
Neumann, M., Kwong, L. K., Truax, A. C., Vanmassenhove, B., Kretzschmar, H. A., Deerlin, V. M. V., Clark, C. M., Grossman, M., Miller, B. L., Trojanowski, J. Q., et al. (2007) · Journal of Neuropathology & Experimental Neurology · doi:10.1097/01.jnen.0000248554.45456.58 · Cited by 238
Avendaño-Vázquez, S. E., Dhir, A., Bembich, S., Buratti, E., Proudfoot, N. J., & Baralle, F. E. (2012) · Genes & Development · doi:10.1101/gad.194829.112 · Cited by 212
RNA Dysregulation in Amyotrophic Lateral Sclerosis
Butti, Z., & Patten, S. A. (2019) · Frontiers in Genetics · doi:10.3389/fgene.2018.00712 · Cited by 210
The Pathobiology of TDP-43 C-Terminal Fragments in ALS and FTLD
Berning, B. A., & Walker, A. K. (2019) · Frontiers in Neuroscience · doi:10.3389/fnins.2019.00335 · Cited by 193
Axonal transport defects and neurodegeneration: Molecular mechanisms and therapeutic implications
Guo, W., Dittlau, K. S., & Bosch, L. V. D. (2019) · Seminars in Cell and Developmental Biology · doi:10.1016/j.semcdb.2019.07.010 · Cited by 185
Self-citationHall, C. E., Yao, Z., Choi, M., Tyzack, G. E., Serio, A., Luisier, R., Harley, J., Preza, E., Arber, C., Crisp, S. J., et al. (2017) · Cell Reports · doi:10.1016/j.celrep.2017.05.024 · Cited by 179
Highley, J. R., Kirby, J., Jansweijer, J. A., Webb, P., Hewamadduma, C., Heath, P. R., Higginbottom, A., Raman, R., Ferraiuolo, L., Cooper‐Knock, J., et al. (2014) · Neuropathology and Applied Neurobiology · doi:10.1111/nan.12148 · Cited by 160
Hebron, M. L., Lonskaya, I., Sharpe, K., Weerasinghe, P. P. K., Algarzae, N. K., Shekoyan, A. R., & Moussa, C. (2012) · Journal of Biological Chemistry · doi:10.1074/jbc.m112.419945 · Cited by 147
Loss of HDAC6, a novel CHIP substrate, alleviates abnormal tau accumulation
Cook, C. N., Gendron, T. F., Scheffel, K., Carlomagno, Y., Dunmore, J. H., Deture, M. A., & Petrucelli, L. (2012) · Human Molecular Genetics · doi:10.1093/hmg/dds125 · Cited by 132
Ordovás, L., Boon, R., Pistoni, M., Chen, Y., Wolfs, E., Guo, W., Sambathkumar, R., Bobis‐Wozowicz, S., Helsen, N., Vanhove, J., et al. (2015) · Stem Cell Reports · doi:10.1016/j.stemcr.2015.09.004 · Cited by 132
Self-citationFrench, R. L., Grese, Z. R., Aligireddy, H., Dhavale, D. D., Reeb, A. N., Kedia, N., Kotzbauer, P. T., Bieschke, J., & Ayala, Y. M. (2019) · Journal of Biological Chemistry · doi:10.1074/jbc.ra118.005889 · Cited by 129
Prior, R. C., Helleputte, L. V., Benoy, V., & Bosch, L. V. D. (2017) · Neurobiology of Disease · doi:10.1016/j.nbd.2017.02.009 · Cited by 118
Axonal transport defects are a common phenotype in Drosophila models of ALS
Baldwin, K. R., Godena, V. K., Hewitt, V. L., & Whitworth, A. J. (2016) · Human Molecular Genetics · doi:10.1093/hmg/ddw105 · Cited by 111
Extensive cryptic splicing upon loss of RBM17 and TDP43 in neurodegeneration models
Tan, Q., Yalamanchili, H. K., Park, J., Maio, A. D., Lu, H., Wan, Y., White, J. J., Bondar, V. V., Sayegh, L. S., Liu, X., et al. (2016) · Human Molecular Genetics · doi:10.1093/hmg/ddw337 · Cited by 99
TDP-43-Based Animal Models of Neurodegeneration: New Insights into ALS Pathology and Pathophysiology
Wegorzewska, I., & Baloh, R. H. (2010) · Neurodegenerative Diseases · doi:10.1159/000321547 · Cited by 97
TDP-43 expression influences amyloidβ plaque deposition and tau aggregation
Davis, S. A., Gan, K. A., Dowell, J. A., Cairns, N. J., & Gitcho, M. A. (2017) · Neurobiology of Disease · doi:10.1016/j.nbd.2017.04.012 · Cited by 95
Fumagalli, L., Young, F. L., Boeynaems, S., Decker, M. D., Mehta, A. R., Swijsen, A., Fazal, R., Guo, W., Moisse, M., Beckers, J., et al. (2021) · Science Advances · doi:10.1126/sciadv.abg3013 · Cited by 94
Self-citationSleigh, J. N., Tosolini, A. P., Gordon, D., Devoy, A., Fratta, P., Fisher, E., Talbot, K., & Schiavo, G. (2020) · Cell Reports · doi:10.1016/j.celrep.2020.02.078 · Cited by 93
Kreiter, N., Pal, A., Lojewski, X., Corcia, P., Naujock, M., Reinhardt, P., Sterneckert, J. L., Petri, S., Wegner, F., Storch, A., et al. (2018) · Neurobiology of Disease · doi:10.1016/j.nbd.2018.03.010 · Cited by 86
The Role of TDP-43 in Alzheimer’s Disease
Chang, X., Tan, M., Tan, L., & Yu, J. (2015) · Molecular Neurobiology · doi:10.1007/s12035-015-9264-5 · Cited by 85
Conti, L. D., Akinyi, M. V., Mendoza-Maldonado, R., Romano, M., Baralle, M., & Buratti, E. (2015) · Nucleic Acids Research · doi:10.1093/nar/gkv814 · Cited by 83
Shen, S., Benoy, V., Bergman, J. A., Kalin, J. H., Damião, M. C. F. C. B., Vistoli, G., Haeck, W., Bosch, L. V. D., & Kozikowski, A. P. (2015) · ACS Chemical Neuroscience · doi:10.1021/acschemneuro.5b00286 · Cited by 81
Yan, J. (2014) · DNA and Cell Biology · doi:10.1089/dna.2013.2300 · Cited by 77
TDP43 and RNA instability in amyotrophic lateral sclerosis
Weskamp, K., & Barmada, S. J. (2018) · Brain Research · doi:10.1016/j.brainres.2018.01.015 · Cited by 68
Gendron, T. F., & Petrucelli, L. (2011) · Journal of Molecular Neuroscience · doi:10.1007/s12031-011-9610-7 · Cited by 66
Defining the spectrum of frontotemporal dementias associated with TARDBP mutations
Caroppo, P., Camuzat, A., Guillot‐Noël, L., Thomas-Antérion, C., Couratier, P., Wong, T. H., Teichmann, M., Golfier, V., Auriacombe, S., Belliard, S., et al. (2016) · Neurology Genetics · doi:10.1212/nxg.0000000000000080 · Cited by 66
Helleputte, L. V., Kater, M. S. J., Cook, D. P., Eykens, C., Rossaert, E., Haeck, W., Jaspers, T., Geens, N., Berghe, P. V., Gysemans, C. A., et al. (2017) · Neurobiology of Disease · doi:10.1016/j.nbd.2017.11.011 · Cited by 66
Abo-Rady, M., Kalmbach, N., Pal, A., Schludi, C., Janosch, A., Richter, T., Freitag, P., Bickle, M., Kahlert, A., Petri, S., et al. (2020) · Stem Cell Reports · doi:10.1016/j.stemcr.2020.01.010 · Cited by 64
Beel, S., Herdewyn, S., Fazal, R., Decker, M. D., Moisse, M., Robberecht, W., Bosch, L. V. D., & Damme, P. V. (2018) · Molecular Neurodegeneration · doi:10.1186/s13024-018-0288-y · Cited by 63
Self-citationDifferentiation but not ALS mutations in FUS rewires motor neuron metabolism
Vandoorne, T., Veys, K., Guo, W., Sicart, A., Vints, K., Swijsen, A., Moisse, M., Eelen, G., Gounko, N. V., Fumagalli, L., et al. (2019) · Nature Communications · doi:10.1038/s41467-019-12099-4 · Cited by 59
Self-citationTDP-43 M311V mutation in familial amyotrophic lateral sclerosis
Lemmens, R., Race, V., Hersmus, N., Matthijs, G., Bosch, L. V. D., Damme, P. V., Dubois, B., Boonen, S. E., Goris, A., & Robberecht, W. (2009) · Journal of Neurology Neurosurgery & Psychiatry · doi:10.1136/jnnp.2008.157677 · Cited by 57
Sun, X., Song, J., Huang, H., Chen, H., & Qian, K. X. (2018) · Stem Cell Research & Therapy · doi:10.1186/s13287-018-1048-1 · Cited by 57
Open-label 24-week extension study of edaravone (MCI-186) in amyotrophic lateral sclerosis
THE WRITING GROUP ON BEHALF OF THE EDARAVONE (MCI-186) ALS 19 STUDY GROUP (2017) · Amyotrophic Lateral Sclerosis and Frontotemporal Degeneration · doi:10.1080/21678421.2017.1364269 · Cited by 53
HDAC6 inhibitors: Translating genetic and molecular insights into a therapy for axonal CMT
Rossaert, E., & Bosch, L. V. D. (2020) · Brain Research · doi:10.1016/j.brainres.2020.146692 · Cited by 46
Modeling Protein Aggregation and the Heat Shock Response in ALS iPSC-Derived Motor Neurons
Seminary, E. R., Sison, S. L., & Ebert, A. D. (2018) · Frontiers in Neuroscience · doi:10.3389/fnins.2018.00086 · Cited by 45
Exploring the aggregation-prone regions from structural domains of human TDP-43
Kumar, V., Wahiduzzaman, Prakash, A., Tomar, A. K., Srivastava, A., Kundu, B., Lynn, A. M., & Hassan, M. I. (2018) · Biochimica et Biophysica Acta (BBA) - Proteins and Proteomics · doi:10.1016/j.bbapap.2018.10.008 · Cited by 37
Lin, G., Mao, D., & Bellen, H. J. (2016) · Current topics in developmental biology/Current Topics in Developmental Biology · doi:10.1016/bs.ctdb.2016.07.004 · Cited by 29
Fumagalli, L., Young, F. L., Boeynaems, S., Decker, M. D., Mehta, A. R., Swijsen, A., Fazal, R., Guo, W., Moisse, M., Beckers, J., et al. (2019) · doi:10.1101/835082 · Cited by 9
Self-citationRegulation of spliceosome by ALS-causative gene TDP-43
Tsuiji, H., Kataoka, A., & Yamanaka, K. (2011) · Neuroscience Research · doi:10.1016/j.neures.2011.07.436 · Cited by 1
Research works printed but not linked: 2
- van Es MA (2017) Amyotrophic lateral sclerosis Overview & Practice Essentials. Medscape 377: 1602
- Soneson C, Love MI, Robinson MD (2016) Differential analyses for RNA‐seq: transcript‐level inferences. F1000Res 4: 1521 · DOI · Paper page
Cited by
Sorted by citations
Microbiota–gut–brain axis and its therapeutic applications in neurodegenerative diseases
Loh, J. S., Mak, W. Q., Tan, L. K. S., Ng, C. X., Chan, H. H., Yeow, S. H., Foo, J. B., Ong, Y. S., How, C. W., & Khaw, K. Y. (2024) · Signal Transduction and Targeted Therapy · doi:10.1038/s41392-024-01743-1 · Cited by 1,193
Current State and Future Directions in the Therapy of ALS
Tzeplaeff, L., Wilfling, S., Requardt, M. V., & Herdick, M. L. (2023) · Cells · doi:10.3390/cells12111523 · Cited by 171
Disruption of axonal transport in neurodegeneration
Berth, S. H., & Lloyd, T. E. (2023) · Journal of Clinical Investigation · doi:10.1172/jci168554 · Cited by 135
Dittlau, K. S., Krasnow, E. N., Fumagalli, L., Vandoorne, T., Baatsen, P., Kerstens, A., Giacomazzi, G., Pavie, B., Rossaert, E., Beckers, J., et al. (2021) · Stem Cell Reports · doi:10.1016/j.stemcr.2021.03.029 · Cited by 85
Self-citationTDP-43 pathology: From noxious assembly to therapeutic removal
Keating, S. S., Gil, R. S., Swanson, M. E. V., Scotter, E. L., & Walker, A. K. (2022) · Progress in Neurobiology · doi:10.1016/j.pneurobio.2022.102229 · Cited by 81
Metadata
- Authors
- Fazal, R., Boeynaems, S., Swijsen, A., De Decker, M., Fumagalli, L., Moisse, M., Vanneste, J., Guo, W., Boon, R., Vercruysse, T., Eggermont, K., Swinnen, B., Beckers, J., Pakravan, D., Vandoorne, T., Vanden Berghe, P., Verfaillie, C., Van Den Bosch, L., & Van Damme, P.
- Affiliations
- VIB-KU Leuven Center for Brain & Disease Research (BE)
- Stanford Medicine (US)
- Leuven Stem Cell Institute (BE)
- Rega Institute for Medical Research (BE)
- Universitair Ziekenhuis Leuven (BE)
- ORCID
- Venue
- The EMBO Journal
- Published
- 2021-03-10
- Volume
- 40
- Issue
- 7
- Pages
- e106177-e106177
- ISSN
- 0261-4189 (ISSN-L)
- 1460-2075
- PMC
- PMC8013789
- OpenAlex
- W3133763219
- Cited by
- 108
- References
- 88
- Citations by year
- 2026: 15 · 2025: 25 · 2024: 26 · 2023: 18 · 2022: 19 · 2021: 5
- FWCI
- 8.10
- Type
- journal article
- Language
- en
- Open access
- hybrid
- doi.org
- Locations
- The EMBO Journal (publishedVersion, cc-by)
- PubMed Central (publishedVersion, cc-by)
- PubMed (publishedVersion)
- Lirias (KU Leuven) (submittedVersion, other-oa)
- Data Archiving and Networked Services (DANS) (submittedVersion, other-oa)
- Pure Amsterdam UMC (submittedVersion, cc-by)
- Funders
- Onderzoeksraad, KU Leuven (C1 ‐ C14‐17‐107)
- Katholieke Universiteit Leuven | Universitaire Ziekenhuizen Leuven, KU Leuven (C1 ‐ C14‐17‐107)
- Alzheimer's Research Foundation (SAO‐FRA n{degree sign} 2017/023)
- VIND (135043)
- Fonds Wetenschappelijk Onderzoek (G.0909.15, G0A7418N)
- Agentschap voor Innovatie door Wetenschap en Technologie (150031)
- The european E‐Rare‐3 project INTEGRALS
- The ALS Liga Belgie
- KULeuven fund "een hart voor ALS"
- Laeversfonds voor ALS onderzoek
- Valery Perrier Race against ALS fund
- National lottery Belgium
- Target ALS
- E. von Behring Chair for Neuromuscular Disorders
- EMBO Long‐term Fellowship
- Topics
- Health Sciences › Medicine › Clinical Neurology › Amyotrophic Lateral Sclerosis Research
- Life Sciences › Neuroscience › Cellular and Molecular Neuroscience › Alzheimer's disease research and treatments
- Life Sciences › Neuroscience › Cellular and Molecular Neuroscience › Hereditary Neurological Disorders
- Keywords
- TDP-43, TARDBP mutations, HDAC6 inhibition, amyotrophic lateral sclerosis, motor neurons, axonal transport, mitochondrial transport, proteinopathies, TDP-43 mislocalization, protein-protein interaction network, iPSC-derived motor neurons, frontotemporal dementia, therapeutic target
- MeSH terms
- Histone Deacetylase 6, Amyotrophic Lateral Sclerosis, Axonal Transport, Cells, Cultured, DNA-Binding Proteins, Humans, Mitochondria, Motor Neurons, Mutation, Missense, Histone Deacetylase Inhibitors, Induced Pluripotent Stem Cells
About these checks
Registry, retraction, Cites and statistics results are computed, not judged, with one exception: a printed reference that no index lists is read once by a model before it counts as a citation error. Claims are extracted by a model and kept only when their quote appears verbatim in the text; each cited source is then checked, with a model’s help, for whether it says what the claim relies on. Those verdicts can be wrong — read the claim’s quote and the cited source before relying on one.
Statistics and arithmetic are recomputed, not judged.
Confidence bands are shown only for fields calibrated on our annotated test set. None is calibrated yet, so no band is shown.
What counts as a claim ›How we measure confidence ›How we check this ›
Are you an author, or do you see a problem with this page? Request a review
