CoChat

Hypoxia and loss of PHD2 inactivate stromal fibroblasts to decrease tumour stiffness and metastasis

Open access

The DOI matches its Crossref record; 64 of the 66 references it cites were found in a registry or an index.

Abstract

Cancer-associated fibroblasts (CAFs) interact with tumour cells and promote growth and metastasis. Here, we show that CAF activation is reversible: chronic hypoxia deactivates CAFs, resulting in the loss of contractile force, reduced remodelling of the surrounding extracellular matrix and, ultimately, impaired CAF-mediated cancer cell invasion. Hypoxia inhibits prolyl hydroxylase domain protein 2 (PHD2), leading to hypoxia-inducible factor (HIF)-1α stabilisation, reduced expression of αSMA and periostin, and reduced myosin II activity. Loss of PHD2 in CAFs phenocopies the effects of hypoxia, which can be prevented by simultaneous depletion of HIF-1α. Treatment with the PHD inhibitor DMOG in an orthotopic breast cancer model significantly decreases spontaneous metastases to the lungs and liver, associated with decreased tumour stiffness and fibroblast activation. PHD2 depletion in CAFs co-injected with tumour cells similarly prevents CAF-induced metastasis to lungs and liver. Our data argue that reversion of CAFs towards a less active state is possible and could have important clinical implications.

Overview

The claims and statistics of this paper haven’t been checked yet.

Free: it reads the open-access text and checks the first 5 claims that cite a source we can check. Create a free account to check every claim.

A few free checks a day · papers already verified open instantly · results are public

Integrity signals

Registry

Crossref · 10.15252/embr.201540107

Cites

64 of 64 references verified0 citation errors · 0 not checkable

Statistics

Figures

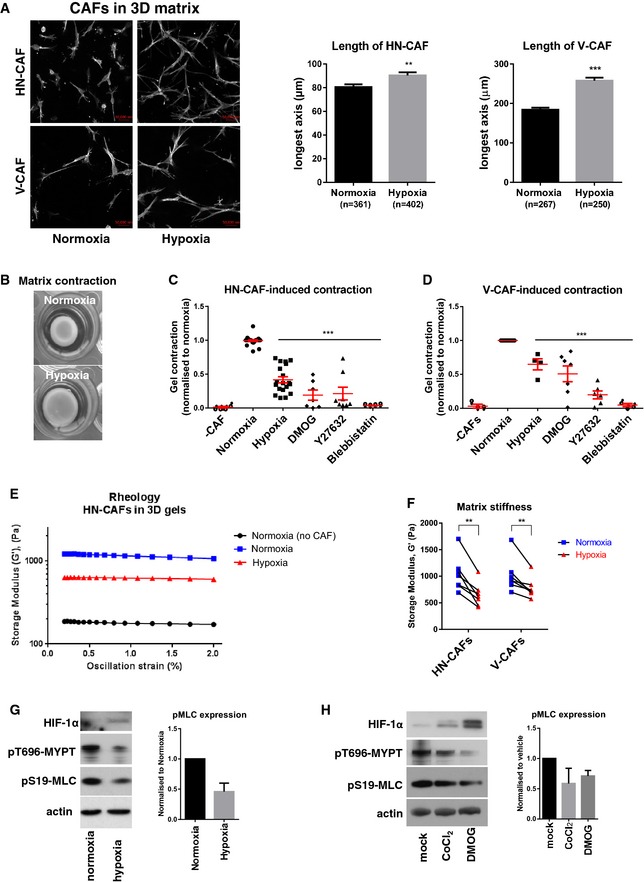
Figure 1 Hypoxia suppresses CAF‐induced matrix remodelling AF‐actin staining of human HN‐CAFs and V‐CAFs grown in 3D collagen I/Matrigels. The images are maximum projected for visualisation. Bars show quantification of the longest distance of HN‐CAFs grown in 3D collagen I/Matrigels, and of V‐CAFs plated on top of gels. Bars represent mean ± s.d. n = individual cells from three experimental repeats. **P < 0.01; ***P < 0.001; unpaired Student's t‐test (two‐tailed). Scale bar: 50 μm.BCAF‐induced contraction assay. Images show HN‐CAF‐induced contraction of collagen I/Matrigels after 72 h of remodelling under normoxia and hypoxia.C, DScatter plots show quantification of HN‐CAF (C)‐ and V‐CAF (D)‐induced contraction relative to normoxia. Each data point represents an independent experiment. Line and error bars indicate mean ± s.d. ***P < 0.001; one‐way ANOVA test.E, FMatrix stiffness under normoxia and hypoxia. The storage modulus (G') of collagen I/Matrigels was measured by shear rheology after 72 h of CAF remodelling. CAFs were still alive within gels upon measurement. (E) Storage modulus was always measured over a decade of oscillation strain from 0.2 to 2%. (F) Scatter plot shows storage modules of matched experiments. Each couple of match data points represents an independent experiment. **P < 0.01; paired Student's t‐test (two‐tailed).G, HImmunoblotting analyses of the contractile machinery in HN‐CAFs after 72 h under normoxia and hypoxia (G) and 72 h after treatment with hypoxia mimetic agents (H). Bars show quantification of mean ± s.d. phospho‐myosin light chain levels normalised to actin levels. n = 4 experimental repeats for hypoxia vs. normoxia. n = 2 experimental repeats for hypoxia mimetic agents.
Figure 1 Hypoxia suppresses CAF‐induced matrix remodelling AF‐actin staining of human HN‐CAFs and V‐CAFs grown in 3D collagen I/Matrigels. The images are maximum projected for visualisation. Bars show quantification of the longest distance of HN‐CAFs grown in 3D collagen I/Matrigels, and of V‐CAFs plated on top of gels. Bars represent mean ± s.d. n = individual cells from three experimental repeats. **P < 0.01; ***P < 0.001; unpaired Student's t‐test (two‐tailed). Scale bar: 50 μm.BCAF‐induced contraction assay. Images show HN‐CAF‐induced contraction of collagen I/Matrigels after 72 h of remodelling under normoxia and hypoxia.C, DScatter plots show quantification of HN‐CAF (C)‐ and V‐CAF (D)‐induced contraction relative to normoxia. Each data point represents an independent experiment. Line and error bars indicate mean ± s.d. ***P < 0.001; one‐way ANOVA test.E, FMatrix stiffness under normoxia and hypoxia. The storage modulus (G') of collagen I/Matrigels was measured by shear rheology after 72 h of CAF remodelling. CAFs were still alive within gels upon measurement. (E) Storage modulus was always measured over a decade of oscillation strain from 0.2 to 2%. (F) Scatter plot shows storage modules of matched experiments. Each couple of match data points represents an independent experiment. **P < 0.01; paired Student's t‐test (two‐tailed).G, HImmunoblotting analyses of the contractile machinery in HN‐CAFs after 72 h under normoxia and hypoxia (G) and 72 h after treatment with hypoxia mimetic agents (H). Bars show quantification of mean ± s.d. phospho‐myosin light chain levels normalised to actin levels. n = 4 experimental repeats for hypoxia vs. normoxia. n = 2 experimental repeats for hypoxia mimetic agents.CC BY · PubMed Central
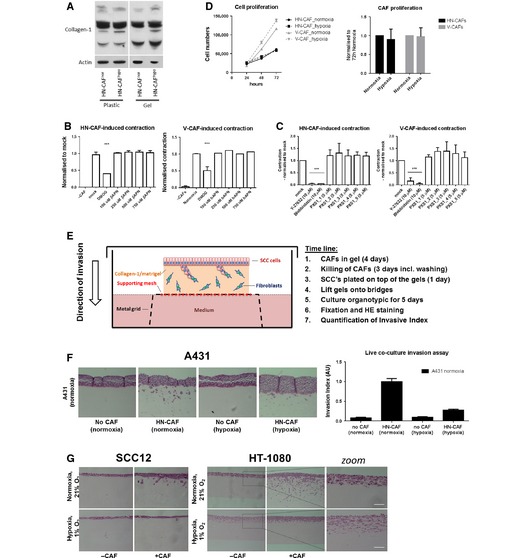
Figure EV1 Hypoxia suppresses CAF‐induced contraction and invasion AImmunoblotting analysis of collagen I.B, CBars shows quantification of HN‐CAF‐ and V‐CAF‐induced contraction relative to mock treatment. Bars represent mean ± s.d. n = individual cells from 3 experimental repeats. ***P < 0.001; unpaired Student's t‐test (two‐tailed).DProliferation assay of CAFs. Left graph shows mean ± s.d. growth over time. The graph shows a representative experiment done in triplicate. Bars represent mean ± s.d. growth after 72‐h incubation. n = 4 independent experimental repeats.ESchematic representation including time line of the organotypic co‐culture system used for studying CAF‐induced SCC invasion.F, GHN‐CAF‐induced cancer cell invasion. (F) H&E‐stained sections of A431 cells co‐cultured in an organotypic system in the presence of HN‐CAFs. Bars shows mean ± s.d. invasive index of A431 cancer cell invasion. n = 5 experimental points from 2 independent experiments. (G) H&E‐stained sections of SCC12 and HT‐1080 co‐cultured in an organotypic system in the presence of HN‐CAFs. Zoomed images demonstrate that HT‐1080 cell alone induces invasion in hypoxia. Scale bar: 100 μm.
Figure EV1 Hypoxia suppresses CAF‐induced contraction and invasion AImmunoblotting analysis of collagen I.B, CBars shows quantification of HN‐CAF‐ and V‐CAF‐induced contraction relative to mock treatment. Bars represent mean ± s.d. n = individual cells from 3 experimental repeats. ***P < 0.001; unpaired Student's t‐test (two‐tailed).DProliferation assay of CAFs. Left graph shows mean ± s.d. growth over time. The graph shows a representative experiment done in triplicate. Bars represent mean ± s.d. growth after 72‐h incubation. n = 4 independent experimental repeats.ESchematic representation including time line of the organotypic co‐culture system used for studying CAF‐induced SCC invasion.F, GHN‐CAF‐induced cancer cell invasion. (F) H&E‐stained sections of A431 cells co‐cultured in an organotypic system in the presence of HN‐CAFs. Bars shows mean ± s.d. invasive index of A431 cancer cell invasion. n = 5 experimental points from 2 independent experiments. (G) H&E‐stained sections of SCC12 and HT‐1080 co‐cultured in an organotypic system in the presence of HN‐CAFs. Zoomed images demonstrate that HT‐1080 cell alone induces invasion in hypoxia. Scale bar: 100 μm.CC BY · PubMed Central
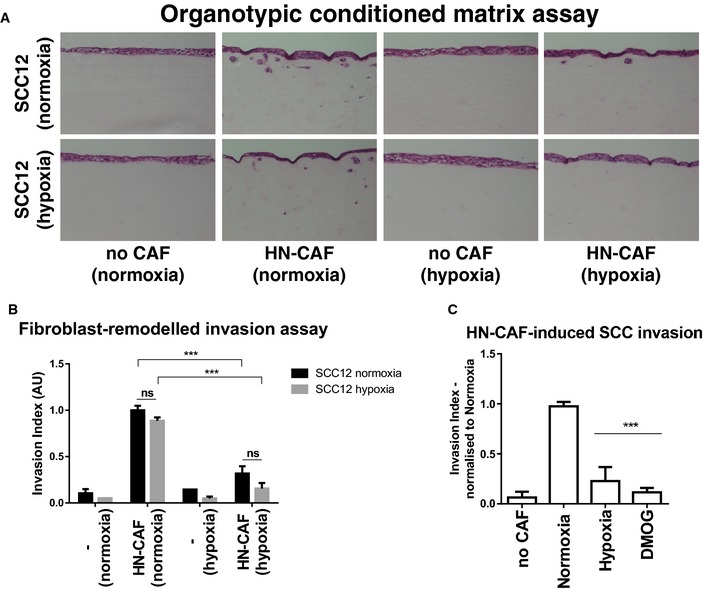
Figure 2 Hypoxia suppresses CAF‐induced cancer cell invasion Organotypic invasion assay. H&E‐stained sections of SCC12 cells cultured in the organotypic system in the absence or presence of HN‐CAFs, and under normoxic and hypoxic conditions.SCC12 invasion. Bars show quantification of SCC12 invasion in normoxia and hypoxia. Bars represent mean ± s.d. n > 3 experimental repeats. ns, non‐significant; ***P < 0.001; unpaired Student's t‐test (two‐tailed).Bars show quantification of SCC12 invasion relative to normoxia. Bars represent mean ± s.d. n > 3 experimental repeats. ***P < 0.001; unpaired Student's t‐test (two‐tailed).
Figure 2 Hypoxia suppresses CAF‐induced cancer cell invasion Organotypic invasion assay. H&E‐stained sections of SCC12 cells cultured in the organotypic system in the absence or presence of HN‐CAFs, and under normoxic and hypoxic conditions.SCC12 invasion. Bars show quantification of SCC12 invasion in normoxia and hypoxia. Bars represent mean ± s.d. n > 3 experimental repeats. ns, non‐significant; ***P < 0.001; unpaired Student's t‐test (two‐tailed).Bars show quantification of SCC12 invasion relative to normoxia. Bars represent mean ± s.d. n > 3 experimental repeats. ***P < 0.001; unpaired Student's t‐test (two‐tailed).CC BY · PubMed Central
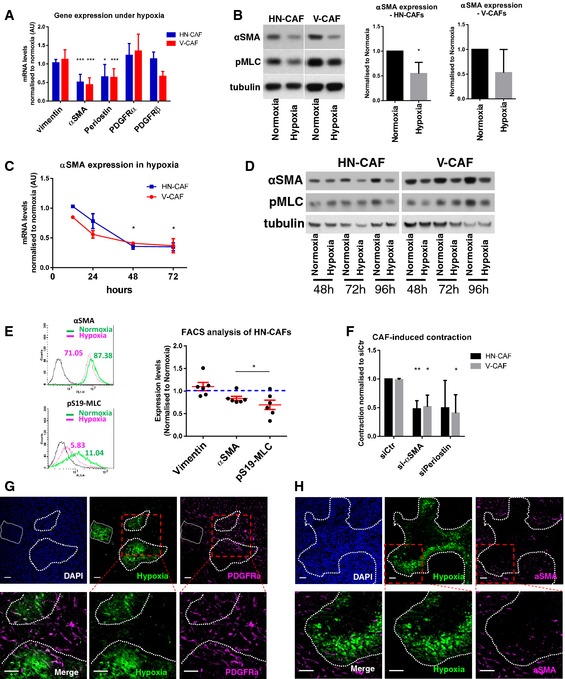
Figure 3 Hypoxia suppresses CAF activation ACAF markers in hypoxia. Bars show mean ± s.d. mRNA levels quantified by qPCR after 48 h of hypoxic incubation. mRNA levels are normalised to normoxic levels. CAFs were plated on collagen I gels. n > 3 experimental repeats. *P < 0.05; ***P < 0.001; unpaired Student's t‐test (two‐tailed).BImmunoblotting analyses of αSMA and phospho‐S19‐MLC levels after 72 h in normoxia and hypoxia. CAFs were plated on gels. Bars show quantification of mean ± s.d. αSMA protein levels normalised to tubulin levels. n > 3 experimental repeats. *P < 0.05; unpaired Student's t‐test (two‐tailed).CTime course of αSMA expression in hypoxia. Graph shows the mean ± s.d. mRNA levels of αSMA quantified by qPCR. mRNA levels are normalised to normoxic levels. *P < 0.05; unpaired Student's t‐test (two‐tailed). n = 2 independent experiments each done in triplicate.DTime course of αSMA and phospho‐S19‐MLC protein levels in CAFs incubated under hypoxia.EFlow cytometry of αSMA and phospho‐S19‐MLC. HN‐CAFs were subjected to flow cytometry analyses after 72 h in normoxia and hypoxia. Mean fluorescence intensity is shown from one representative experiment. Scatter plot shows quantification of αSMA and pS19‐MLC levels relative to normoxia. Each data point represents an independent experiment. Line and error bars indicate mean ± s.d. *P < 0.05; unpaired Student's t‐test (two‐tailed).FsiRNA‐transfected CAFs were subjected to contraction assay. Bars shows mean ± s.d. quantification of CAF‐induced contraction relative to normoxia siRNA control cells (siCtr). n > 3 experimental repeats. *P < 0.05; **P < 0.01; unpaired Student's t‐test (two‐tailed).G, HBALB/c mice were orthotopically injected with 4T1 breast cancer cells. After 3 weeks of tumour growth, mice were i.p. injected with the hypoxyprobe pimonidazole and sacrificed 1 h later. The primary tumour was then excised and stained for hypoxia, PDGFRα (G) and αSMA (H). The dotted lines represent the border of the hypoxic region. Lower panels represent the zoomed area depicted in red. Scale bar: 50 μm.
Figure 3 Hypoxia suppresses CAF activation ACAF markers in hypoxia. Bars show mean ± s.d. mRNA levels quantified by qPCR after 48 h of hypoxic incubation. mRNA levels are normalised to normoxic levels. CAFs were plated on collagen I gels. n > 3 experimental repeats. *P < 0.05; ***P < 0.001; unpaired Student's t‐test (two‐tailed).BImmunoblotting analyses of αSMA and phospho‐S19‐MLC levels after 72 h in normoxia and hypoxia. CAFs were plated on gels. Bars show quantification of mean ± s.d. αSMA protein levels normalised to tubulin levels. n > 3 experimental repeats. *P < 0.05; unpaired Student's t‐test (two‐tailed).CTime course of αSMA expression in hypoxia. Graph shows the mean ± s.d. mRNA levels of αSMA quantified by qPCR. mRNA levels are normalised to normoxic levels. *P < 0.05; unpaired Student's t‐test (two‐tailed). n = 2 independent experiments each done in triplicate.DTime course of αSMA and phospho‐S19‐MLC protein levels in CAFs incubated under hypoxia.EFlow cytometry of αSMA and phospho‐S19‐MLC. HN‐CAFs were subjected to flow cytometry analyses after 72 h in normoxia and hypoxia. Mean fluorescence intensity is shown from one representative experiment. Scatter plot shows quantification of αSMA and pS19‐MLC levels relative to normoxia. Each data point represents an independent experiment. Line and error bars indicate mean ± s.d. *P < 0.05; unpaired Student's t‐test (two‐tailed).FsiRNA‐transfected CAFs were subjected to contraction assay. Bars shows mean ± s.d. quantification of CAF‐induced contraction relative to normoxia siRNA control cells (siCtr). n > 3 experimental repeats. *P < 0.05; **P < 0.01; unpaired Student's t‐test (two‐tailed).G, HBALB/c mice were orthotopically injected with 4T1 breast cancer cells. After 3 weeks of tumour growth, mice were i.p. injected with the hypoxyprobe pimonidazole and sacrificed 1 h later. The primary tumour was then excised and stained for hypoxia, PDGFRα (G) and αSMA (H). The dotted lines represent the border of the hypoxic region. Lower panels represent the zoomed area depicted in red. Scale bar: 50 μm.CC BY · PubMed Central
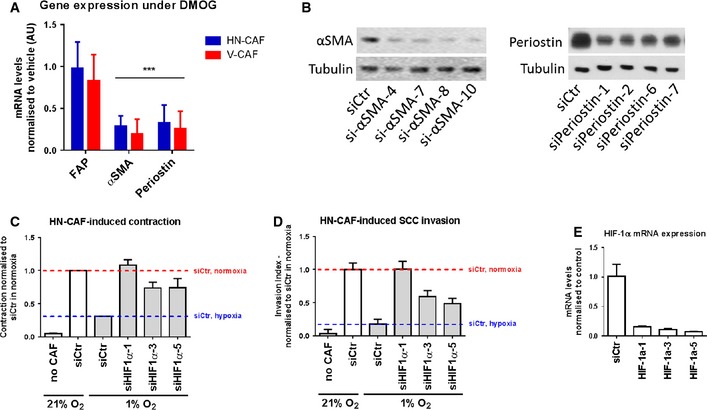
Figure EV2 Hypoxia suppresses CAF activation AqPCR analysis of gene expression levels of various CAF activation markers after 72 h of DMOG treatment. Bars show mean ± s.d. mRNA levels quantified by qPCR and normalised to vehicle treatment (DMSO). ***P < 0.001, unpaired Student's t‐test (two‐tailed).BValidation of siRNA knock‐down of αSMA (left panel) and periostin (right panel) by Western blotting.C, DDepletion of HIF‐1α using multiple siRNAs rescues loss of HN‐CAF‐induced contraction and invasion observed in hypoxia. Bars show quantification of HN‐CAF‐induced contraction (C) and HN‐CAF‐induced SCC12 cancer cell invasion (D). Bars show mean ± s.d. n = 2 experimental repeats.EValidation of siRNA knock‐downs of HIF‐1α by qPCR. Bars show mean ± s.d. n = 3 experimental repeats.
Figure EV2 Hypoxia suppresses CAF activation AqPCR analysis of gene expression levels of various CAF activation markers after 72 h of DMOG treatment. Bars show mean ± s.d. mRNA levels quantified by qPCR and normalised to vehicle treatment (DMSO). ***P < 0.001, unpaired Student's t‐test (two‐tailed).BValidation of siRNA knock‐down of αSMA (left panel) and periostin (right panel) by Western blotting.C, DDepletion of HIF‐1α using multiple siRNAs rescues loss of HN‐CAF‐induced contraction and invasion observed in hypoxia. Bars show quantification of HN‐CAF‐induced contraction (C) and HN‐CAF‐induced SCC12 cancer cell invasion (D). Bars show mean ± s.d. n = 2 experimental repeats.EValidation of siRNA knock‐downs of HIF‐1α by qPCR. Bars show mean ± s.d. n = 3 experimental repeats.CC BY · PubMed Central
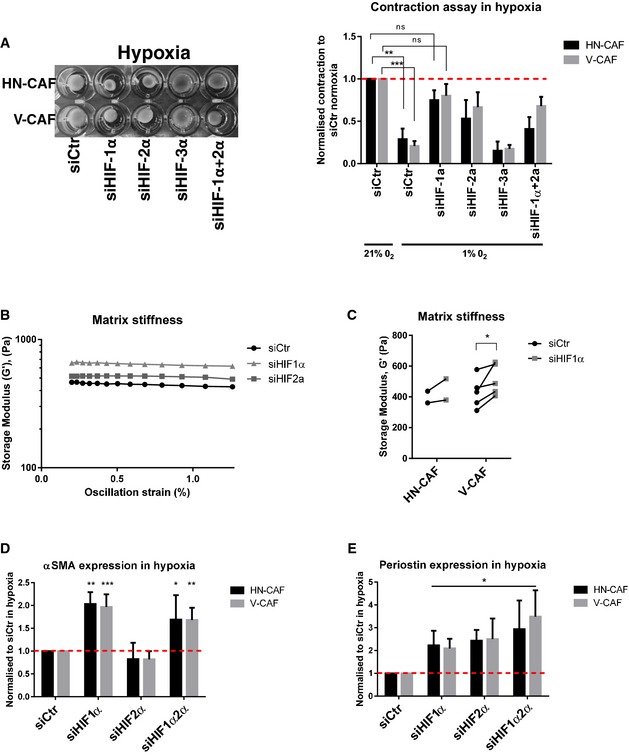
Figure 4 HIF‐1α supports CAF‐induced matrix remodelling and invasion ASiRNA‐depleted CAFs were plated within collagen I/Matrigels and allowed to contract for 72 h under hypoxic conditions. Left panels show images of contraction. Bars shows mean ± s.d. quantification of contraction normalised to siRNA control in normoxia. n > 3 experimental repeats. ns, non‐significant; **P < 0.01; ***P < 0.001; unpaired Student's t‐test (two‐tailed).B, CMatrix stiffness upon depletion of HIFs. Shear rheology of collagen I/Matrigels was performed 96 h after siRNA transfection. (B) Storage modulus was always measured over a decade of oscillation strain from 0.2 to 2%. (C) Scatter plot shows storage modules of matched experiments (siCtr vs siHIF1a). Each couple of match data points represents an independent experiment. *P < 0.05; paired Student's t‐test (two‐tailed).D, EHIFs regulate αSMA and periostin mRNA levels. CAFs were siRNA‐depleted for HIFs, and mRNA levels of αSMA (D) and periostin (E) were quantified by qPCR 72 h post‐transfection. CAFs were plated on gels under hypoxic conditions. Bars shows mean ± s.d. n > 3 experimental repeats. *P < 0.05; **P < 0.01; ***P < 0.001; unpaired Student's t‐test (two‐tailed).
Figure 4 HIF‐1α supports CAF‐induced matrix remodelling and invasion ASiRNA‐depleted CAFs were plated within collagen I/Matrigels and allowed to contract for 72 h under hypoxic conditions. Left panels show images of contraction. Bars shows mean ± s.d. quantification of contraction normalised to siRNA control in normoxia. n > 3 experimental repeats. ns, non‐significant; **P < 0.01; ***P < 0.001; unpaired Student's t‐test (two‐tailed).B, CMatrix stiffness upon depletion of HIFs. Shear rheology of collagen I/Matrigels was performed 96 h after siRNA transfection. (B) Storage modulus was always measured over a decade of oscillation strain from 0.2 to 2%. (C) Scatter plot shows storage modules of matched experiments (siCtr vs siHIF1a). Each couple of match data points represents an independent experiment. *P < 0.05; paired Student's t‐test (two‐tailed).D, EHIFs regulate αSMA and periostin mRNA levels. CAFs were siRNA‐depleted for HIFs, and mRNA levels of αSMA (D) and periostin (E) were quantified by qPCR 72 h post‐transfection. CAFs were plated on gels under hypoxic conditions. Bars shows mean ± s.d. n > 3 experimental repeats. *P < 0.05; **P < 0.01; ***P < 0.001; unpaired Student's t‐test (two‐tailed).CC BY · PubMed Central
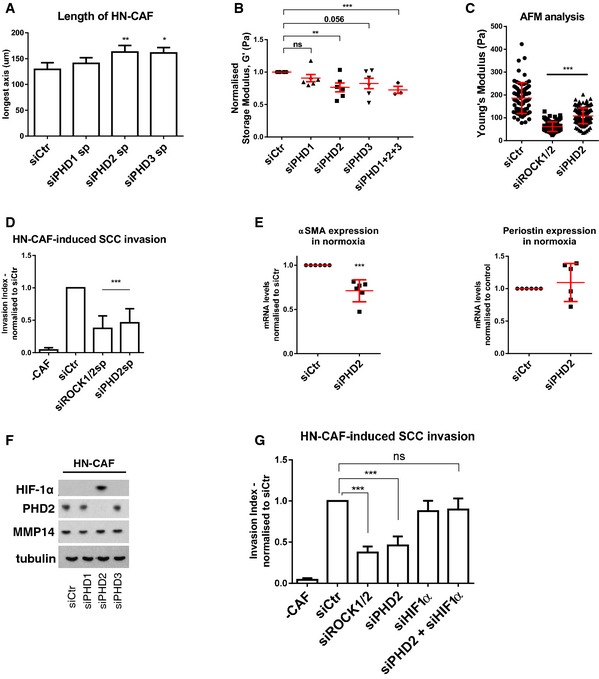
Figure 5 PHD2 supports CAF‐induced matrix remodelling and invasion Depletion of PHD1–3 using smart pools of siRNAs regulates HN‐CAF shape in 3D collagen I/Matrigels. Cells were fixed 72 h post‐transfection and stained for F‐actin. Bars show quantification of the longest distance of HN‐CAFs in 3D matrices. Bars represent mean ± s.e.m. of four experiments. *P < 0.05; **P < 0.01; one‐way ANOVA test.Matrix stiffness upon depletion of PHD1–3. Shear rheology of collagen I/Matrigels was performed after 72 h of CAF remodelling. Scatter plot shows storage modules of matrices normalised to control siRNA‐transfected HN‐CAFs. Each data point represents an independent experiment. Line and error bars indicate mean ± s.e.m. ns, non‐significant; **P < 0.01; ***P < 0.001; unpaired Student's t‐test (two‐tailed).Atomic force microscopy of siRNA‐depleted HN‐CAFs. Scatter plot shows Young's modulus of matrices remodelled by HN‐CAFs. Each data point represents a single measurement. Line and error bars indicate mean ± s.d. ***P < 0.001; one‐way ANOVA test.Loss of PHD2 in HN‐CAF suppresses SCC12 cancer cell invasion. Bars represent mean ± s.d. n > 3 experimental repeats. ***P < 0.001; unpaired Student's t‐test (two‐tailed).PHD2 regulates αSMA and periostin mRNA levels. HN‐CAFs were siRNA‐depleted for PHD2, and mRNA levels of αSMA and periostin were quantified by qPCR 72 h post‐transfection. CAFs were plated on gels. n > 3 experimental repeats. ***P < 0.001; unpaired Student's t‐test (two‐tailed).Immunoblotting analyses of the HIF‐1α, PHD2 and MMP14. siRNA‐depleted HN‐CAFs were grown on gels for 72 h post‐transfection.HIF‐1α depletion rescues the effect observed by PHD2 depletion in HN‐CAFs‐induced cancer cell invasion assay. Bars show mean ± s.d. HN‐CAF‐induced SCC12 cancer cell invasion normalised to siCtr. n > 3 experimental repeats. ns, non‐significant; ***P < 0.001; unpaired Student's t‐test (two‐tailed).
Figure 5 PHD2 supports CAF‐induced matrix remodelling and invasion Depletion of PHD1–3 using smart pools of siRNAs regulates HN‐CAF shape in 3D collagen I/Matrigels. Cells were fixed 72 h post‐transfection and stained for F‐actin. Bars show quantification of the longest distance of HN‐CAFs in 3D matrices. Bars represent mean ± s.e.m. of four experiments. *P < 0.05; **P < 0.01; one‐way ANOVA test.Matrix stiffness upon depletion of PHD1–3. Shear rheology of collagen I/Matrigels was performed after 72 h of CAF remodelling. Scatter plot shows storage modules of matrices normalised to control siRNA‐transfected HN‐CAFs. Each data point represents an independent experiment. Line and error bars indicate mean ± s.e.m. ns, non‐significant; **P < 0.01; ***P < 0.001; unpaired Student's t‐test (two‐tailed).Atomic force microscopy of siRNA‐depleted HN‐CAFs. Scatter plot shows Young's modulus of matrices remodelled by HN‐CAFs. Each data point represents a single measurement. Line and error bars indicate mean ± s.d. ***P < 0.001; one‐way ANOVA test.Loss of PHD2 in HN‐CAF suppresses SCC12 cancer cell invasion. Bars represent mean ± s.d. n > 3 experimental repeats. ***P < 0.001; unpaired Student's t‐test (two‐tailed).PHD2 regulates αSMA and periostin mRNA levels. HN‐CAFs were siRNA‐depleted for PHD2, and mRNA levels of αSMA and periostin were quantified by qPCR 72 h post‐transfection. CAFs were plated on gels. n > 3 experimental repeats. ***P < 0.001; unpaired Student's t‐test (two‐tailed).Immunoblotting analyses of the HIF‐1α, PHD2 and MMP14. siRNA‐depleted HN‐CAFs were grown on gels for 72 h post‐transfection.HIF‐1α depletion rescues the effect observed by PHD2 depletion in HN‐CAFs‐induced cancer cell invasion assay. Bars show mean ± s.d. HN‐CAF‐induced SCC12 cancer cell invasion normalised to siCtr. n > 3 experimental repeats. ns, non‐significant; ***P < 0.001; unpaired Student's t‐test (two‐tailed).CC BY · PubMed Central
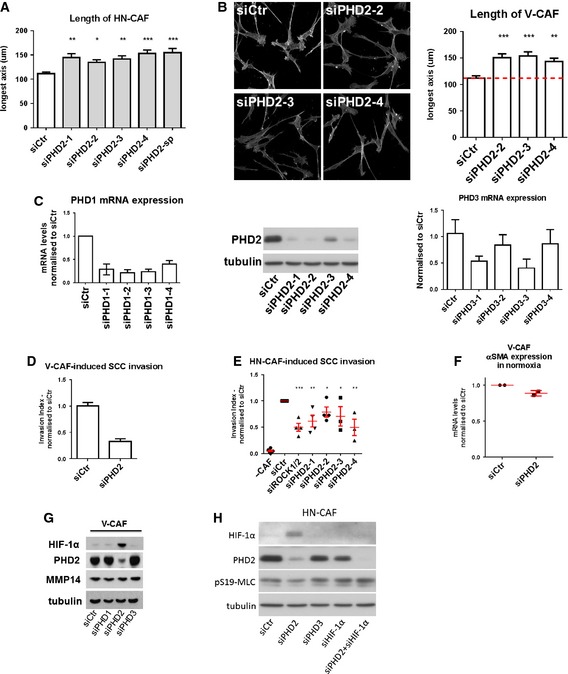
Figure EV3 Loss of PHD2 suppresses CAF‐induced matrix remodelling and invasion Bars show quantification of the longest distance of HN‐CAFs plated in 3D collagen I/Matrigels. Bars indicate mean ± s.d. *P < 0.05; **P < 0.01; ***P < 0.001; one‐way ANOVA test. n = 3 experimental repeats.F‐actin staining of V‐CAFs grown on top of collagen I/Matrigels. Bars show quantification of the longest distance of V‐CAFs. Bars indicate mean ± s.d. **P < 0.01; ***P < 0.001; one‐way ANOVA test. n = 2 experimental repeats.Validation of multiple siRNAs targeting PHD2 by Western blotting. Validation of multiple siRNAs targeting PHD1&3 by qPCR. Bars show mean ± s.d. n = 2 independent experimental repeats done in triplicate.Depletion of PHD2 decreases V‐CAF‐induced invasion. Bars show mean ± s.d. invasive index. n = 2 experimental repeats.Depletion of PHD2 using multiple siRNAs decreases HN‐CAF‐induced invasion. Bars show mean ± s.d. invasive index. n > 3 experimental repeats. *P < 0.05; **P < 0.01; ***P < 0.001; unpaired Student's t‐test (two‐tailed).PHD2 regulates αSMA mRNA levels. V‐CAFs were siRNA‐depleted for PHD2, and mRNA levels of αSMA were quantified by qPCR 72 h post‐transfection. CAFs were plated on gels. Each data point represents an independent experiment done in triplicate. Line and error bars indicate mean ± s.d.Immunoblotting analyses of the HIF‐1α, PHD2 and MMP14. siRNA‐depleted V‐CAFs were grown on gels for 72 h post‐transfection.Immunoblotting validation of the rescue experiment presented in Fig 5G.
Figure EV3 Loss of PHD2 suppresses CAF‐induced matrix remodelling and invasion Bars show quantification of the longest distance of HN‐CAFs plated in 3D collagen I/Matrigels. Bars indicate mean ± s.d. *P < 0.05; **P < 0.01; ***P < 0.001; one‐way ANOVA test. n = 3 experimental repeats.F‐actin staining of V‐CAFs grown on top of collagen I/Matrigels. Bars show quantification of the longest distance of V‐CAFs. Bars indicate mean ± s.d. **P < 0.01; ***P < 0.001; one‐way ANOVA test. n = 2 experimental repeats.Validation of multiple siRNAs targeting PHD2 by Western blotting. Validation of multiple siRNAs targeting PHD1&3 by qPCR. Bars show mean ± s.d. n = 2 independent experimental repeats done in triplicate.Depletion of PHD2 decreases V‐CAF‐induced invasion. Bars show mean ± s.d. invasive index. n = 2 experimental repeats.Depletion of PHD2 using multiple siRNAs decreases HN‐CAF‐induced invasion. Bars show mean ± s.d. invasive index. n > 3 experimental repeats. *P < 0.05; **P < 0.01; ***P < 0.001; unpaired Student's t‐test (two‐tailed).PHD2 regulates αSMA mRNA levels. V‐CAFs were siRNA‐depleted for PHD2, and mRNA levels of αSMA were quantified by qPCR 72 h post‐transfection. CAFs were plated on gels. Each data point represents an independent experiment done in triplicate. Line and error bars indicate mean ± s.d.Immunoblotting analyses of the HIF‐1α, PHD2 and MMP14. siRNA‐depleted V‐CAFs were grown on gels for 72 h post‐transfection.Immunoblotting validation of the rescue experiment presented in Fig 5G.CC BY · PubMed Central
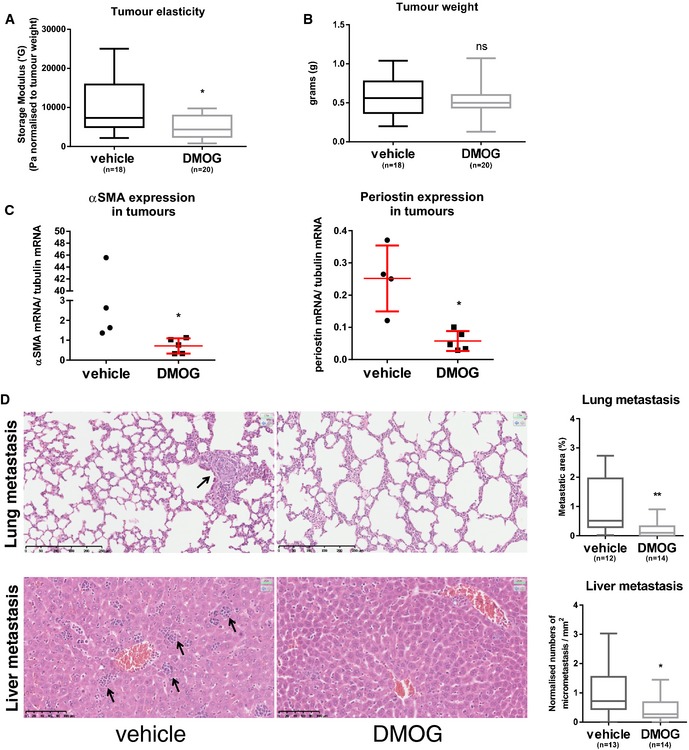
Figure 6 Targeting PHD suppresses tumour stiffness and metastasis A, BMice were orthotopically injected with 4T1 cells and treated with DMOG every second day. After 3 weeks, rheology was carried out on freshly excised primary tumour tissue. Four independent experiments were conducted. (A) Whisker plot shows storage modulus normalised to the total tumour weight of freshly excised primary breast tumour. (B) Whisker plot shows tumour weight. Number (n) of mice is indicated. Box and whiskers graph: line = median, box = distribution of 50% of values, whiskers = minimum to maximum. *P < 0.05; unpaired Student's t‐test (two‐tailed).CPeriostin and αSMA mRNA levels are reduced in primary tumour samples after DMOG treatment. Periostin and αSMA mRNA levels were quantified by qPCR and normalised to tubulin mRNA levels. Each data point represents a single tumour. Line and error bars indicate mean ± s.d. *P < 0.05; unpaired Student's t‐test (two‐tailed).DH&E sections of the lung and liver metastases. Arrows indicate metastases. Whisker plot shows the quantification of spontaneous metastases. Box and whiskers graph: line = median, box = distribution of 50% of values, whiskers = minimum to maximum. *P < 0.05; **P < 0.01; unpaired Student's t‐test (two‐tailed). Scale bars: lung (top), 250 μm; liver (bottom), 100 μm.
Figure 6 Targeting PHD suppresses tumour stiffness and metastasis A, BMice were orthotopically injected with 4T1 cells and treated with DMOG every second day. After 3 weeks, rheology was carried out on freshly excised primary tumour tissue. Four independent experiments were conducted. (A) Whisker plot shows storage modulus normalised to the total tumour weight of freshly excised primary breast tumour. (B) Whisker plot shows tumour weight. Number (n) of mice is indicated. Box and whiskers graph: line = median, box = distribution of 50% of values, whiskers = minimum to maximum. *P < 0.05; unpaired Student's t‐test (two‐tailed).CPeriostin and αSMA mRNA levels are reduced in primary tumour samples after DMOG treatment. Periostin and αSMA mRNA levels were quantified by qPCR and normalised to tubulin mRNA levels. Each data point represents a single tumour. Line and error bars indicate mean ± s.d. *P < 0.05; unpaired Student's t‐test (two‐tailed).DH&E sections of the lung and liver metastases. Arrows indicate metastases. Whisker plot shows the quantification of spontaneous metastases. Box and whiskers graph: line = median, box = distribution of 50% of values, whiskers = minimum to maximum. *P < 0.05; **P < 0.01; unpaired Student's t‐test (two‐tailed). Scale bars: lung (top), 250 μm; liver (bottom), 100 μm.CC BY · PubMed Central
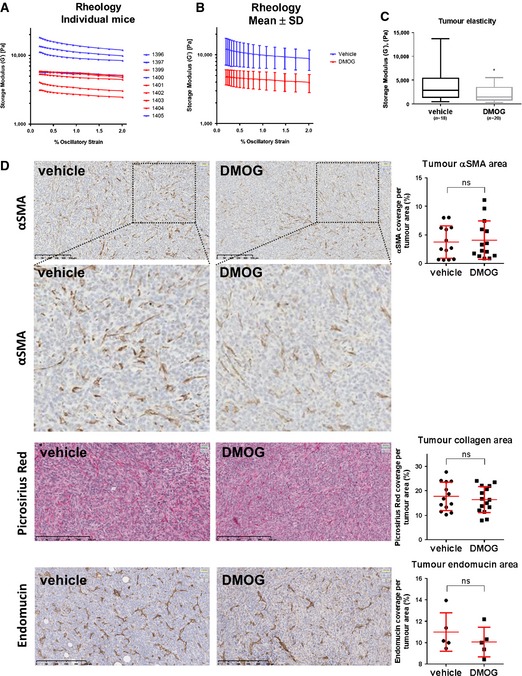
Figure EV4 DMOG treatment reduces tumour stiffness and metastasis A, BTumour stiffness. 4T1 cells were orthotopically injected into the fat pad of 8‐week‐old female BALB/c mice. After 1 week, the mice were injected i.p. with 8 mg DMOG every second day. The mammary tumours were excised after 3 weeks of DMOG treatment. Shear rheology was performed immediately on fresh mammary tumour tissue. (A) The graph shows each individual mouse from one independent experiment. Vehicle (PBS)‐treated mice are shown in blue and DMOG‐treated in red. (B) The graph shows the mean ± s.d. of the same experiment. Storage modulus was always measured over a decade of strain from 0.2% to 2% at a fixed angular frequency of 0.5 rad/s and a temperature of 21°C.CWhisker plot shows storage modulus of freshly excised primary breast tumour. Number (n) of mice is indicated. Box and whiskers graph: line = median, box = distribution of 50% of values, whiskers = minimum to maximum. *P < 0.05; unpaired Student's t‐test (two‐tailed).DIHC stainings of paraffin‐embedded tumour sections. Sections were stained for αSMA, picrosirius red (collagen I and III) and endomucin (blood vessels). Scatter plots show quantification of percentage of cell area covered in the section. Each data point represents one mouse. Line and error bars indicate mean ± s.d. ns, non‐significant; unpaired Student's t‐test (two‐tailed).
Figure EV4 DMOG treatment reduces tumour stiffness and metastasis A, BTumour stiffness. 4T1 cells were orthotopically injected into the fat pad of 8‐week‐old female BALB/c mice. After 1 week, the mice were injected i.p. with 8 mg DMOG every second day. The mammary tumours were excised after 3 weeks of DMOG treatment. Shear rheology was performed immediately on fresh mammary tumour tissue. (A) The graph shows each individual mouse from one independent experiment. Vehicle (PBS)‐treated mice are shown in blue and DMOG‐treated in red. (B) The graph shows the mean ± s.d. of the same experiment. Storage modulus was always measured over a decade of strain from 0.2% to 2% at a fixed angular frequency of 0.5 rad/s and a temperature of 21°C.CWhisker plot shows storage modulus of freshly excised primary breast tumour. Number (n) of mice is indicated. Box and whiskers graph: line = median, box = distribution of 50% of values, whiskers = minimum to maximum. *P < 0.05; unpaired Student's t‐test (two‐tailed).DIHC stainings of paraffin‐embedded tumour sections. Sections were stained for αSMA, picrosirius red (collagen I and III) and endomucin (blood vessels). Scatter plots show quantification of percentage of cell area covered in the section. Each data point represents one mouse. Line and error bars indicate mean ± s.d. ns, non‐significant; unpaired Student's t‐test (two‐tailed).CC BY · PubMed Central
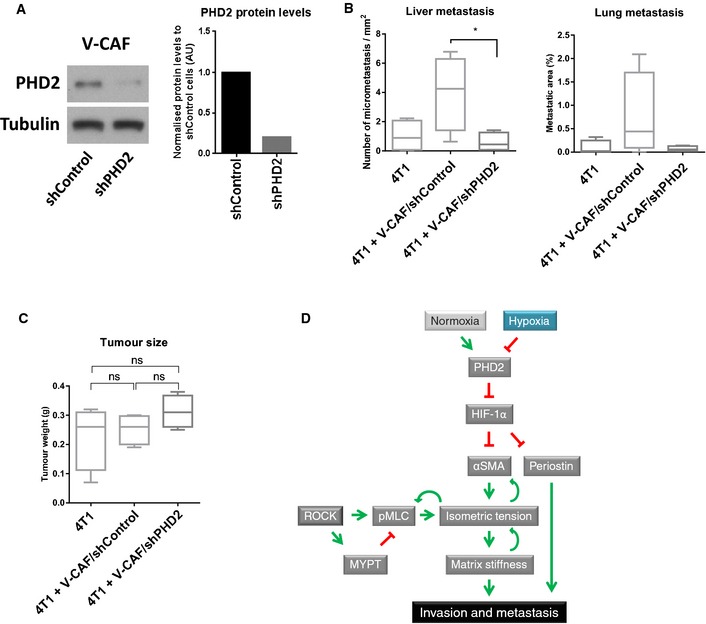
Figure 7 Loss of PHD2 in CAFs inhibits spontaneous metastasis APHD2 knock‐down efficiency of V‐CAF/shPHD2 cells compared to V‐CAF/shControl as demonstrated by Western blotting. Bars show quantification of PHD2 normalised to tubulin levels.B, CMice were orthotopically co‐injected with 4T1 cells and V‐CAF/shControl, V‐CAF/shPHD2. After 2 weeks, the tumours were taken out and processed. (B) Quantification of H&E sections of the lung and liver metastases. (C) Tumour size at the endpoint. Whisker plot shows the quantification of spontaneous metastases. Box and whiskers graph: line = median, box = distribution of 50% of values, whiskers = minimum to maximum. n = 4 mice per arm. ns, non‐significant; *P < 0.05; unpaired Student's t‐test (two‐tailed).DWorking model.
Figure 7 Loss of PHD2 in CAFs inhibits spontaneous metastasis APHD2 knock‐down efficiency of V‐CAF/shPHD2 cells compared to V‐CAF/shControl as demonstrated by Western blotting. Bars show quantification of PHD2 normalised to tubulin levels.B, CMice were orthotopically co‐injected with 4T1 cells and V‐CAF/shControl, V‐CAF/shPHD2. After 2 weeks, the tumours were taken out and processed. (B) Quantification of H&E sections of the lung and liver metastases. (C) Tumour size at the endpoint. Whisker plot shows the quantification of spontaneous metastases. Box and whiskers graph: line = median, box = distribution of 50% of values, whiskers = minimum to maximum. n = 4 mice per arm. ns, non‐significant; *P < 0.05; unpaired Student's t‐test (two‐tailed).DWorking model.CC BY · PubMed Central
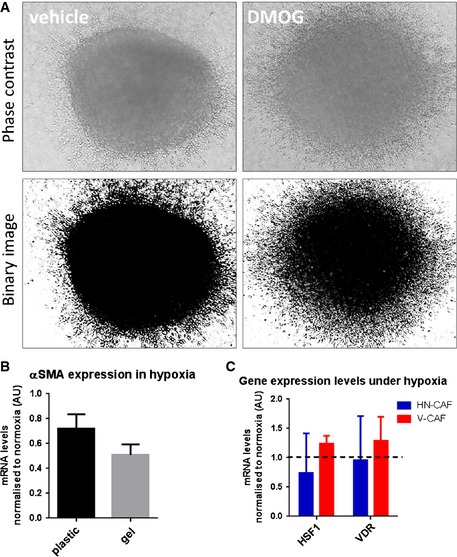
Figure EV5 4T1 spheroid invasion 4T1 spheroids were allowed to invade into a 3D collagen I/Matrigel for 72 h. Phase contrast images and binarised images are shown.αSMA mRNA levels after incubation on plastic and gels for 72 h in hypoxia. Bars show mean ± s.d. mRNA levels normalised to normoxic conditions. n > 3 experimental repeats.HSF1 and VDR mRNA levels 72 h in hypoxia. Bars show mean ± s.d. mRNA levels normalised to normoxic conditions. n = 3 experimental repeats.
Figure EV5 4T1 spheroid invasion 4T1 spheroids were allowed to invade into a 3D collagen I/Matrigel for 72 h. Phase contrast images and binarised images are shown.αSMA mRNA levels after incubation on plastic and gels for 72 h in hypoxia. Bars show mean ± s.d. mRNA levels normalised to normoxic conditions. n > 3 experimental repeats.HSF1 and VDR mRNA levels 72 h in hypoxia. Bars show mean ± s.d. mRNA levels normalised to normoxic conditions. n = 3 experimental repeats.CC BY · PubMed Central

Verification

Claims the paper makes

The claims and statistics of this paper haven’t been checked yet.

Free: it reads the open-access text and checks the first 5 claims that cite a source we can check. Create a free account to check every claim.

A few free checks a day · papers already verified open instantly · results are public

Claims other papers make about this one

Each is checked against this paper’s own text: does it say what the citing paper says it does?

Self-check

Percentages, sums and reported differences re-computed from the paper’s own numbers.

The self-check needs the paper’s full text.

Citations

Cites

2 retracted

Show all 64 references

Cited by

See all 173

Metadata

Authors
Madsen, C. D., Pedersen, J. T., Venning, F. A., Singh, L. B., Moeendarbary, E., Charras, G., Cox, T. R., Sahai, E., & Erler, J. T.
Affiliations
  • University of Copenhagen (DK)
  • Massachusetts Institute of Technology (US)
  • London Centre for Nanotechnology (GB)
  • The Francis Crick Institute (GB)
Corresponding author
  • Madsen, Chris D
  • Sahai, Erik
  • Erler, Janine T
Venue
The EMBO Reports
Published
2015-08-31
Volume
16
Issue
10
Pages
1394-1408
ISSN
  • 1469-221X (ISSN-L)
  • 1469-3178
OpenAlex
W1940485834
Cited by
157
References
66
Citations by year
2026: 10 · 2025: 11 · 2024: 18 · 2023: 18 · 2022: 15 · 2021: 15 · 2020: 16 · 2019: 15 · 2018: 12 · 2017: 13 · 2016: 10 · 2015: 2
FWCI
5.39
Type
journal article
Language
en
Open access
Licence
Locations
  • EMBO Reports (publishedVersion, other-oa)
  • PubMed Central (publishedVersion, cc-by)
  • PubMed (publishedVersion)
  • DSpace@MIT (Massachusetts Institute of Technology) (submittedVersion, cc-by-nc)
  • UCL Discovery (University College London) (submittedVersion)
  • Figshare (submittedVersion, cc-by)
  • Lund University Publications (Lund University) (submittedVersion)
  • Research at the University of Copenhagen (University of Copenhagen) (submittedVersion)
Funders
  • FEBS long‐term Fellowship
  • Wellcome Trust‐MIT Postdoctoral Fellowship
  • Cancer Research, UK (CRUK_A5317)
  • Francis Crick Institute
  • Novo Nordisk Foundation, Denmark
  • Hallas Møller Stipend
  • Danish Cancer Society (R117‐A7294‐B2731)
  • Danish Council for Independent Research YDUN (1084181001)
  • Innovation Fund Denmark (1311‐00010B)
Topics
  • Health Sciences › Medicine › Oncology › Cancer Cells and Metastasis
  • Life Sciences › Biochemistry, Genetics and Molecular Biology › Cancer Research › Cancer, Hypoxia, and Metabolism
  • Life Sciences › Biochemistry, Genetics and Molecular Biology › Molecular Biology › TGF-β signaling in diseases
Keywords
cancer-associated fibroblasts, hypoxia, PHD2, HIF-1α, tumor stiffness, metastasis, extracellular matrix remodeling, myosin II, alpha-smooth muscle actin, periostin, dimethyloxalylglycine, breast cancer, tumor microenvironment
MeSH terms
Amino Acids, Dicarboxylic, Animals, Breast, Cell Movement, Female, Fibroblasts, Humans, Mammary Neoplasms, Experimental, Neoplasm Invasiveness, Neoplasm Metastasis, Organ Culture Techniques, Tumor Cells, Cultured, Cell Hypoxia, Cell Adhesion Molecules, Stromal Cells, Myosin Type II, Mice, Hypoxia-Inducible Factor 1, alpha Subunit, Hypoxia-Inducible Factor-Proline Dioxygenases

About these checks

Registry, retraction, Cites and statistics results are computed, not judged, with one exception: a printed reference that no index lists is read once by a model before it counts as a citation error. Claims are extracted by a model and kept only when their quote appears verbatim in the text; each cited source is then checked, with a model’s help, for whether it says what the claim relies on. Those verdicts can be wrong — read the claim’s quote and the cited source before relying on one.

Statistics and arithmetic are recomputed, not judged.

Confidence bands are shown only for fields calibrated on our annotated test set. None is calibrated yet, so no band is shown.

What counts as a claim ›How we measure confidence ›How we check this ›

Are you an author, or do you see a problem with this page? Request a review

How to cite

Cite CoChat for the checks on this page, and the paper for its own findings.

This page
CoChat. (2026). Citation check: Hypoxia and loss of PHD2 inactivate stromal fibroblasts to decrease tumour stiffness and metastasis. https://app.cochat.ai/papers/10.15252/embr.201540107
The paper
Madsen, C. D., Pedersen, J. T., Venning, F. A., Singh, L. B., Moeendarbary, E., Charras, G., Cox, T. R., Sahai, E., & Erler, J. T. (2015). Hypoxia and loss of PHD2 inactivate stromal fibroblasts to decrease tumour stiffness and metastasis. The EMBO Reports. https://doi.org/10.15252/embr.201540107

Data sources

Bibliographic data: Semantic Scholar, OpenAlex, Crossref.

Contains information from the Semantic Scholar Academic Graph Datasets, made available under the ODC Attribution License (ODC-BY 1.0).

Semantic Scholar’s data is described in: Kinney, R., et al. (2023). The Semantic Scholar Open Data Platform. arXiv:2301.10140.