

The DOI matches its Crossref record; 69 of the 69 references it cites were found in a registry or an index.
TGFβ signaling directs serrated adenomas to the mesenchymal colorectal cancer subtype
Open accessAbstract
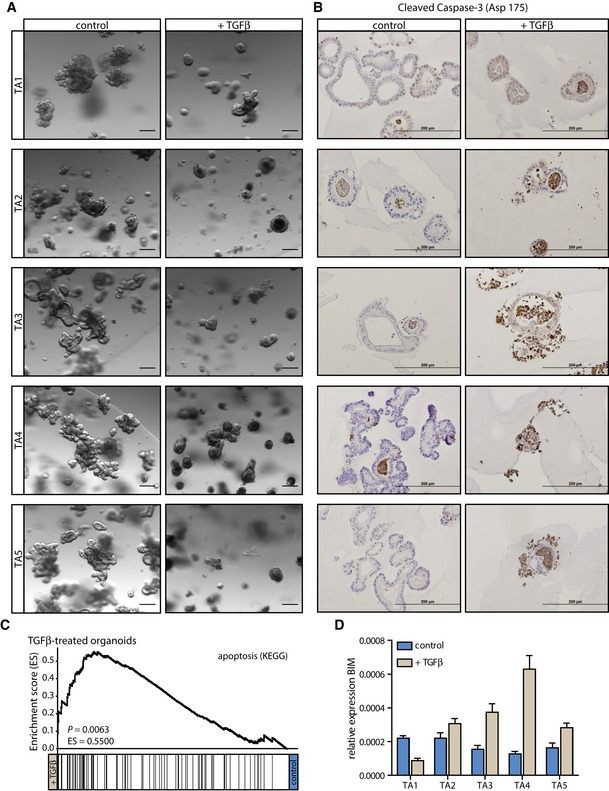
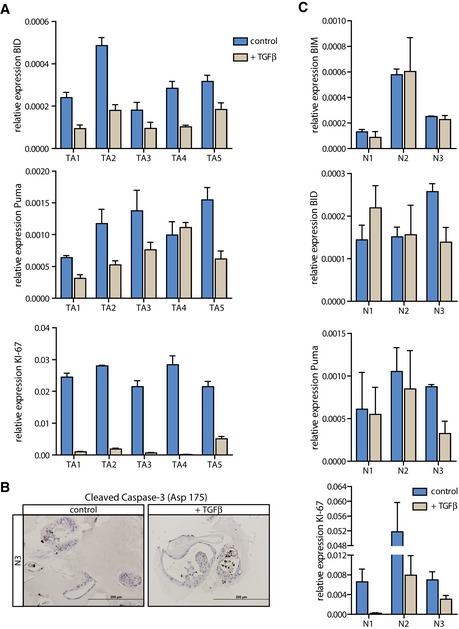
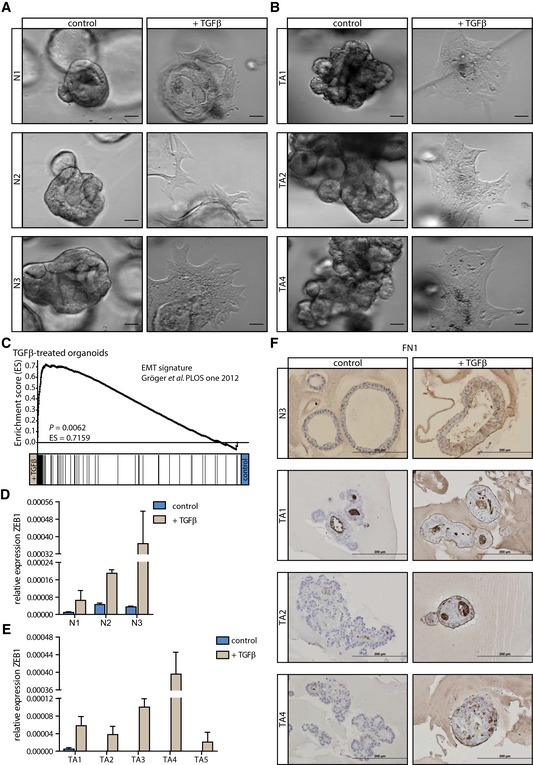
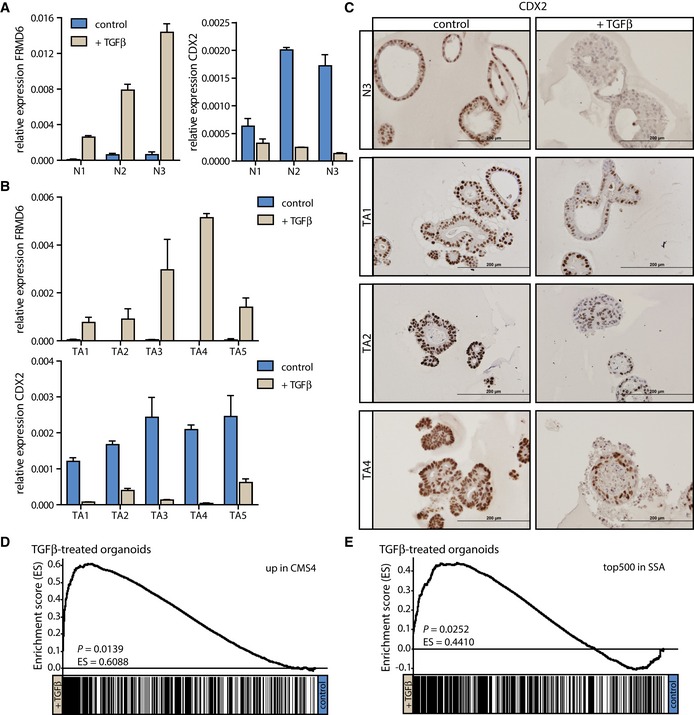
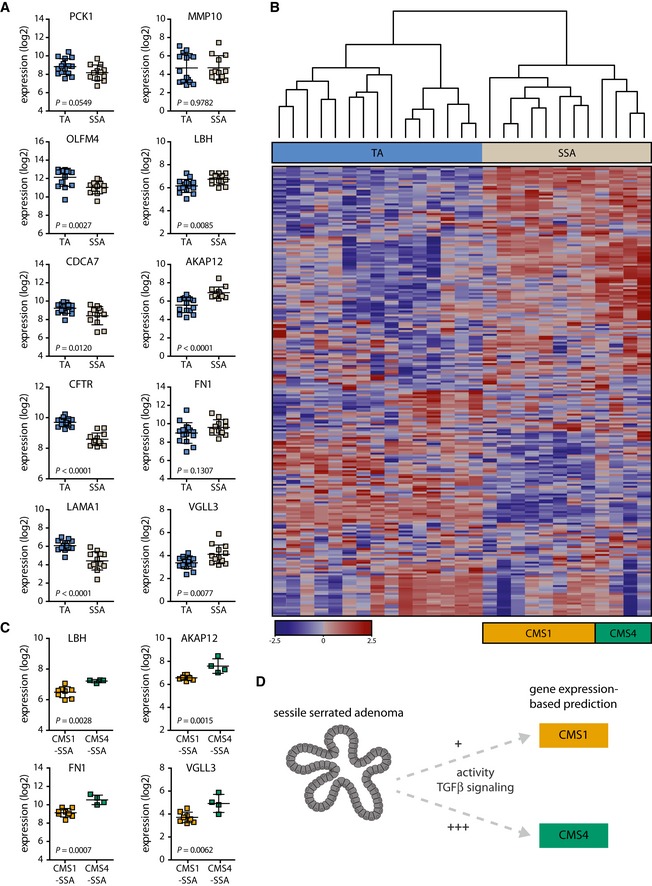
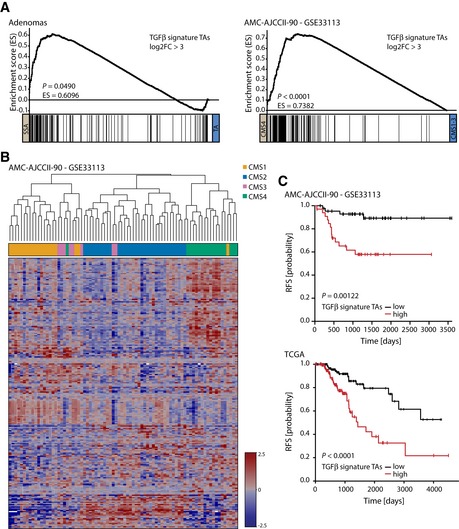
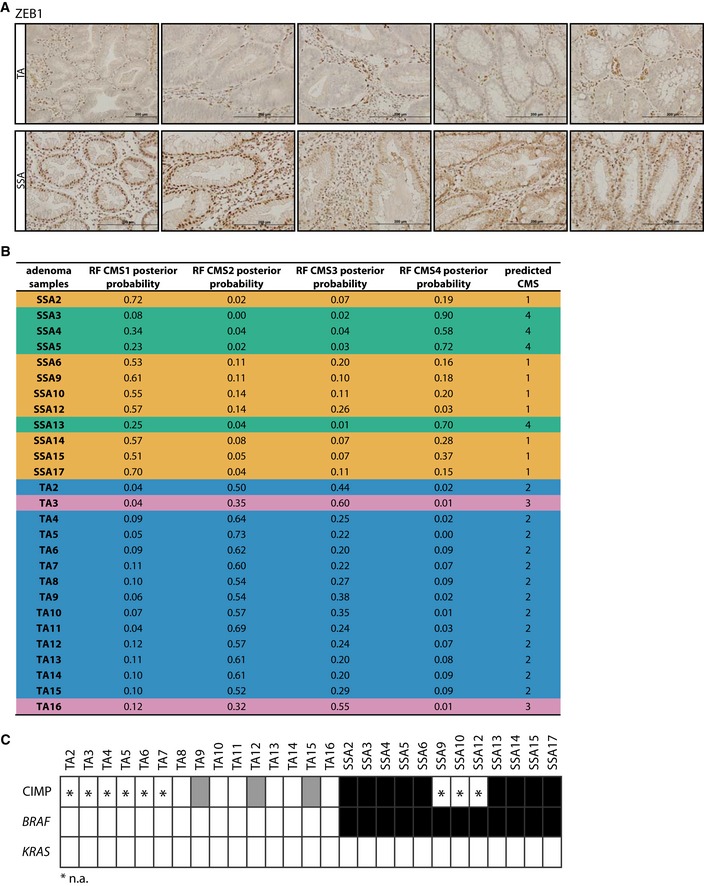
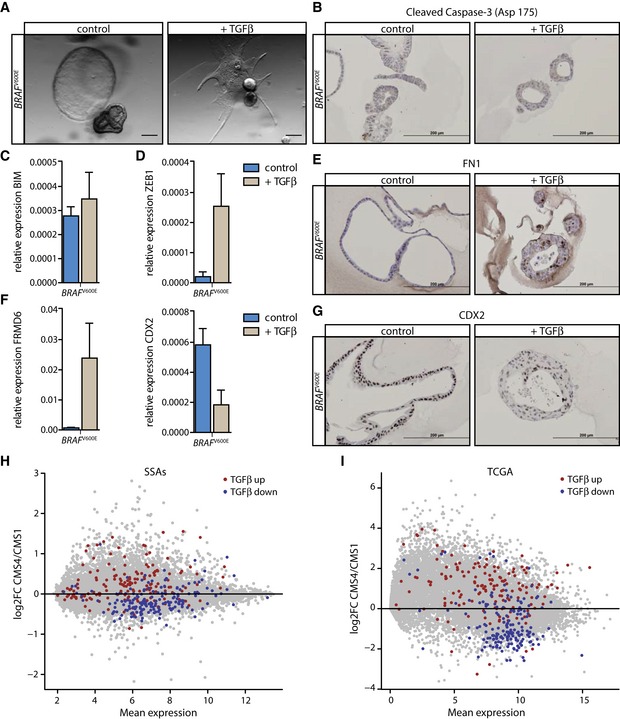
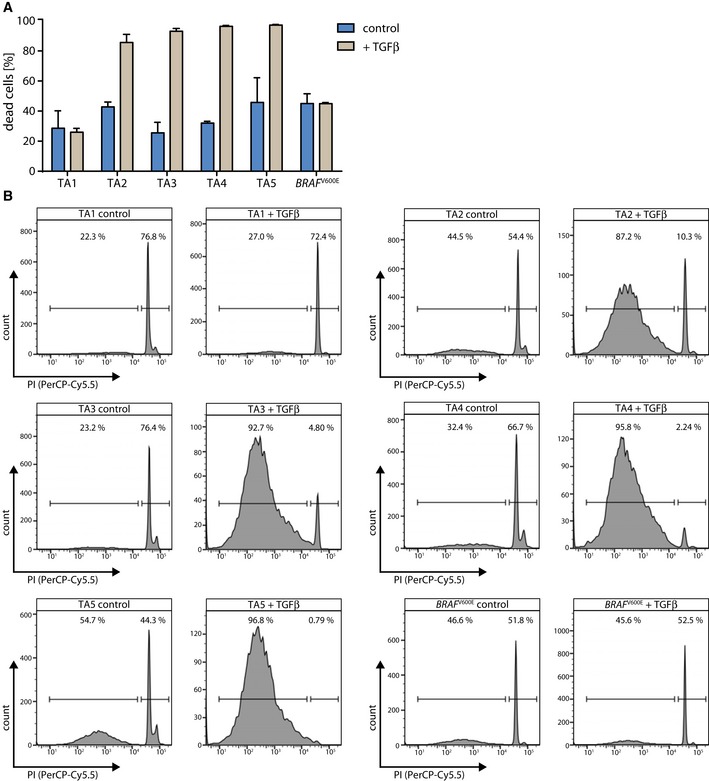
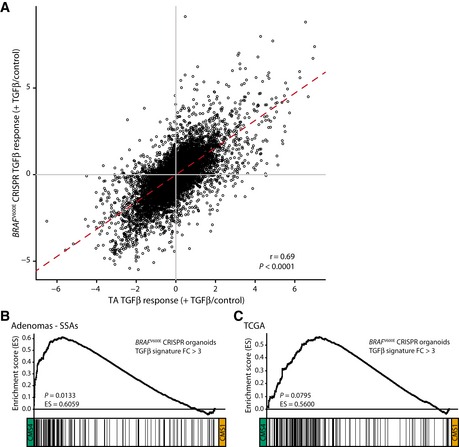
The heterogeneous nature of colorectal cancer (CRC) complicates prognosis and is suggested to be a determining factor in the efficacy of adjuvant therapy for individual patients. Based on gene expression profiling, CRC is currently classified into four consensus molecular subtypes (CMSs), characterized by specific biological programs, thus suggesting the existence of unifying developmental drivers for each CMS. Using human organoid cultures, we investigated the role of such developmental drivers at the premalignant stage of distinct CRC subtypes and found that TGFβ plays an important role in the development of the mesenchymal CMS4, which is of special interest due to its association with dismal prognosis. We show that in tubular adenomas (TAs), which progress to classical CRCs, the dominating response to TGFβ is death by apoptosis. By contrast, induction of a mesenchymal phenotype upon TGFβ treatment prevails in a genetically engineered organoid culture carrying a BRAFV600E mutation, constituting a model system for sessile serrated adenomas (SSAs). Our data indicate that TGFβ signaling is already active in SSA precursor lesions and that TGFβ is a critical cue for directing SSAs to the mesenchymal, poor‐prognosis CMS4 of CRC. Sessile serrated adenomas (SSAs)—precursor lesions of the serrated neoplasia pathway to colorectal cancer (CRC)—are predicted to give rise to either the good‐ or the poor‐prognosis CRC consensus molecular subtype (CMS1 and CMS4, respectively). Sessile serrated adenomas (SSAs)—precursor lesions of the serrated neoplasia pathway to colorectal cancer (CRC)—are predicted to give rise to either the good‐ or the poor‐prognosis CRC consensus molecular subtype (CMS1 and CMS4, respectively).
Overview
The claims and statistics of this paper haven’t been checked yet.
Run the check — free, no account needed. It reads the open-access text and checks the sources it cites.
Integrity signals
Registry
Cites
Statistics
Figures
Verification
Claims the paper makes
The claims and statistics of this paper haven’t been checked yet.
Run the check — free, no account needed. It reads the open-access text and checks the sources it cites.
Claims other papers make about this one
Each is checked against this paper’s own text: does it say what the citing paper says it does?
In the citing paper
“Follow-up studies have documented that TGFβ can direct human organoid cultures to a CMS4 profile (20)”
From Clinical Challenges of Consensus Molecular Subtype CMS4 Colon Cancer in the Era of Precision Medicine (2024) · cites this paper as [20]
Self-check
Percentages, sums and reported differences re-computed from the paper’s own numbers.
The self-check needs the paper’s full text.
Citations
Cites
Subramanian, A., Tamayo, P., Mootha, V. K., Mukherjee, S., Ebert, B. L., Gillette, M. A., Paulovich, A., Pomeroy, S. L., Golub, T. R., Lander, E. S., et al. (2005) · Proceedings of the National Academy of Sciences · doi:10.1073/pnas.0506580102 · Cited by 53,625
limma powers differential expression analyses for RNA-sequencing and microarray studies
Ritchie, M. E., Phipson, B., Wu, D., Hu, Y., Law, C. W., Shi, W., & Smyth, G. K. (2015) · Nucleic Acids Research · doi:10.1093/nar/gkv007 · Cited by 40,458
Multiplex Genome Engineering Using CRISPR/Cas Systems
Cong, L., Ran, F. A., Cox, D., Lin, S., Barretto, R., Habib, N., Hsu, P. D., Wu, X., Jiang, W., Marraffini, L. A., et al. (2013) · Science · doi:10.1126/science.1231143 · Cited by 15,339
A genetic model for colorectal tumorigenesis
Fearon, E. R., & Vogelstein, B. (1990) · Cell · doi:10.1016/0092-8674(90)90186-i · Cited by 12,132
Mootha, V. K., Lindgren, C. M., Eriksson, K.-F., Subramanian, A., Sihag, S., Lehar, J., Puigserver, P., Carlsson, E., Ridderstråle, M., Laurila, E., et al. (2003) · Nature Genetics · doi:10.1038/ng1180 · Cited by 10,197
RNA-Guided Human Genome Engineering via Cas9
Mali, P., Yang, L., Esvelt, K. M., Aach, J., Guell, M., DiCarlo, J. E., Norville, J. E., & Church, G. M. (2013) · Science · doi:10.1126/science.1232033 · Cited by 9,210
The Epithelial-Mesenchymal Transition Generates Cells with Properties of Stem Cells
Mani, S. A., Guo, W., Liao, M.-J., Eaton, E. N., Ayyanan, A., Zhou, A. Y., Brooks, M. W., Reinhard, F., Zhang, C. C., Shipitsin, M. V., et al. (2008) · Cell · doi:10.1016/j.cell.2008.03.027 · Cited by 8,839
Adjusting batch effects in microarray expression data using empirical Bayes methods
Johnson, W. E., Li, C., & Rabinovic, A. (2007) · Biostatistics · doi:10.1093/biostatistics/kxj037 · Cited by 8,658
Comprehensive molecular characterization of human colon and rectal cancer
The Cancer Genome Atlas Network (2012) · Nature · doi:10.1038/nature11252 · Cited by 8,499
Epithelial–mesenchymal transitions in tumour progression
Thiery, J. P. (2002) · Nature reviews. Cancer · doi:10.1038/nrc822 · Cited by 6,767
The consensus molecular subtypes of colorectal cancer
Guinney, J., Dienstmann, R., Wang, X., de Reyniès, A., Schlicker, A., Soneson, C., Marisa, L., Roepman, P., Nyamundanda, G., Angelino, P., et al. (2015) · Nature Medicine · doi:10.1038/nm.3967 · Cited by 5,170
Self-citationSummaries of Affymetrix GeneChip probe level data
Irizarry, R. A. (2003) · Nucleic Acids Research · doi:10.1093/nar/gng015 · Cited by 4,837
Nicoletti, I., Migliorati, G., Pagliacci, M. C., Grignani, F., & Riccardi, C. (1991) · Journal of Immunological Methods · doi:10.1016/0022-1759(91)90198-o · Cited by 4,562
Massagué, J. (2008) · Cell · doi:10.1016/j.cell.2008.07.001 · Cited by 3,907
Sato, T., Stange, D. E., Ferrante, M., Vries, R. G. J., van Es, J. H., van den Brink, S., van Houdt, W. J., Pronk, A., van Gorp, J., Siersema, P. D., et al. (2011) · Gastroenterology · doi:10.1053/j.gastro.2011.07.050 · Cited by 3,753
Self-citationMassagué, J. (2012) · Nature Reviews Molecular Cell Biology · doi:10.1038/nrm3434 · Cited by 3,239
Prospective Derivation of a Living Organoid Biobank of Colorectal Cancer Patients
van de Wetering, M., Francies, H. E., Francis, J. M., Bounova, G., Iorio, F., Pronk, A., van Houdt, W., van Gorp, J., Taylor-Weiner, A., Kester, L., et al. (2015) · Cell · doi:10.1016/j.cell.2015.03.053 · Cited by 2,408
Self-citationInactivation of the Type II TGF-β Receptor in Colon Cancer Cells with Microsatellite Instability
Markowitz, S. D., Wang, J., Myeroff, L. L., Parsons, R. E., Sun, L., Lutterbaugh, J., Fan, R. S., Zborowska, E., Kinzler, K. W., Vogelstein, B., et al. (1995) · Science · doi:10.1126/science.7761852 · Cited by 2,267
The evolution of cancer of the colon and rectum
Muto, T., Bussey, H. J. R., & Morson, B. C. (1975) · Cancer · doi:10.1002/cncr.2820360944 · Cited by 2,124
Zheng, X., Carstens, J. L., Kim, J., Scheible, M., Kaye, J. A., Sugimoto, H., Wu, C.-C., LeBleu, V. S., & Kalluri, R. (2015) · Nature · doi:10.1038/nature16064 · Cited by 2,018
pl5INK4B is a potentia| effector of TGF-β-induced cell cycle arrest
Hannon, G. J., & Beach, D. (1994) · Nature · doi:10.1038/371257a0 · Cited by 1,950
Targeted genome engineering in human cells with the Cas9 RNA-guided endonuclease
Cho, S. W., Kim, S., Kim, J. M., & Kim, J.-S. (2013) · Nature Biotechnology · doi:10.1038/nbt.2507 · Cited by 1,863
Fischer, K. R., Durrans, A., Lee, S., Sheng, J., Li, F., Wong, S. T. C., Choi, H., El Rayes, T., Ryu, S., Troeger, J., et al. (2015) · Nature · doi:10.1038/nature15748 · Cited by 1,791
Marisa, L., de Reyniès, A., Duval, A., Selves, J., Gaub, M. P., Vescovo, L., Etienne-Grimaldi, M.-C., Schiappa, R., Guenot, D., Ayadi, M., et al. (2013) · PLoS Medicine · doi:10.1371/journal.pmed.1001453 · Cited by 1,507
Jass, J. R. (2006) · Histopathology · doi:10.1111/j.1365-2559.2006.02549.x · Cited by 1,416
Stromal gene expression defines poor-prognosis subtypes in colorectal cancer
Calon, A., Lonardo, E., Berenguer-Llergo, A., Espinet, E., Hernando-Momblona, X., Iglesias, M., Sevillano, M., Palomo-Ponce, S., Tauriello, D. V. F., Byrom, D., et al. (2015) · Nature Genetics · doi:10.1038/ng.3225 · Cited by 1,070
Sequential cancer mutations in cultured human intestinal stem cells
Drost, J., van Jaarsveld, R. H., Ponsioen, B., Zimberlin, C., van Boxtel, R., Buijs, A., Sachs, N., Overmeer, R. M., Offerhaus, G. J., Begthel, H., et al. (2015) · Nature · doi:10.1038/nature14415 · Cited by 1,067
Self-citationDependency of Colorectal Cancer on a TGF-β-Driven Program in Stromal Cells for Metastasis Initiation
Calon, A., Espinet, E., Palomo-Ponce, S., Tauriello, D. V. F., Iglesias, M., Céspedes, M. V., Sevillano, M., Nadal, C., Jung, P., Zhang, X. H.-F., et al. (2012) · Cancer Cell · doi:10.1016/j.ccr.2012.08.013 · Cited by 1,060
Taube, J. H., Herschkowitz, J. I., Komurov, K., Zhou, A. Y., Gupta, S. K., Yang, J., Hartwell, K. A., Önder, T. T., Gupta, P. B., Evans, K. W., et al. (2010) · Proceedings of the National Academy of Sciences · doi:10.1073/pnas.1004900107 · Cited by 1,054
Role of the Serrated Pathway in Colorectal Cancer Pathogenesis
Leggett, B., & Whitehall, V. (2010) · Gastroenterology · doi:10.1053/j.gastro.2009.12.066 · Cited by 1,015
Sadanandam, A., Lyssiotis, C. A., Homicsko, K., Collisson, E. A., Gibb, W. J., Wullschleger, S., Ostos, L. C. G., Lannon, W. A., Grotzinger, C., Del Rio, M., et al. (2013) · Nature Medicine · doi:10.1038/nm.3175 · Cited by 960
Datto, M., Li, Y., Panus, J. F., Howe, D. J., Xiong, Y., & Wang, X. F. (1995) · Proceedings of the National Academy of Sciences · doi:10.1073/pnas.92.12.5545 · Cited by 945
Self-citationMoustakas, A., & Heldin, C. (2007) · Cancer Science · doi:10.1111/j.1349-7006.2007.00550.x · Cited by 798
De Sousa E Melo, F., Wang, X., Jansen, M., Fessler, E., Trinh, A., de Rooij, L. P. M. H., de Jong, J. H., de Boer, O. J., van Leersum, R., Bijlsma, M. F., et al. (2013) · Nature Medicine · doi:10.1038/nm.3174 · Cited by 771
Self-citationBRAF mutation is associated with DNA methylation in serrated polyps and cancers of the colorectum
Kambara, T., Simms, L. A., Whitehall, V., Spring, K. J., Wynter, C. V. A., Walsh, M. D., Barker, M., Arnold, S., McGivern, A., Matsubara, N., et al. (2004) · Gut · doi:10.1136/gut.2003.037671 · Cited by 733
Update on the serrated pathway to colorectal carcinoma
Snover, D. C. (2010) · Human Pathology · doi:10.1016/j.humpath.2010.06.002 · Cited by 642
Stromal contribution to the colorectal cancer transcriptome
Isella, C., Terrasi, A., Bellomo, S. E., Petti, C., Galatola, G., Muratore, A., Mellano, A., Senetta, R., Cassenti, A., Sonetto, C., et al. (2015) · Nature Genetics · doi:10.1038/ng.3224 · Cited by 640
Mechanism of TGF-β signaling to growth arrest, apoptosis, and epithelial–mesenchymal transition
Heldin, C., Landström, M., & Moustakas, A. (2009) · Current Opinion in Cell Biology · doi:10.1016/j.ceb.2009.01.021 · Cited by 633
TGF-β Tumor Suppression through a Lethal EMT
David, C. J., Huang, Y.-H., Chen, M., Su, J., Zou, Y., Bardeesy, N. M., Iacobuzio–Donahue, C. A., & Massagué, J. (2016) · Cell · doi:10.1016/j.cell.2016.01.009 · Cited by 597
Spaderna, S., Schmalhofer, O., Hlubek, F., Berx, G., Eger, A., Merkel, S., Jung, A., Kirchner, T., & Brabletz, T. (2006) · Gastroenterology · doi:10.1053/j.gastro.2006.06.016 · Cited by 477
CDX2 as a Prognostic Biomarker in Stage II and Stage III Colon Cancer
Dalerba, P. D., Sahoo, D., Paik, S., Guo, X., Yothers, G., Song, N., Wilcox-Fogel, N., Forgó, E., Rajendran, P. S., Miranda, S. P., et al. (2016) · New England Journal of Medicine · doi:10.1056/nejmoa1506597 · Cited by 470
MED12 Controls the Response to Multiple Cancer Drugs through Regulation of TGF-β Receptor Signaling
Huang, S., Hölzel, M., Knijnenburg, T., Schlicker, A., Roepman, P., McDermott, U., Garnett, M., Grernrum, W., Sun, C., Prahallad, A., et al. (2012) · Cell · doi:10.1016/j.cell.2012.10.035 · Cited by 430
Association Between Molecular Subtypes of Colorectal Cancer and Patient Survival
Phipps, A. I., Limburg, P. J., Baron, J. A., Burnett‐Hartman, A. N., Weisenberger, D. J., Laird, P. W., Sinicrope, F. A., Rosty, C., Buchanan, D. D., Potter, J. D., et al. (2014) · Gastroenterology · doi:10.1053/j.gastro.2014.09.038 · Cited by 406
Gene expression patterns unveil a new level of molecular heterogeneity in colorectal cancer
Budínská, E., Popovici, V. C., Tejpar, S., D’Ario, G., Lapique, N., Sikora, K. O., Narzo, A. F. D., Yan, P., Hodgson, J., Weinrich, S. L., et al. (2013) · The Journal of Pathology · doi:10.1002/path.4212 · Cited by 405
TGF-β induces apoptosis through Smad-mediated expression of DAP-kinase
Jang, C., Chen, C.-H., Chen, C., Chen, J., Su, Y., & Chen, R. (2001) · Nature Cell Biology · doi:10.1038/ncb731 · Cited by 387
Dávalos, V., Moutinho, C., Villanueva, A., Boqué-Sastre, R., Silva, P., Carneiro, F., & Esteller, M. (2011) · Oncogene · doi:10.1038/onc.2011.383 · Cited by 358
Roepman, P., Schlicker, A., Tabernero, J. M., Majewski, I. J., Tian, S., Moreno, V. R., Snel, M. H. J., Chresta, C. M., Rosenberg, R., Nitsche, U., et al. (2013) · International Journal of Cancer · doi:10.1002/ijc.28387 · Cited by 355
TGF-beta in CAF-mediated tumor growth and metastasis
Calon, A., Tauriello, D. V. F., & Batlle, E. (2014) · Seminars in Cancer Biology · doi:10.1016/j.semcancer.2013.12.008 · Cited by 342
Melo, F. D. S. E., Çolak, S., Buikhuisen, J. Y., Köster, J., Cameron, K., de Jong, J. H., Tuynman, J. B., Prasetyanti, P. R., Fessler, E., van den Bergh, S., et al. (2011) · Cell stem cell · doi:10.1016/j.stem.2011.10.008 · Cited by 334
Self-citationSessile serrated adenomas: prevalence of dysplasia and carcinoma in 2139 patients
Lash, R. H., Genta, R. M., & Schuler, C. M. (2010) · Journal of Clinical Pathology · doi:10.1136/jcp.2010.075507 · Cited by 333
SMAD2 , SMAD3 and SMAD4 Mutations in Colorectal Cancer
Fleming, N. I., Jorissen, R. N., Mouradov, D., Christie, M., Sakthianandeswaren, A., Palmieri, M., Day, F. L., Li, S., Tsui, C., Lipton, L. R., et al. (2012) · Cancer Research · doi:10.1158/0008-5472.can-12-2706 · Cited by 327
Shioiri, M., Shida, T., Koda, K., Oda, K., Seike, K., Nishimura, M., Takano, S., & Miyazaki, M. (2006) · British Journal of Cancer · doi:10.1038/sj.bjc.6603193 · Cited by 287
Schlicker, A., Beran, G. J., Chresta, C. M., McWalter, G., Pritchard, A., Weston, S. L., Runswick, S. K., Davenport, S., Heathcote, K., Alférez, D., et al. (2012) · BMC Medical Genomics · doi:10.1186/1755-8794-5-66 · Cited by 267
Frequent CpG Island Methylation in Serrated Adenomas of the Colorectum
Park, S. J., Rashid, A., Lee, J.-H., Kim, S. G., Hamilton, S. R., & Wu, T. (2003) · American Journal Of Pathology · doi:10.1016/s0002-9440(10)63878-3 · Cited by 241
The evolution of cancer of the colon and rectum
Muto, T., Bussey, H. J. R., & Morson, B. C. (1975) · Cancer · doi:10.1002/cncr.2820360644 · Cited by 237
Serrated neoplasia—role in colorectal carcinogenesis and clinical implications
IJspeert, J. E. G., Vermeulen, L., Meijer, G. A., & Dekker, E. (2015) · Nature Reviews Gastroenterology & Hepatology · doi:10.1038/nrgastro.2015.73 · Cited by 192
Self-citationGröger, C., Grubinger, M., Waldhoer, T., Vierlinger, K., & Mikulits, W. (2012) · PLoS ONE · doi:10.1371/journal.pone.0051136 · Cited by 184
Friedman, E. D., Gold, L. I., Klimstra, D., Zeng, Z., Winawer, S. J., & Cohen, A. M. (1995) · PubMed · Cited by 182
Smad Signaling Is Required to Maintain Epigenetic Silencing during Breast Cancer Progression
Papageorgis, P., Lambert, A. W., Ozturk, S., Gao, F., Pan, H., Manne, U., Alekseyev, Y. O., Thiagalingam, A., Abdolmaleky, H. M., Lenburg, M. E., et al. (2010) · Cancer Research · doi:10.1158/0008-5472.can-09-1872 · Cited by 178
Tsushima, H., Ito, N., Tamura, S., Matsuda, Y., Inada, M., Yabuuchi, I., Imai, Y., Nagashima, R., Misawa, H., Takeda, H., et al. (2001) · PubMed · Cited by 149
Carragher, L. A. S., Snell, K. R., Giblett, S. M., Aldridge, V. S. S., Patel, B., Cook, S. J., Winton, D. J., Marais, R., & Pritchard, C. A. (2010) · EMBO Molecular Medicine · doi:10.1002/emmm.201000099 · Cited by 144
Pérez‐Villamil, B., Romera-López, A., Prieto, S. H., López–Campos, G., Calles, A., Asenjo, J. A. L., Sanz‐Ortega, J., Fernández, C., Sastre, J., Alfonso, R., et al. (2012) · BMC Cancer · doi:10.1186/1471-2407-12-260 · Cited by 126
Progression of a Sessile Serrated Adenoma to an Early Invasive Cancer Within 8 Months
Oono, Y., Fu, K., Nakamura, H., Iriguchi, Y., Yamamura, A., Tomino, Y., Oda, J., Mizutani, M., Takayanagi, S., Kishi, D., et al. (2008) · Digestive Diseases and Sciences · doi:10.1007/s10620-008-0407-7 · Cited by 125
TGF-β: An emerging player in drug resistance
Brunen, D., Willems, S., Kellner, U., Midgley, R., Simon, I., & Bernards, R. (2013) · Cell Cycle · doi:10.4161/cc.26034 · Cited by 124
Robson, H., Anderson, E., James, R., & Schofield, P. F. (1996) · British Journal of Cancer · doi:10.1038/bjc.1996.432 · Cited by 103
Lurkin, I., Stoehr, R., Hurst, C. D., van Tilborg, A. A. G., Knowles, M. A., Hartmann, A., & Zwarthoff, E. C. (2010) · PLoS ONE · doi:10.1371/journal.pone.0008802 · Cited by 94
Ramesh, S., Qi, X., Wildey, G. M., Robinson, J., Molkentin, J. D., Letterio, J. J., & Howe, P. H. (2008) · EMBO Reports · doi:10.1038/embor.2008.158 · Cited by 91
Prasetyanti, P. R., Zimberlin, C. D., Bots, M. L., Vermeulen, L., Melo, F. D. S. E., & Medema, J. P. (2013) · Molecular Cancer · doi:10.1186/1476-4598-12-126 · Cited by 62
Self-citationOncogenic mutations in intestinal adenomas regulate Bim-mediated apoptosis induced by TGF-β
Wiener, Z., Band, A. M., Kallio, P., Hogstrom, J. M., Hyvönen, V., Kaijalainen, S., Ritvos, O., Haglund, C. H., Kruuna, O., Robine, S., et al. (2014) · Proceedings of the National Academy of Sciences · doi:10.1073/pnas.1406444111 · Cited by 58
Cited by
Sorted by citations
Drost, J., & Clevers, H. (2018) · Nature Reviews Cancer · doi:10.1038/s41568-018-0007-6 · Cited by 1,790
Self-citationConsensus molecular subtypes and the evolution of precision medicine in colorectal cancer
Dienstmann, R., Vermeulen, L., Guinney, J., Kopetz, S., Tejpar, S., & Tabernero, J. M. (2017) · Nature reviews. Cancer · doi:10.1038/nrc.2016.126 · Cited by 1,075
Self-citationTargeting TGF-β Signaling in Cancer
Colak, S., & ten Dijke, P. (2017) · Trends in cancer · doi:10.1016/j.trecan.2016.11.008 · Cited by 1,003
Lineage-dependent gene expression programs influence the immune landscape of colorectal cancer
Lee, H., Hong, Y., Etlioglu, H. E., Cho, Y. B., Pomella, V., den Bosch, B. V., Vanhecke, J., Verbandt, S., Hong, H.-K., Min, J.-W., et al. (2020) · Nature Genetics · doi:10.1038/s41588-020-0636-z · Cited by 934
Epigenetics of colorectal cancer: biomarker and therapeutic potential
Jung, G., Hernández-Illán, E., Moreira, L., Balaguer, F., & Goel, A. (2020) · Nature Reviews Gastroenterology & Hepatology · doi:10.1038/s41575-019-0230-y · Cited by 813
Metadata
- Authors
- Fessler, E., Drost, J., van Hooff, S. R., Linnekamp, J. F., Wang, X., Jansen, M., De Sousa E Melo, F., Prasetyanti, P. R., IJspeert, J. E., Franitza, M., Nürnberg, P., van Noesel, C. J., Dekker, E., Vermeulen, L., Clevers, H., & Medema, J. P.
- Affiliations
- Amsterdam UMC Location University of Amsterdam (NL)
- Royal Netherlands Academy of Arts and Sciences (NL)
- City University of Hong Kong (HK)
- University of Cologne (DE)
- Corresponding author
- Medema, Jan Paul
- ORCID
- Venue
- EMBO Molecular Medicine
- Published
- 2016-05-24
- Volume
- 8
- Issue
- 7
- Pages
- 745-760
- ISSN
- 1757-4676 (ISSN-L)
- 1757-4684
- PMC
- PMC4931289
- OpenAlex
- W2404590196
- Cited by
- 159
- References
- 69
- Citations by year
- 2026: 7 · 2025: 15 · 2024: 16 · 2023: 12 · 2022: 16 · 2021: 20 · 2020: 25 · 2019: 13 · 2018: 16 · 2017: 14 · 2016: 4
- FWCI
- 8.14
- Type
- journal article
- Language
- en
- Open access
- gold
- doi.org
- Locations
- EMBO Molecular Medicine (publishedVersion, cc-by)
- Europe PMC (PubMed Central) (publishedVersion, cc-by)
- PubMed Central (publishedVersion, cc-by)
- PubMed (publishedVersion)
- Pure Amsterdam UMC (publishedVersion, other-oa)
- KNAW Research Portal (The Royal Netherlands Academy of Arts and Sciences) (publishedVersion, other-oa)
- KNAW research portal (Royal Academy of Art and Sciences (KNAW)) (publishedVersion, other-oa)
- Data Archiving and Networked Services (DANS) (submittedVersion)
- Data Archiving and Networked Services (DANS) (submittedVersion, cc-by)
- DOAJ (DOAJ: Directory of Open Access Journals) (submittedVersion)
- Utrecht University Repository (Utrecht University) (submittedVersion, other-oa)
- UCL Discovery (University College London) (submittedVersion)
- CityU Scholars (submittedVersion, cc-by)
- Funders
- AMC Graduate School PhD Scholarship
- NWO‐ZonMw VENI (91614138)
- Dutch Cancer Society (UvA2013‐6331, UvA2014‐7245, UvA2015‐7587)
- Topics
- Life Sciences › Biochemistry, Genetics and Molecular Biology › Molecular Biology › TGF-β signaling in diseases
- Health Sciences › Medicine › Oncology › Colorectal Cancer Treatments and Studies
- Health Sciences › Medicine › Pathology and Forensic Medicine › Genetic factors in colorectal cancer
- Keywords
- TGF-beta signaling, colorectal cancer, consensus molecular subtypes, CMS4, mesenchymal subtype, sessile serrated adenoma, serrated neoplasia, tubular adenoma, BRAF V600E mutation, colorectal organoids, apoptosis, tumor progression, precursor lesions
- MeSH terms
- Adenoma, Humans, Organoids, Colorectal Neoplasms, Signal Transduction, Transforming Growth Factor beta, Carcinogenesis
About these checks
Registry, retraction, Cites and statistics results are computed, not judged, with one exception: a printed reference that no index lists is read once by a model before it counts as a citation error. Claims are extracted by a model and kept only when their quote appears verbatim in the text; each cited source is then checked, with a model’s help, for whether it says what the claim relies on. Those verdicts can be wrong — read the claim’s quote and the cited source before relying on one.
Statistics and arithmetic are recomputed, not judged.
Confidence bands are shown only for fields calibrated on our annotated test set. None is calibrated yet, so no band is shown.
What counts as a claim ›How we measure confidence ›How we check this ›
Are you an author, or do you see a problem with this page? Request a review
