CoChat

Parallel reverse genetic screening in mutant human cells using transcriptomics

Open access

The DOI matches its Crossref record; 37 of the 39 references it cites were found in a registry or an index.

Abstract

Reverse genetic screens have driven gene annotation and target discovery in model organisms. However, many disease‐relevant genotypes and phenotypes cannot be studied in lower organisms. It is therefore essential to overcome technical hurdles associated with large‐scale reverse genetics in human cells. Here, we establish a reverse genetic approach based on highly robust and sensitive multiplexed RNA sequencing of mutant human cells. We conduct 10 parallel screens using a collection of engineered haploid isogenic cell lines with knockouts covering tyrosine kinases and identify known and unexpected effects on signaling pathways. Our study provides proof of concept for a scalable approach to link genotype to phenotype in human cells, which has broad applications. In particular, it clears the way for systematic phenotyping of still poorly characterized human genes and for systematic study of uncharacterized genomic features associated with human disease.

Overview

The claims and statistics of this paper haven’t been checked yet.

Free: it reads the open-access text and checks the first 5 claims that cite a source we can check. Create a free account to check every claim.

A few free checks a day · papers already verified open instantly · results are public

Integrity signals

Registry

Crossref · 10.15252/msb.20166890

Cites

37 of 37 references verified0 citation errors · 0 not checkable

Statistics

Figures

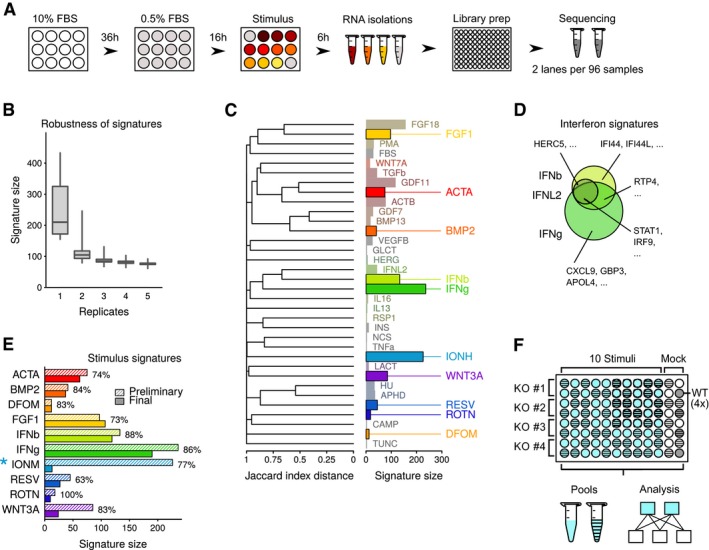
Figure EV1 Gene signatures of wild‐type cells upon stimulation Experimental design of stimulations in HAP1 cells. HAP1 cells were seeded in 12‐well plates, cultured for 36 h in standard medium (10% FBS) and 16 h under reduced serum conditions (0.5% FBS). Following stimulation for 6 h, total RNA was isolated and libraries prepared for next‐generation sequencing. A total of 48 samples were pooled for sequencing on each lane of an Illumina HiSeq 2000 sequencer. FBS, fetal bovine serum.Modeling of robustness of gene signatures with increasing replicate number based on a set of eight replicates of FGF18 stimulation experiments. For each number of replicates on the x‐axis, we selected subsets of the eight replicates and computed the signature size with respect to a set of wild‐type controls. This calculation was repeated 20 times. Boxplots show quartiles (minimum, 25, 50, 75%, and maximal) results among the repeated bootstrap operations.Visualization of stimulus signatures in HAP1 cells. Bar charts are as in Fig 1C. Similarity between signatures is determined by the Jaccard index distance (1—Jaccard index between signature sets), and the dendrogram is produced using a hierarchical complete agglomeration method.Comparison of gene signatures in IFNb, IFNL2, and IFNg stimulated HAP1 cells. Examples of signature genes specific and shared between the three stimuli are indicated.Signature size for the ten selected stimuli. Preliminary (2 replicates) and final (3 or more replicates) signature sizes are indicated. Percentages indicate overlap between preliminary and final signatures (size of intersection divided by size of final set). Asterisk next to IONM indicates that the different signature size is affected by a change in stimulus concentration between preliminary and final experiments.Design and data analysis layout for the reverse genetic screening phase. Library preparations were performed in a 96‐well format. Each library preparation batch consisted of four knockout cell lines with ten stimuli, mock treatment, and four unstimulated wild‐type controls. A total of 48 samples were pooled and sequenced on one lane of an Illumina 2000 sequencer. Genes were scored as differentially expressed by comparing replicates of stimulated and unstimulated samples from the same library preparation batch. WT, wild type; KO, knockout.
Figure EV1 Gene signatures of wild‐type cells upon stimulation Experimental design of stimulations in HAP1 cells. HAP1 cells were seeded in 12‐well plates, cultured for 36 h in standard medium (10% FBS) and 16 h under reduced serum conditions (0.5% FBS). Following stimulation for 6 h, total RNA was isolated and libraries prepared for next‐generation sequencing. A total of 48 samples were pooled for sequencing on each lane of an Illumina HiSeq 2000 sequencer. FBS, fetal bovine serum.Modeling of robustness of gene signatures with increasing replicate number based on a set of eight replicates of FGF18 stimulation experiments. For each number of replicates on the x‐axis, we selected subsets of the eight replicates and computed the signature size with respect to a set of wild‐type controls. This calculation was repeated 20 times. Boxplots show quartiles (minimum, 25, 50, 75%, and maximal) results among the repeated bootstrap operations.Visualization of stimulus signatures in HAP1 cells. Bar charts are as in Fig 1C. Similarity between signatures is determined by the Jaccard index distance (1—Jaccard index between signature sets), and the dendrogram is produced using a hierarchical complete agglomeration method.Comparison of gene signatures in IFNb, IFNL2, and IFNg stimulated HAP1 cells. Examples of signature genes specific and shared between the three stimuli are indicated.Signature size for the ten selected stimuli. Preliminary (2 replicates) and final (3 or more replicates) signature sizes are indicated. Percentages indicate overlap between preliminary and final signatures (size of intersection divided by size of final set). Asterisk next to IONM indicates that the different signature size is affected by a change in stimulus concentration between preliminary and final experiments.Design and data analysis layout for the reverse genetic screening phase. Library preparations were performed in a 96‐well format. Each library preparation batch consisted of four knockout cell lines with ten stimuli, mock treatment, and four unstimulated wild‐type controls. A total of 48 samples were pooled and sequenced on one lane of an Illumina 2000 sequencer. Genes were scored as differentially expressed by comparing replicates of stimulated and unstimulated samples from the same library preparation batch. WT, wild type; KO, knockout.CC BY · PubMed Central
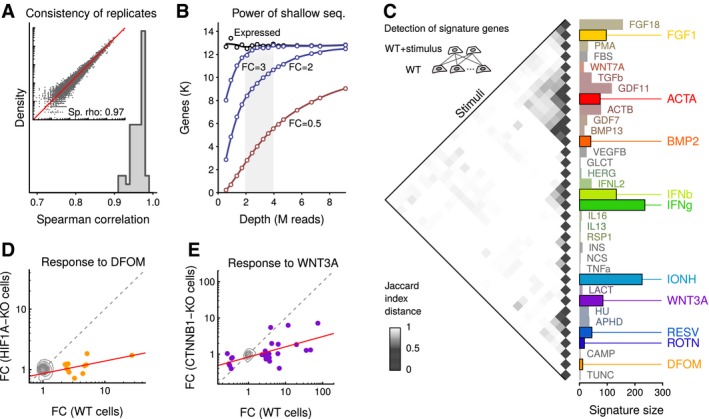
Figure 1 A platform for large‐scale cell profiling by shallow RNA sequencing Spearman correlations between replicates of expression profiles in HAP1 cells measured by shallow RNA‐seq. Libraries were prepared using a protocol capturing 3‐prime ends of polyadenylated transcripts. Inset shows gene expression values in a representative pair of replicates.Data‐based modeling of the effect of sequencing depth on gene expression analysis. Dots represent synthetic samples obtained by pooling 24 HAP1 wild‐type sequencing runs and subsampling. Line labeled “Expressed” shows the number of genes that can be detected with expression above a threshold (transcripts per million reads above 1). Lines labeled with FC show estimates of the number of genes that could be detected as differentially expressed were their expression to change by the indicated factor. FC, fold change; K, thousand; M, million.Clustering of signature gene sets from polypeptide and small molecule stimulations. Inset shows strategy for obtaining gene signatures wherein each stimulated sample is compared to a control set, and a signature is obtained by consensus of two replicates. The heatmap shows a clustering of stimuli wherein similarities are assessed by 1 – Jaccard index of the signature sets. The bar chart displays sizes of signature sets. Solid colors indicate a panel of diverse stimuli selected for the 10 reverse genetic screens. WT, wild type.Comparison of expression profiles of wild‐type cells and HIF1A‐KO cells in response to DFOM stimulation. Contours depict genes not differentially expressed; dots indicate DFOM signature genes; gray dotted line is the diagonal of equal response; and red line is a linear fit using signature genes. FC, fold change; WT, wild type; KO, knockout.Same as in (D), except for WNT3A stimulus in CTNNB1‐KO cells.
Figure 1 A platform for large‐scale cell profiling by shallow RNA sequencing Spearman correlations between replicates of expression profiles in HAP1 cells measured by shallow RNA‐seq. Libraries were prepared using a protocol capturing 3‐prime ends of polyadenylated transcripts. Inset shows gene expression values in a representative pair of replicates.Data‐based modeling of the effect of sequencing depth on gene expression analysis. Dots represent synthetic samples obtained by pooling 24 HAP1 wild‐type sequencing runs and subsampling. Line labeled “Expressed” shows the number of genes that can be detected with expression above a threshold (transcripts per million reads above 1). Lines labeled with FC show estimates of the number of genes that could be detected as differentially expressed were their expression to change by the indicated factor. FC, fold change; K, thousand; M, million.Clustering of signature gene sets from polypeptide and small molecule stimulations. Inset shows strategy for obtaining gene signatures wherein each stimulated sample is compared to a control set, and a signature is obtained by consensus of two replicates. The heatmap shows a clustering of stimuli wherein similarities are assessed by 1 – Jaccard index of the signature sets. The bar chart displays sizes of signature sets. Solid colors indicate a panel of diverse stimuli selected for the 10 reverse genetic screens. WT, wild type.Comparison of expression profiles of wild‐type cells and HIF1A‐KO cells in response to DFOM stimulation. Contours depict genes not differentially expressed; dots indicate DFOM signature genes; gray dotted line is the diagonal of equal response; and red line is a linear fit using signature genes. FC, fold change; WT, wild type; KO, knockout.Same as in (D), except for WNT3A stimulus in CTNNB1‐KO cells.CC BY · PubMed Central
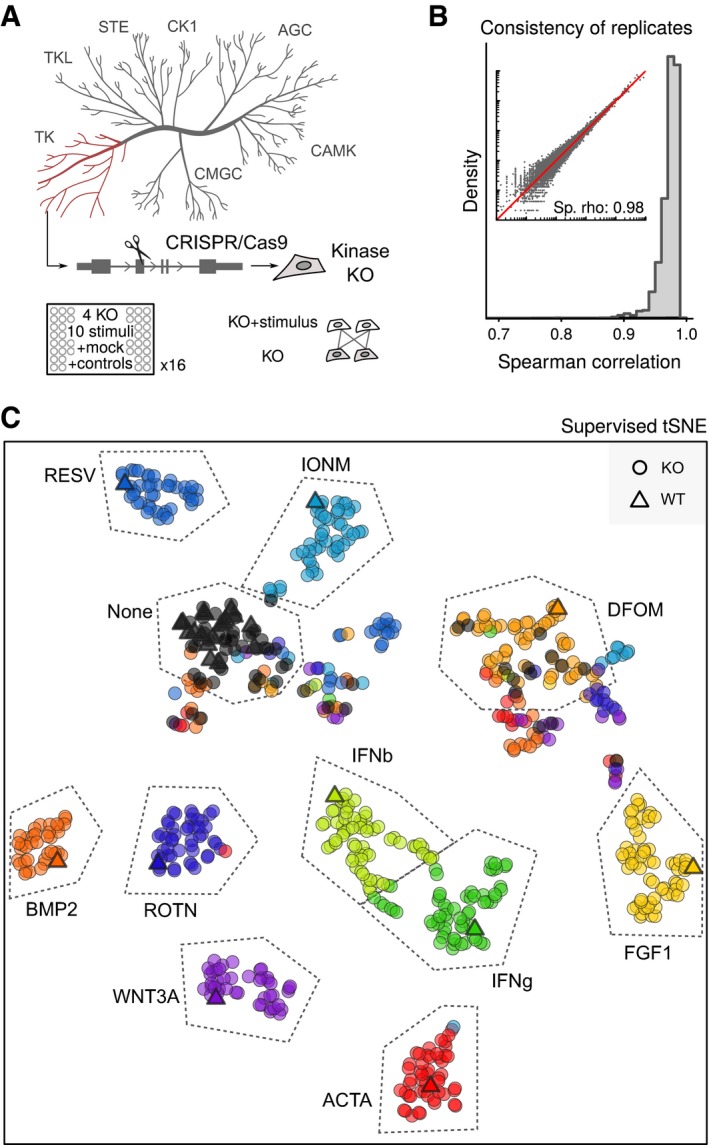
Figure 2 Parallel reverse genetic screening of kinase knockout cells On top, cartoon illustrating the assembly of a collection of HAP1 knockouts using CRISPR/Cas9 technology. Abbreviations indicate kinase subfamilies. At bottom, scheme for screening design showing that individual kinase KO cells are measured along all relevant controls. KO, knockout.Spearman correlations between replicates of stimulated and unstimulated wild‐type and knockout cells in the transcriptomic screen of 16 96‐well plates. Inset shows expression values in a representative set of replicates.Supervised Stochastic Neighbour Embedding (tSNE) clustering of all stimulated and unstimulated HAP1 wild‐type and knockout cell lines. Dots represent averages of replicates. WT, wild type; KO, knockout.
Figure 2 Parallel reverse genetic screening of kinase knockout cells On top, cartoon illustrating the assembly of a collection of HAP1 knockouts using CRISPR/Cas9 technology. Abbreviations indicate kinase subfamilies. At bottom, scheme for screening design showing that individual kinase KO cells are measured along all relevant controls. KO, knockout.Spearman correlations between replicates of stimulated and unstimulated wild‐type and knockout cells in the transcriptomic screen of 16 96‐well plates. Inset shows expression values in a representative set of replicates.Supervised Stochastic Neighbour Embedding (tSNE) clustering of all stimulated and unstimulated HAP1 wild‐type and knockout cell lines. Dots represent averages of replicates. WT, wild type; KO, knockout.CC BY · PubMed Central
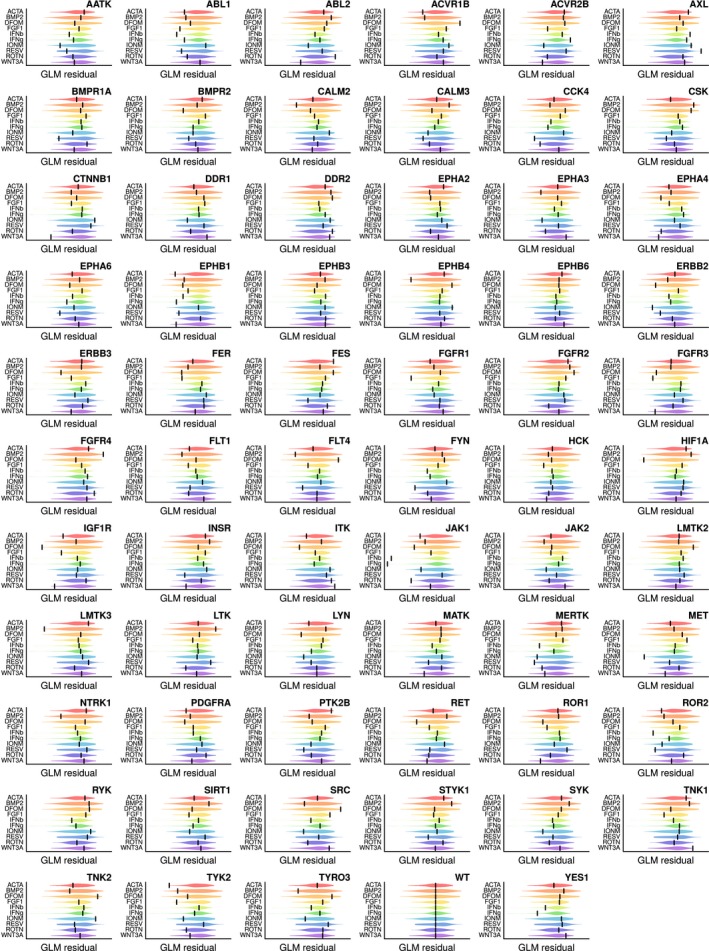
Figure EV2 Overview of mutant cell lines’ response to stimulation Matrix of response visualizations for all screened cell lines. In each panel, violins depict distributions of response scores from the entire mutant panel. Scores are overlaps of signature gene sets with expected signature sets, corrected for technical variables using general linear models (GLMs). Bars display response of the mutant cell line indicated in the panel title.
Figure EV2 Overview of mutant cell lines’ response to stimulation Matrix of response visualizations for all screened cell lines. In each panel, violins depict distributions of response scores from the entire mutant panel. Scores are overlaps of signature gene sets with expected signature sets, corrected for technical variables using general linear models (GLMs). Bars display response of the mutant cell line indicated in the panel title.CC BY · PubMed Central
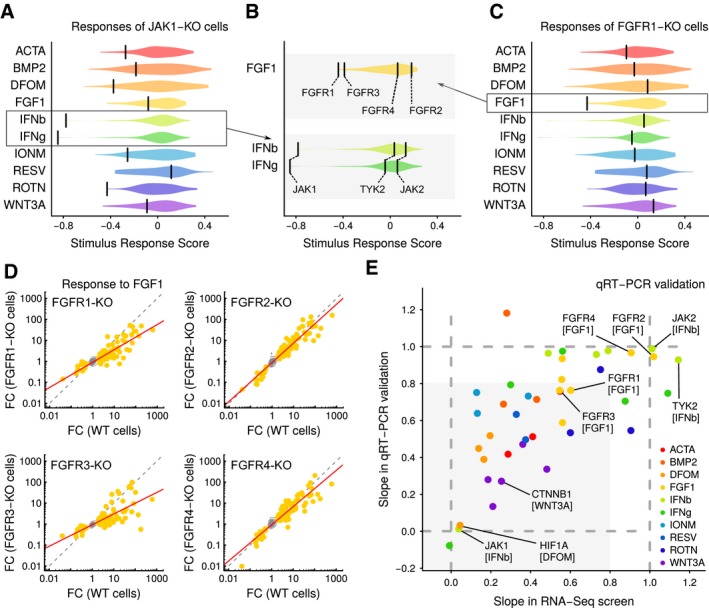
Figure 3 Transcriptional profiling of kinase knockouts links genotypes to pathways Responses of JAK1‐KO cells to the ten selected stimuli. Violins indicate score distributions of all knockout cell lines. Scores are overlaps of signature gene sets with expected signature sets, corrected for technical variables using general linear models. Bars represent scores for JAK1‐KO mutants. KO, knockout.Similar as in Fig 3A, except showing detailed view of responses to FGF1 and IFNb/IFNg stimulation of selected knockout cells. Bars indicate labeled mutants of FGFR and JAK family members.Same as in Fig 3A, except showing FGFR1‐KO cell line.Comparison of response signatures in wild‐type and FGFR‐KO mutant cells. Contours summarize genes that are not differentially expressed; dots indicate FGF1 signature genes; gray dotted line is the diagonal of equal response; and red line is a linear fit using signature genes. FC, fold change; WT, wild type; KO, knockout.Comparison of stimulus response as measured by RNA‐seq and qRT–PCR. Each axis shows the slope of a best‐fit line through KO and WT stimulus responses (lines for RNA‐seq are as in Fig 3D, and lines for qRT–PCR data are computed similarly from independent stimulation and qRT measurements). Dotted lines are guides representing unit slope (equal response in KO and WT cells to stimulus) and zero slope (KO cells fully unresponsive to stimulus). Shaded area represents the space where both assays indicate that KO cells are less responsive than WT cells. WT, wild type; KO, knockout.
Figure 3 Transcriptional profiling of kinase knockouts links genotypes to pathways Responses of JAK1‐KO cells to the ten selected stimuli. Violins indicate score distributions of all knockout cell lines. Scores are overlaps of signature gene sets with expected signature sets, corrected for technical variables using general linear models. Bars represent scores for JAK1‐KO mutants. KO, knockout.Similar as in Fig 3A, except showing detailed view of responses to FGF1 and IFNb/IFNg stimulation of selected knockout cells. Bars indicate labeled mutants of FGFR and JAK family members.Same as in Fig 3A, except showing FGFR1‐KO cell line.Comparison of response signatures in wild‐type and FGFR‐KO mutant cells. Contours summarize genes that are not differentially expressed; dots indicate FGF1 signature genes; gray dotted line is the diagonal of equal response; and red line is a linear fit using signature genes. FC, fold change; WT, wild type; KO, knockout.Comparison of stimulus response as measured by RNA‐seq and qRT–PCR. Each axis shows the slope of a best‐fit line through KO and WT stimulus responses (lines for RNA‐seq are as in Fig 3D, and lines for qRT–PCR data are computed similarly from independent stimulation and qRT measurements). Dotted lines are guides representing unit slope (equal response in KO and WT cells to stimulus) and zero slope (KO cells fully unresponsive to stimulus). Shaded area represents the space where both assays indicate that KO cells are less responsive than WT cells. WT, wild type; KO, knockout.CC BY · PubMed Central
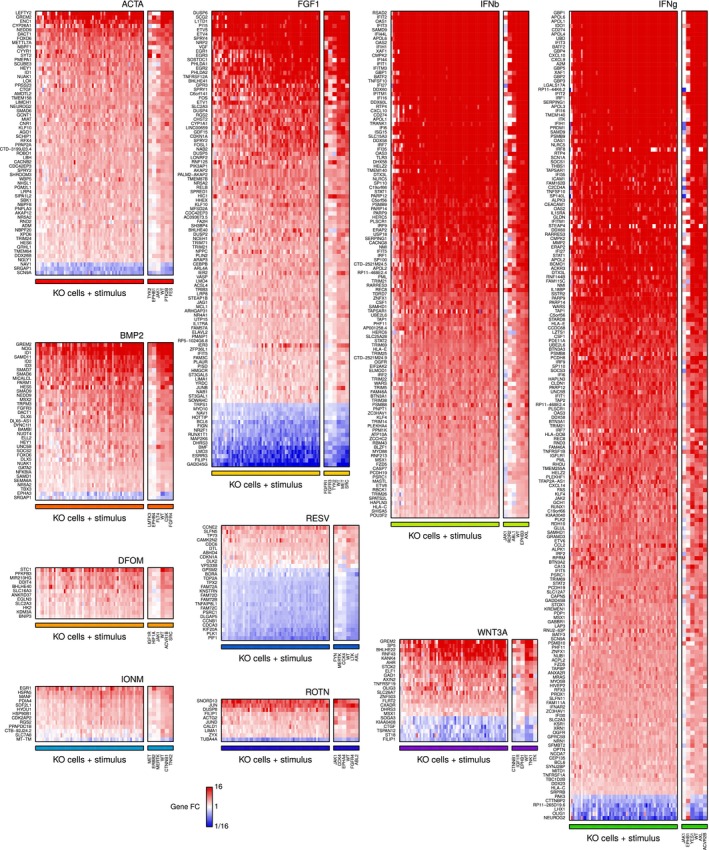
Figure EV3 Expression changes in signature genes Heatmaps depicting fold changes in KO cell lines upon stimulation relative to their unstimulated level. Genes part of the stimulus signatures are labeled on the vertical axes. The horizontal axes consist of WT and KO cell lines; cells are ordered differently in each heatmap according to their stimulus response score. Small heatmaps on the side provide a detailed view of three KO lines with the smallest stimulus response scores, WT cells, and two KO lines with the largest stimulus response scores. FC, fold change; WT, wild‐type; KO, knockout.
Figure EV3 Expression changes in signature genes Heatmaps depicting fold changes in KO cell lines upon stimulation relative to their unstimulated level. Genes part of the stimulus signatures are labeled on the vertical axes. The horizontal axes consist of WT and KO cell lines; cells are ordered differently in each heatmap according to their stimulus response score. Small heatmaps on the side provide a detailed view of three KO lines with the smallest stimulus response scores, WT cells, and two KO lines with the largest stimulus response scores. FC, fold change; WT, wild‐type; KO, knockout.CC BY · PubMed Central
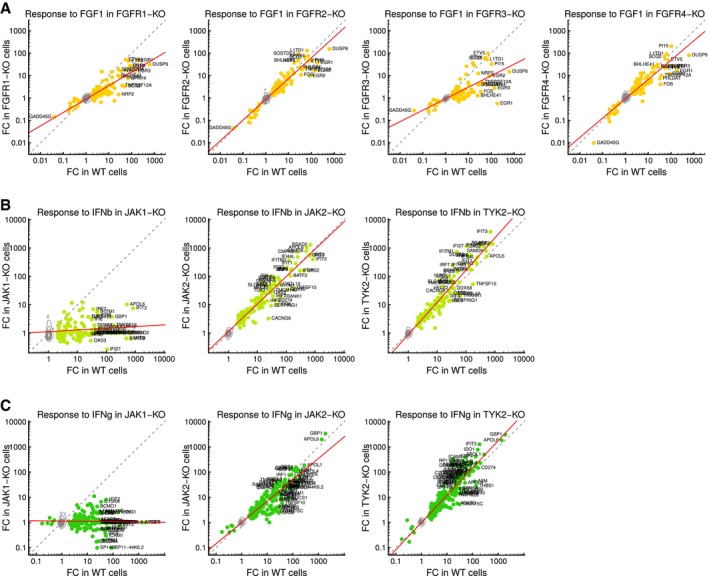
Figure EV4 Gene signatures of selected mutants Comparison of response signatures in wild‐type and FGFR family mutant cells. Contours depict genes not differentially expressed; dots indicate FGF1 signature genes; gray dotted line is the diagonal of equal response; red line is a linear fit using signature genes. FC, fold change; WT, wild‐type; KO, knockout.Same as in (A) except for JAK family mutants and IFNb stimulation.Same as in (B) except for IFNg stimulation.
Figure EV4 Gene signatures of selected mutants Comparison of response signatures in wild‐type and FGFR family mutant cells. Contours depict genes not differentially expressed; dots indicate FGF1 signature genes; gray dotted line is the diagonal of equal response; red line is a linear fit using signature genes. FC, fold change; WT, wild‐type; KO, knockout.Same as in (A) except for JAK family mutants and IFNb stimulation.Same as in (B) except for IFNg stimulation.CC BY · PubMed Central
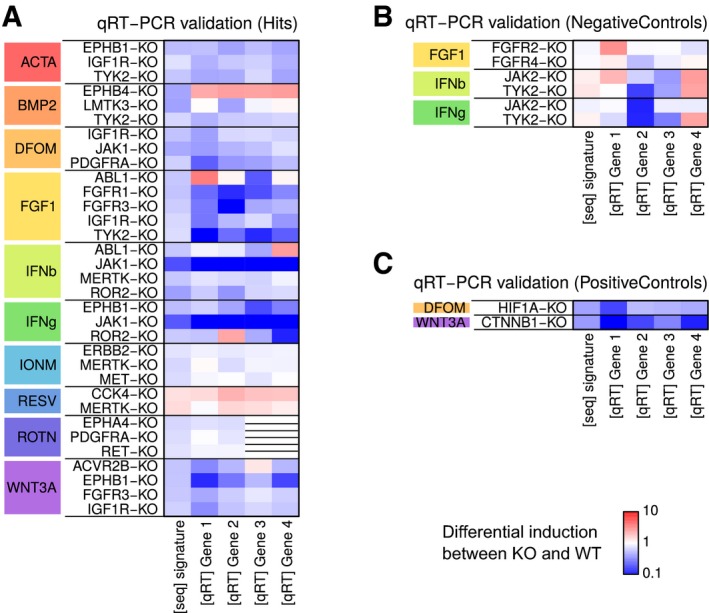
Figure EV5 qRT–PCR validation of selected mutants Heatmap of differential induction of signature genes upon stimulation. Each row represents an independent experiment in which WT and KO cells were stimulated, and the expression of four genes measured using qRT–PCR. Similar induction levels in the four genes and in the RNA‐seq signature conveys concordant results between the PCR and sequencing assays. WT, wild‐type; KO, knockout.Same as in (A) except for KO and stimulus combinations for expected negative interactions.Same as in (A) except for KO and stimulus combinations for expected positive interactions.
Figure EV5 qRT–PCR validation of selected mutants Heatmap of differential induction of signature genes upon stimulation. Each row represents an independent experiment in which WT and KO cells were stimulated, and the expression of four genes measured using qRT–PCR. Similar induction levels in the four genes and in the RNA‐seq signature conveys concordant results between the PCR and sequencing assays. WT, wild‐type; KO, knockout.Same as in (A) except for KO and stimulus combinations for expected negative interactions.Same as in (A) except for KO and stimulus combinations for expected positive interactions.CC BY · PubMed Central

Verification

Claims the paper makes

The claims and statistics of this paper haven’t been checked yet.

Free: it reads the open-access text and checks the first 5 claims that cite a source we can check. Create a free account to check every claim.

A few free checks a day · papers already verified open instantly · results are public

Claims other papers make about this one

Each is checked against this paper’s own text: does it say what the citing paper says it does?

Self-check

Percentages, sums and reported differences re-computed from the paper’s own numbers.

The self-check needs the paper’s full text.

Citations

Cites

Show all 37 references

Cited by

See all 17

Metadata

Authors
Gapp, B. V., Konopka, T., Penz, T., Dalal, V., Bürckstümmer, T., Bock, C., & Nijman, S. M.
Affiliations
  • University of Oxford (GB)
  • Austrian Academy of Sciences (AT)
Corresponding author
Nijman, Sebastian MB
Venue
Molecular Systems Biology
Published
2016-08-01
Volume
12
Issue
8
Pages
879-879
ISSN
1744-4292 (ISSN-L)
OpenAlex
W2485369312
Cited by
12
References
39
Citations by year
2024: 1 · 2023: 1 · 2022: 1 · 2021: 1 · 2020: 2 · 2017: 5 · 2016: 1
FWCI
1.61
Type
journal article
Language
en
Open access
Licence
Locations
  • Molecular Systems Biology (publishedVersion, cc-by)
  • PubMed Central (publishedVersion, cc-by)
  • PubMed (publishedVersion)
  • DOAJ (DOAJ: Directory of Open Access Journals) (submittedVersion)
  • Max Planck Digital Library (submittedVersion, other-oa)
  • MPG.PuRe (Max Planck Society) (submittedVersion, cc-by)
Funders
  • European Research Council (311166)
  • Boehringer Ingelheim Fonds
Topics
  • Life Sciences › Biochemistry, Genetics and Molecular Biology › Genetics › Genomics and Rare Diseases
  • Life Sciences › Biochemistry, Genetics and Molecular Biology › Molecular Biology › Bioinformatics and Genomic Networks
  • Life Sciences › Biochemistry, Genetics and Molecular Biology › Molecular Biology › CRISPR and Genetic Engineering
Keywords
gene knockout, tyrosine kinase, signaling pathways, genotype-phenotype mapping, human disease genes
MeSH terms
Cell Line, Genotype, Humans, Phenotype, Protein-Tyrosine Kinases, Sequence Analysis, RNA, Gene Expression Profiling, Gene Knockout Techniques, Molecular Sequence Annotation, Reverse Genetics

About these checks

Registry, retraction, Cites and statistics results are computed, not judged, with one exception: a printed reference that no index lists is read once by a model before it counts as a citation error. Claims are extracted by a model and kept only when their quote appears verbatim in the text; each cited source is then checked, with a model’s help, for whether it says what the claim relies on. Those verdicts can be wrong — read the claim’s quote and the cited source before relying on one.

Statistics and arithmetic are recomputed, not judged.

Confidence bands are shown only for fields calibrated on our annotated test set. None is calibrated yet, so no band is shown.

What counts as a claim ›How we measure confidence ›How we check this ›

Are you an author, or do you see a problem with this page? Request a review

Data sources

Bibliographic data: Semantic Scholar, OpenAlex, Crossref.

Contains information from the Semantic Scholar Academic Graph Datasets, made available under the ODC Attribution License (ODC-BY 1.0).

Semantic Scholar’s data is described in: Kinney, R., et al. (2023). The Semantic Scholar Open Data Platform. arXiv:2301.10140.