Cited by 284Computational Drug Discovery MethodsProtein Structure and Dynamicsvaccines and immunoinformatics approaches

The DOI matches its Crossref record; 51 of the 52 references it cites were found in a registry or an index.

Benchmarking AlphaFold‐enabled molecular docking predictions for antibiotic discovery

Open access

Abstract

Efficient identification of drug mechanisms of action remains a challenge. Computational docking approaches have been widely used to predict drug binding targets; yet, such approaches depend on existing protein structures, and accurate structural predictions have only recently become available from AlphaFold2. Here, we combine AlphaFold2 with molecular docking simulations to predict protein‐ligand interactions between 296 proteins spanning Escherichia coli 's essential proteome, and 218 active antibacterial compounds and 100 inactive compounds, respectively, pointing to widespread compound and protein promiscuity. We benchmark model performance by measuring enzymatic activity for 12 essential proteins treated with each antibacterial compound. We confirm extensive promiscuity, but find that the average area under the receiver operating characteristic curve (auROC) is 0.48, indicating weak model performance. We demonstrate that rescoring of docking poses using machine learning‐based approaches improves model performance, resulting in average auROCs as large as 0.63, and that ensembles of rescoring functions improve prediction accuracy and the ratio of true‐positive rate to false‐positive rate. This work indicates that advances in modeling protein‐ligand interactions, particularly using machine learning‐based approaches, are needed to better harness AlphaFold2 for drug discovery.

Overview

The claims and statistics of this paper haven’t been checked yet.

Run the check — free, no account needed. It reads the open-access text and checks the sources it cites.

A few free checks a day · papers already verified open instantly · results are public

Integrity signals

Registry

Crossref · 10.15252/msb.202211081

Cites

51 of 51 references verified0 citation errors · 0 not checkable

Statistics

Figures

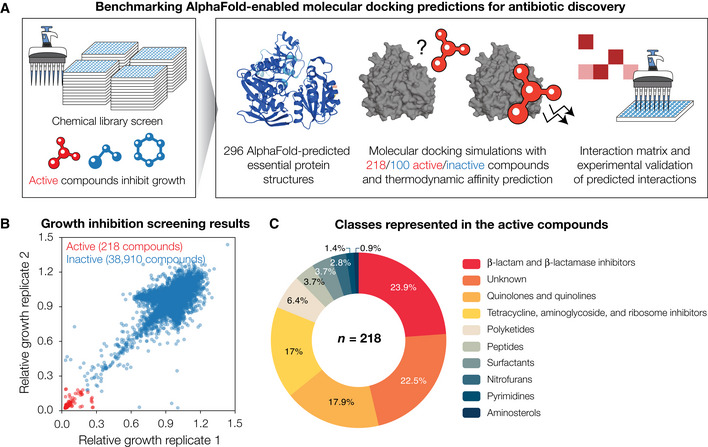
Figure 1 Growth inhibition screens in Escherichia coli reveal 218 active compounds, whose interactions with essential proteins are predicted by combining AlphaFold2 with molecular docking ASchematic of the approach. To define our chemical space of interest, we performed high‐throughput screens of growth inhibition against wild‐type E. coli. Compounds that inhibited growth were taken as active, and each active compound was computationally docked with each of 296 AlphaFold2‐predicted E. coli essential protein structures. For comparison, a subset of the inactive compounds was docked in the same way. An interaction matrix showing the thermodynamic binding affinities predicted by the docking simulations was then constructed. A protein‐ligand interaction was predicted to occur if its predicted binding affinity was smaller than a threshold value. All possible interactions for a subset of essential proteins, including those not predicted to occur, were empirically tested to benchmark model performance.BGrowth inhibition measurements for 39,128 compounds, from which 218 compounds (including known antibiotics) were identified as active against E. coli BW25113. Data are shown from two biological replicates. Compounds with mean relative growth less than 0.2 were classified as active (red points), and all other compounds were classified as inactive (blue points).CDistribution of the compound classes represented in the 218 active compounds.
Figure 1 Growth inhibition screens in Escherichia coli reveal 218 active compounds, whose interactions with essential proteins are predicted by combining AlphaFold2 with molecular docking ASchematic of the approach. To define our chemical space of interest, we performed high‐throughput screens of growth inhibition against wild‐type E. coli. Compounds that inhibited growth were taken as active, and each active compound was computationally docked with each of 296 AlphaFold2‐predicted E. coli essential protein structures. For comparison, a subset of the inactive compounds was docked in the same way. An interaction matrix showing the thermodynamic binding affinities predicted by the docking simulations was then constructed. A protein‐ligand interaction was predicted to occur if its predicted binding affinity was smaller than a threshold value. All possible interactions for a subset of essential proteins, including those not predicted to occur, were empirically tested to benchmark model performance.BGrowth inhibition measurements for 39,128 compounds, from which 218 compounds (including known antibiotics) were identified as active against E. coli BW25113. Data are shown from two biological replicates. Compounds with mean relative growth less than 0.2 were classified as active (red points), and all other compounds were classified as inactive (blue points).CDistribution of the compound classes represented in the 218 active compounds.CC BY · PubMed Central
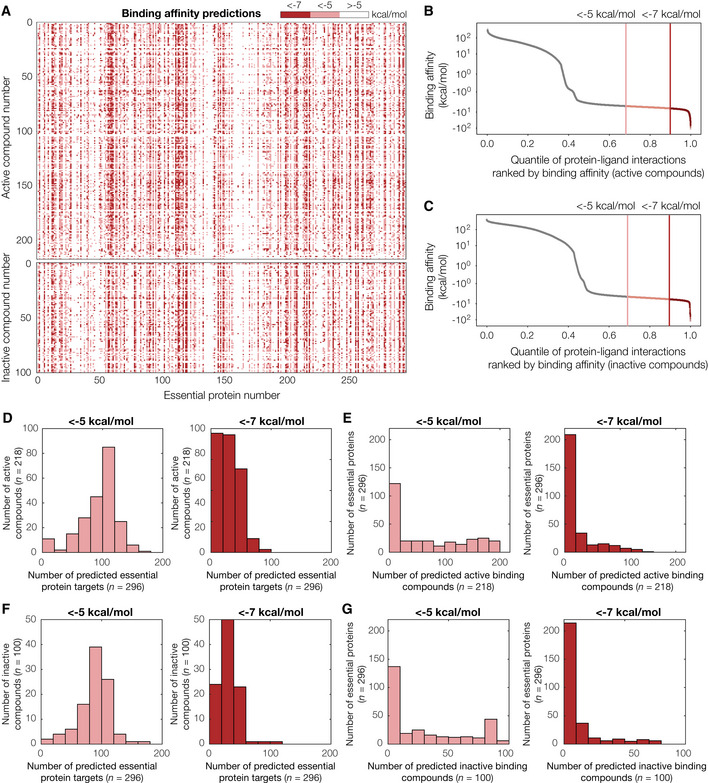
Figure 2 Binding affinity predictions for 218 active compounds, 100 inactive compounds, and 296 AlphaFold2‐predicted Escherichia coli essential protein structures AInteraction matrix showing the predicted binding affinities (kcal/mol) between all pairs of active or inactive compounds and essential proteins modeled, discretized into bins of < −7 kcal/mol (strong predicted binding), < −5 kcal/mol (moderate predicted binding), and > −5 kcal/mol (no predicted binding). Predictions for active compounds are shown at top, and inactive compounds are shown at bottom.B, CRank‐ordered binding affinities for the protein‐ligand pairs modeled by our approach. Vertical lines indicate binding affinity thresholds of −5 kcal/mol and −7 kcal/mol. Plots are for protein‐ligand interactions involving all 218 active compounds (B) or 100 inactive compounds (C).DHistograms of numbers of predicted essential protein targets with binding affinity < −5 kcal/mol (left) or < −7 kcal/mol (right), for all 218 active compounds.EHistograms of numbers of predicted binding compounds with binding affinity < −5 kcal/mol (left) or < −7 kcal/mol (right), for all 296 essential proteins.F, GSimilar to (D–E), but for all 100 inactive compounds modeled.
Figure 2 Binding affinity predictions for 218 active compounds, 100 inactive compounds, and 296 AlphaFold2‐predicted Escherichia coli essential protein structures AInteraction matrix showing the predicted binding affinities (kcal/mol) between all pairs of active or inactive compounds and essential proteins modeled, discretized into bins of < −7 kcal/mol (strong predicted binding), < −5 kcal/mol (moderate predicted binding), and > −5 kcal/mol (no predicted binding). Predictions for active compounds are shown at top, and inactive compounds are shown at bottom.B, CRank‐ordered binding affinities for the protein‐ligand pairs modeled by our approach. Vertical lines indicate binding affinity thresholds of −5 kcal/mol and −7 kcal/mol. Plots are for protein‐ligand interactions involving all 218 active compounds (B) or 100 inactive compounds (C).DHistograms of numbers of predicted essential protein targets with binding affinity < −5 kcal/mol (left) or < −7 kcal/mol (right), for all 218 active compounds.EHistograms of numbers of predicted binding compounds with binding affinity < −5 kcal/mol (left) or < −7 kcal/mol (right), for all 296 essential proteins.F, GSimilar to (D–E), but for all 100 inactive compounds modeled.CC BY · PubMed Central
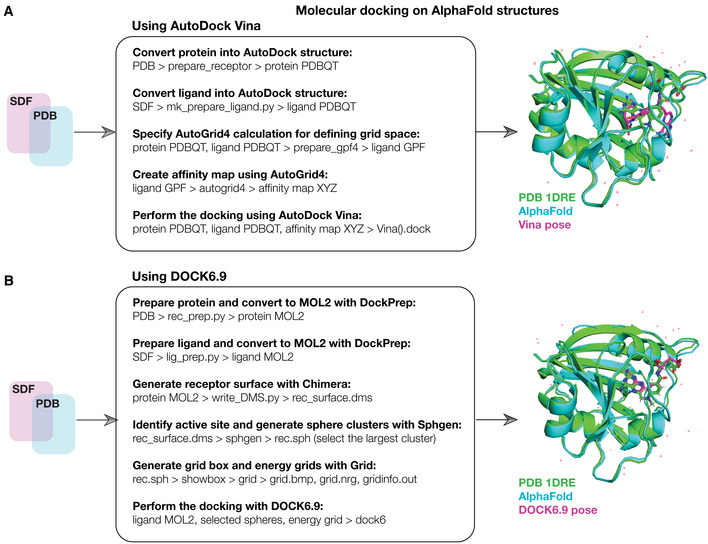
Figure EV1 Schematic of the computational docking approach A(Left) Schematic of the computational docking approach using AutoDock Vina. 296 essential proteins in E. coli were identified, and their AlphaFold2‐predicted structures were curated. The 218 active compounds and 100 inactive compounds were represented in three dimensions in SDF files. All compounds and proteins were prepared for docking as shown and then docked using AutoDock Vina run on a high‐performance computing server. The resulting binding pose and thermodynamic binding affinity predictions for all 64,528 (active compounds) and 29,600 (inactive compounds) pairwise protein‐ligand interactions were analyzed and ranked. (Right) Superimposed predicted and experimental structures for methotrexate binding to E. coli FolA (PDB 1DRE), which was used as a positive docking control from the Protein Data Bank (Dataset EV2).BSimilar to (A), but for the docking of 218 active compounds and 100 inactive compounds, and a subset of 12 essential proteins, respectively, using DOCK6.9. The 12 selected essential proteins correspond to all proteins empirically tested in this study.
Figure EV1 Schematic of the computational docking approach A(Left) Schematic of the computational docking approach using AutoDock Vina. 296 essential proteins in E. coli were identified, and their AlphaFold2‐predicted structures were curated. The 218 active compounds and 100 inactive compounds were represented in three dimensions in SDF files. All compounds and proteins were prepared for docking as shown and then docked using AutoDock Vina run on a high‐performance computing server. The resulting binding pose and thermodynamic binding affinity predictions for all 64,528 (active compounds) and 29,600 (inactive compounds) pairwise protein‐ligand interactions were analyzed and ranked. (Right) Superimposed predicted and experimental structures for methotrexate binding to E. coli FolA (PDB 1DRE), which was used as a positive docking control from the Protein Data Bank (Dataset EV2).BSimilar to (A), but for the docking of 218 active compounds and 100 inactive compounds, and a subset of 12 essential proteins, respectively, using DOCK6.9. The 12 selected essential proteins correspond to all proteins empirically tested in this study.CC BY · PubMed Central
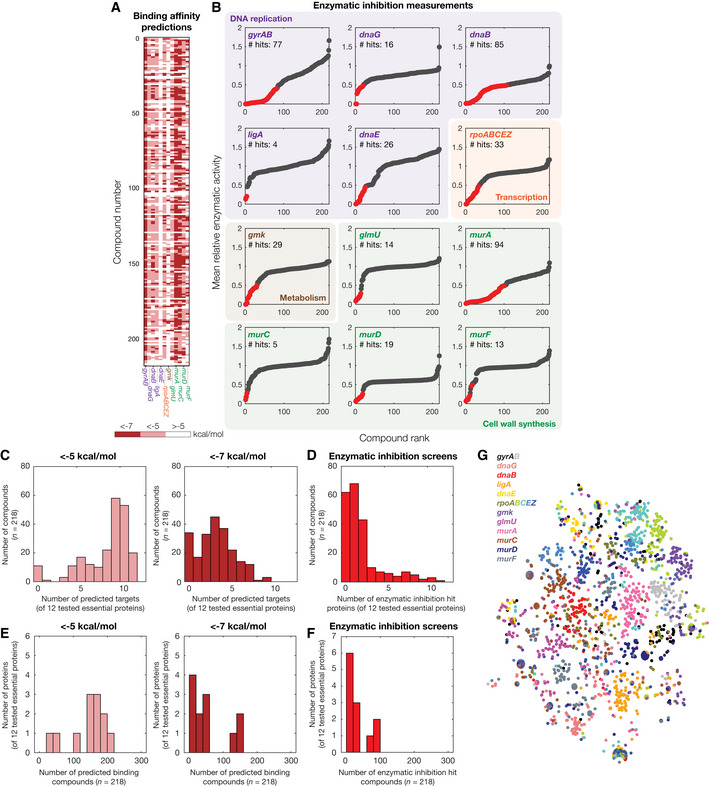
Figure 3 In vitro enzymatic measurements of protein‐ligand interactions AInteraction matrix showing the predicted binding affinities (kcal/mol) between all pairs of active compounds and 12 essential proteins tested for enzymatic inhibition, discretized into bins of < −7 kcal/mol, < −5 kcal/mol, and > −5 kcal/mol.BRank‐ordered mean relative enzymatic activity across all 218 active compounds, at a final concentration of 100 μM, for each of 12 essential proteins experimentally tested for enzymatic inhibition. Essential proteins correspond to the genes indicated and are involved in DNA replication (purple), transcription (orange), metabolism (brown), and cell wall synthesis (green). Results show the mean of two biological replicates, and relative activity is measured with respect to untreated controls. Binding interaction hits are protein‐ligand interactions with relative enzymatic activities of < 50% in both replicates (red points). All other interactions are designated as non‐hits (gray points).CHistogram of numbers of predicted essential protein targets with binding affinity < −5 kcal/mol (left) or < −7 kcal/mol (right), for all 218 active compounds and all 12 essential proteins tested in (B).DHistogram of numbers of enzymatic inhibition hit proteins, for all 218 active compounds and all 12 essential proteins tested in (B).EHistogram of numbers of predicted binding compounds with binding affinity < −5 kcal/mol (left) or < −7 kcal/mol (right), for all 218 active compounds and all 12 essential proteins tested in (B).FHistogram of numbers of enzymatic inhibition hit compounds, for all 218 active compounds and all 12 essential proteins tested in (B).Gt‐SNE plot of protein‐ligand interaction fingerprints, colored by protein and protein subunit.
Figure 3 In vitro enzymatic measurements of protein‐ligand interactions AInteraction matrix showing the predicted binding affinities (kcal/mol) between all pairs of active compounds and 12 essential proteins tested for enzymatic inhibition, discretized into bins of < −7 kcal/mol, < −5 kcal/mol, and > −5 kcal/mol.BRank‐ordered mean relative enzymatic activity across all 218 active compounds, at a final concentration of 100 μM, for each of 12 essential proteins experimentally tested for enzymatic inhibition. Essential proteins correspond to the genes indicated and are involved in DNA replication (purple), transcription (orange), metabolism (brown), and cell wall synthesis (green). Results show the mean of two biological replicates, and relative activity is measured with respect to untreated controls. Binding interaction hits are protein‐ligand interactions with relative enzymatic activities of < 50% in both replicates (red points). All other interactions are designated as non‐hits (gray points).CHistogram of numbers of predicted essential protein targets with binding affinity < −5 kcal/mol (left) or < −7 kcal/mol (right), for all 218 active compounds and all 12 essential proteins tested in (B).DHistogram of numbers of enzymatic inhibition hit proteins, for all 218 active compounds and all 12 essential proteins tested in (B).EHistogram of numbers of predicted binding compounds with binding affinity < −5 kcal/mol (left) or < −7 kcal/mol (right), for all 218 active compounds and all 12 essential proteins tested in (B).FHistogram of numbers of enzymatic inhibition hit compounds, for all 218 active compounds and all 12 essential proteins tested in (B).Gt‐SNE plot of protein‐ligand interaction fingerprints, colored by protein and protein subunit.CC BY · PubMed Central
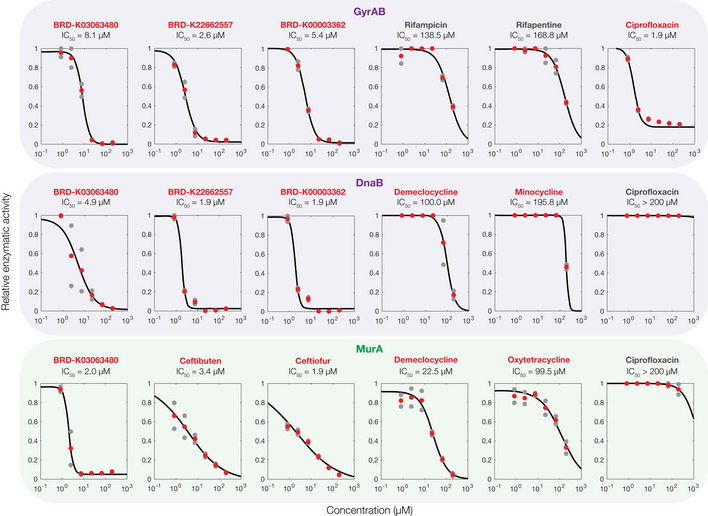
Figure EV2 Enzymatic inhibition screen validation experiments Dose–response experiments showing the relative enzymatic activity of three essential proteins, each treated with six antibacterial compounds. Relative activity is measured with respect to untreated controls. Data from two biological replicates (gray points) are shown, and mean activity values (red points) were fit to Hill functions (black curves) to estimate IC50 values. Compound names in red indicate hits from the screens shown in Fig 3 of the main text, and compound names in gray indicate non‐hits. Essential proteins correspond to the genes indicated and are involved in DNA replication (purple) and cell wall synthesis (green).
Figure EV2 Enzymatic inhibition screen validation experiments Dose–response experiments showing the relative enzymatic activity of three essential proteins, each treated with six antibacterial compounds. Relative activity is measured with respect to untreated controls. Data from two biological replicates (gray points) are shown, and mean activity values (red points) were fit to Hill functions (black curves) to estimate IC50 values. Compound names in red indicate hits from the screens shown in Fig 3 of the main text, and compound names in gray indicate non‐hits. Essential proteins correspond to the genes indicated and are involved in DNA replication (purple) and cell wall synthesis (green).CC BY · PubMed Central
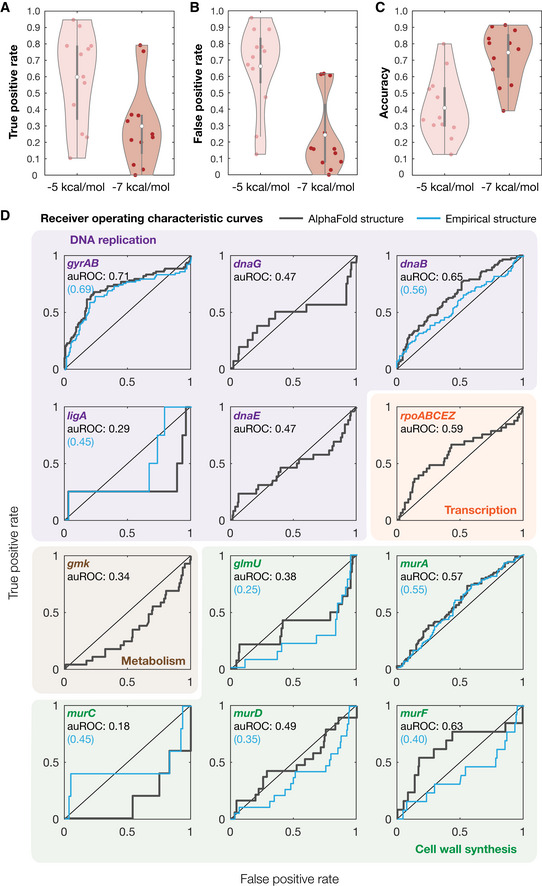
Figure 4 Benchmarking model performance A–CDistributions of true‐positive rates (A), false‐positive rates (B), and accuracy (C) across all 12 empirically tested essential proteins, for binding affinity thresholds of −5 kcal/mol and −7 kcal/mol. White points indicate mean values, and gray bars indicate ranges of 25th to 75th percentile values (Q 1 and Q 3, respectively). The whiskers of the gray box plots indicate ranges of values not considered outliers, that is, those between Q 1 – 1.5 × IQR and Q 3 + 1.5 × IQR, where IQR = Q 3 – Q 1 is the interquartile range.DReceiver operating characteristic (ROC) curves (gray) for all 12 empirically tested essential proteins. Essential proteins correspond to the genes indicated and are involved in DNA replication (purple), transcription (orange), metabolism (brown), and cell wall synthesis (green). The black diagonal line indicates the benchmark generated by random guessing. Blue curves are ROC curves generated using experimentally determined protein structures, where available. auROC—area under the ROC curve.
Figure 4 Benchmarking model performance A–CDistributions of true‐positive rates (A), false‐positive rates (B), and accuracy (C) across all 12 empirically tested essential proteins, for binding affinity thresholds of −5 kcal/mol and −7 kcal/mol. White points indicate mean values, and gray bars indicate ranges of 25th to 75th percentile values (Q 1 and Q 3, respectively). The whiskers of the gray box plots indicate ranges of values not considered outliers, that is, those between Q 1 – 1.5 × IQR and Q 3 + 1.5 × IQR, where IQR = Q 3 – Q 1 is the interquartile range.DReceiver operating characteristic (ROC) curves (gray) for all 12 empirically tested essential proteins. Essential proteins correspond to the genes indicated and are involved in DNA replication (purple), transcription (orange), metabolism (brown), and cell wall synthesis (green). The black diagonal line indicates the benchmark generated by random guessing. Blue curves are ROC curves generated using experimentally determined protein structures, where available. auROC—area under the ROC curve.CC BY · PubMed Central
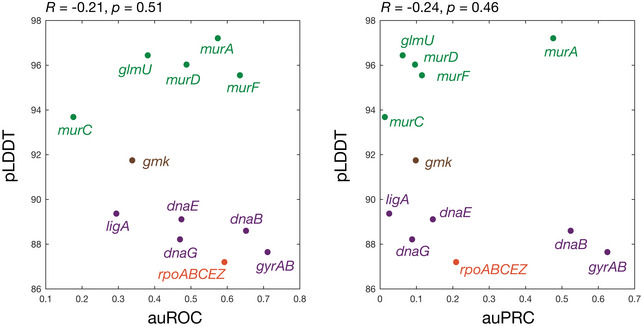
Figure EV3 No correlation between model performance and AlphaFold2 prediction confidence Shown is a plot of the auROC values from Fig 4D of the main text or auPRC values from Fig EV5 against AlphaFold2's per‐residue confidence score (pLDDT), averaged across each protein, for all 12 empirically tested essential proteins. Essential proteins correspond to the genes indicated and are involved in DNA replication (purple), transcription (orange), metabolism (brown), and cell wall synthesis (green). Higher pLDDT scores indicate higher model confidence. The Pearson correlation coefficients, R, and corresponding P‐values are indicated.
Figure EV3 No correlation between model performance and AlphaFold2 prediction confidence Shown is a plot of the auROC values from Fig 4D of the main text or auPRC values from Fig EV5 against AlphaFold2's per‐residue confidence score (pLDDT), averaged across each protein, for all 12 empirically tested essential proteins. Essential proteins correspond to the genes indicated and are involved in DNA replication (purple), transcription (orange), metabolism (brown), and cell wall synthesis (green). Higher pLDDT scores indicate higher model confidence. The Pearson correlation coefficients, R, and corresponding P‐values are indicated.CC BY · PubMed Central
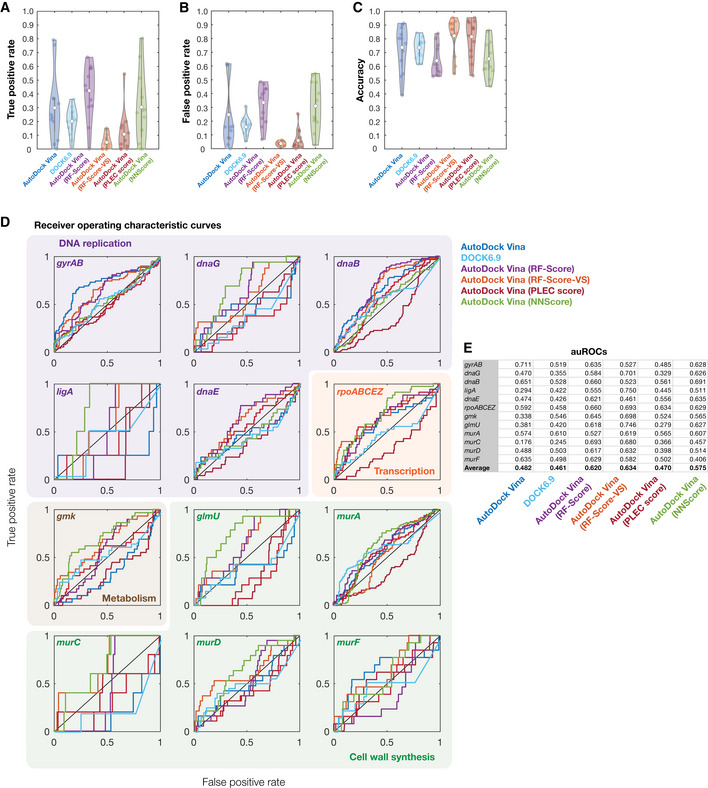
Figure EV4 Model performance for different rescoring functions A–CDistributions of true‐positive rates (A), false‐positive rates (B), and accuracy (C) across all 12 empirically tested essential proteins, for binding affinity thresholds of −7 kcal/mol (AutoDock Vina), −70 kcal/mol (DOCK6.9), or pK d > 7 (AutoDock Vina with all rescoring functions). White points indicate mean values, and gray bars indicate ranges of 25th to 75th percentile values (Q 1 and Q 3, respectively). The whiskers of the gray box plots indicate ranges of values not considered outliers, that is, those between Q 1 – 1.5 × IQR and Q 3 + 1.5 × IQR, where IQR = Q 3 – Q 1 is the interquartile range.DReceiver operating characteristic (ROC) curves for all 12 empirically tested essential proteins. Essential proteins correspond to the genes indicated and are involved in DNA replication (purple), transcription (orange), metabolism (brown), and cell wall synthesis (green). The black diagonal line indicates the benchmark generated by random guessing. ROC curves are colored according to the model used. Curves for AutoDock Vina (dark blue curves) are identical to those shown in Fig 4D of the main text and are reproduced here to facilitate comparison between models.EArea under the ROC curve (auROC) values for each empirically tested essential protein and each model used.
Figure EV4 Model performance for different rescoring functions A–CDistributions of true‐positive rates (A), false‐positive rates (B), and accuracy (C) across all 12 empirically tested essential proteins, for binding affinity thresholds of −7 kcal/mol (AutoDock Vina), −70 kcal/mol (DOCK6.9), or pK d > 7 (AutoDock Vina with all rescoring functions). White points indicate mean values, and gray bars indicate ranges of 25th to 75th percentile values (Q 1 and Q 3, respectively). The whiskers of the gray box plots indicate ranges of values not considered outliers, that is, those between Q 1 – 1.5 × IQR and Q 3 + 1.5 × IQR, where IQR = Q 3 – Q 1 is the interquartile range.DReceiver operating characteristic (ROC) curves for all 12 empirically tested essential proteins. Essential proteins correspond to the genes indicated and are involved in DNA replication (purple), transcription (orange), metabolism (brown), and cell wall synthesis (green). The black diagonal line indicates the benchmark generated by random guessing. ROC curves are colored according to the model used. Curves for AutoDock Vina (dark blue curves) are identical to those shown in Fig 4D of the main text and are reproduced here to facilitate comparison between models.EArea under the ROC curve (auROC) values for each empirically tested essential protein and each model used.CC BY · PubMed Central
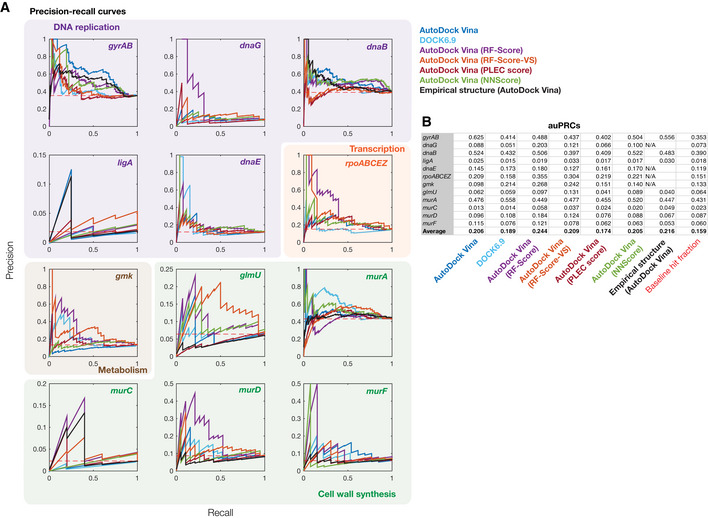
Figure EV5 Precision‐recall for different rescoring functions APrecision‐recall (PR) curves for all 12 empirically tested essential proteins. Essential proteins correspond to the genes indicated and are involved in DNA replication (purple), transcription (orange), metabolism (brown), and cell wall synthesis (green). The red dashed line indicates the benchmark generated by random guessing, corresponding to recall values equal to the baseline hit fraction. PR curves are colored according to the model or protein structure used.BArea under the PR curve (auPRC) values for each empirically tested essential protein and each model used.
Figure EV5 Precision‐recall for different rescoring functions APrecision‐recall (PR) curves for all 12 empirically tested essential proteins. Essential proteins correspond to the genes indicated and are involved in DNA replication (purple), transcription (orange), metabolism (brown), and cell wall synthesis (green). The red dashed line indicates the benchmark generated by random guessing, corresponding to recall values equal to the baseline hit fraction. PR curves are colored according to the model or protein structure used.BArea under the PR curve (auPRC) values for each empirically tested essential protein and each model used.CC BY · PubMed Central
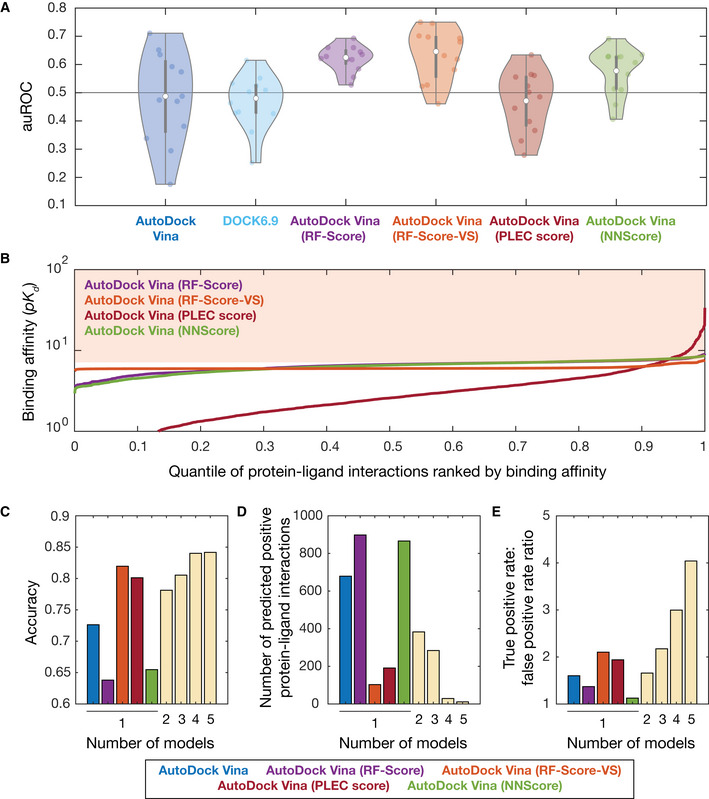
Figure 5 Benchmarking and improving model performance using machine learning AArea under the ROC curve (auROC) values for all 12 empirically tested essential proteins, across different molecular docking programs (AutoDock Vina and DOCK6.9) and different machine learning‐based pose scoring functions (RF‐Score, RF‐Score‐VS, PLEC score, and NNScore). White points indicate mean values, and gray bars indicate ranges of 25th to 75th percentile values (Q 1 and Q 3, respectively). The whiskers of the gray box plots indicate ranges of values not considered outliers, that is, those between Q 1 – 1.5 × IQR and Q 3 + 1.5 × IQR, where IQR = Q 3 − Q 1 is the interquartile range. The horizontal line at 0.5 indicates the benchmark generated by random guessing.BRank‐ordered binding affinities (pK d ) for the protein‐ligand pairs modeled by applying machine learning‐based rescoring functions on AutoDock Vina poses. Curves are colored according to the rescoring function used in (A). The shaded area indicates a binding affinity threshold of > 7.C–EDependence of prediction accuracy, number of predicted positives (protein‐ligand interactions), and true‐positive rate/false‐positive rate on the number of models used. Single models, based on AutoDock Vina poses, are colored according to (A) as shown at bottom. Model predictions based on the following rescoring functions were ensembled in sequence: RF‐Score, NNScore, PLEC score, and RF‐Score‐VS.
Figure 5 Benchmarking and improving model performance using machine learning AArea under the ROC curve (auROC) values for all 12 empirically tested essential proteins, across different molecular docking programs (AutoDock Vina and DOCK6.9) and different machine learning‐based pose scoring functions (RF‐Score, RF‐Score‐VS, PLEC score, and NNScore). White points indicate mean values, and gray bars indicate ranges of 25th to 75th percentile values (Q 1 and Q 3, respectively). The whiskers of the gray box plots indicate ranges of values not considered outliers, that is, those between Q 1 – 1.5 × IQR and Q 3 + 1.5 × IQR, where IQR = Q 3 − Q 1 is the interquartile range. The horizontal line at 0.5 indicates the benchmark generated by random guessing.BRank‐ordered binding affinities (pK d ) for the protein‐ligand pairs modeled by applying machine learning‐based rescoring functions on AutoDock Vina poses. Curves are colored according to the rescoring function used in (A). The shaded area indicates a binding affinity threshold of > 7.C–EDependence of prediction accuracy, number of predicted positives (protein‐ligand interactions), and true‐positive rate/false‐positive rate on the number of models used. Single models, based on AutoDock Vina poses, are colored according to (A) as shown at bottom. Model predictions based on the following rescoring functions were ensembled in sequence: RF‐Score, NNScore, PLEC score, and RF‐Score‐VS.CC BY · PubMed Central

Verification

Claims the paper makes

The claims and statistics of this paper haven’t been checked yet.

Run the check — free, no account needed. It reads the open-access text and checks the sources it cites.

A few free checks a day · papers already verified open instantly · results are public

Claims other papers make about this one

Each is checked against this paper’s own text: does it say what the citing paper says it does?

Self-check

Percentages, sums and reported differences re-computed from the paper’s own numbers.

The self-check needs the paper’s full text.

Citations

Cites

Show all 52 references

Cited by

Sorted by citations

See all 284

Metadata

Authors
Wong, F., Krishnan, A., Zheng, E. J., Stärk, H., Manson, A. L., Earl, A. M., Jaakkola, T., & Collins, J. J.
Affiliations
  • Broad Institute (US)
  • MIT Computer Science and Artificial Intelligence Laboratory (US)
Corresponding author
Collins, James J
Venue
Molecular Systems Biology
Published
2022-09-01
Volume
18
Issue
9
Pages
e11081-e11081
ISSN
1744-4292 (ISSN-L)
OpenAlex
W4294719209
Cited by
284
References
52
Citations by year
2026: 61 · 2025: 85 · 2024: 70 · 2023: 60 · 2022: 8
FWCI
30.16
Type
journal article
Language
en
Open access
Locations
  • Molecular Systems Biology (publishedVersion, cc-by)
  • PubMed Central (publishedVersion, cc-by)
  • PubMed (publishedVersion)
  • DOAJ (DOAJ: Directory of Open Access Journals) (submittedVersion, cc-by-sa)
  • DSpace@MIT (Massachusetts Institute of Technology) (submittedVersion, cc-by-nc)
Funders
  • Broad Institute of MIT and Harvard
  • Flu Lab, LLC
  • HHS¦NIH¦National Institute of Allergy and Infectious Diseases (U19AI110818, R01‐AI146194)
  • HHS¦NIH¦National Institute of General Medical Sciences (P41‐GM103311)
  • James S. McDonnell Foundation
  • Rosamund Zander and Hansjorg Wyss
  • Sea Grape Foundation
  • Swiss National Science Foundation (SNSF_ 203071)
  • The Audacious Project
Topics
  • Life Sciences › Pharmacology, Toxicology and Pharmaceutics › Drug Discovery › Computational Drug Discovery Methods
  • Life Sciences › Biochemistry, Genetics and Molecular Biology › Molecular Biology › Protein Structure and Dynamics
  • Life Sciences › Biochemistry, Genetics and Molecular Biology › Molecular Biology › vaccines and immunoinformatics approaches
Keywords
AlphaFold2, molecular docking, protein-ligand interactions, antibiotic discovery, antibacterial agents, machine learning, drug target prediction, benchmarking
MeSH terms
Anti-Bacterial Agents, Ligands, Protein Binding, Proteins, Benchmarking, Molecular Docking Simulation

About these checks

Registry, retraction, Cites and statistics results are computed, not judged, with one exception: a printed reference that no index lists is read once by a model before it counts as a citation error. Claims are extracted by a model and kept only when their quote appears verbatim in the text; each cited source is then checked, with a model’s help, for whether it says what the claim relies on. Those verdicts can be wrong — read the claim’s quote and the cited source before relying on one.

Statistics and arithmetic are recomputed, not judged.

Confidence bands are shown only for fields calibrated on our annotated test set. None is calibrated yet, so no band is shown.

What counts as a claim ›How we measure confidence ›How we check this ›

Are you an author, or do you see a problem with this page? Request a review