

The DOI matches its Crossref record; 30 of the 31 references it cites were found in a registry or an index; none of the 21 sources its claims cite is checked for support yet.
Prevalence and Early Identification of Autism Spectrum Disorder Among Children Aged 4 and 8 Years — Autism and Developmental Disabilities Monitoring Network, 16 Sites, United States, 2022
Open accessAbstract
Problem/Condition: Autism spectrum disorder (ASD). Period Covered: 2022. Description of System: The Autism and Developmental Disabilities Monitoring Network is an active surveillance program that estimates prevalence and characteristics of ASD and monitors timing of ASD identification among children aged 4 and 8 years. In 2022, a total of 16 sites (located in Arizona, Arkansas, California, Georgia, Indiana, Maryland, Minnesota, Missouri, New Jersey, Pennsylvania, Puerto Rico, Tennessee, Texas [two sites: Austin and Laredo], Utah, and Wisconsin) conducted surveillance for ASD among children aged 4 and 8 years and suspected ASD among children aged 4 years. Surveillance included children who lived in the surveillance area at any time during 2022. Children were classified as having ASD if they ever received 1) an ASD diagnostic statement in a comprehensive developmental evaluation, 2) autism special education eligibility, or 3) an ASD International Classification of Diseases, Ninth Revision (ICD-9) code in the 299 range or International Classification of Diseases, Tenth Revision (ICD-10) code of F84.0, F84.3, F84.5, F84.8, or F84.9. Children aged 4 years were classified as having suspected ASD if they did not meet the case definition for ASD but had an evaluator's suspicion of ASD documented in a comprehensive developmental evaluation. Results: Among children aged 8 years in 2022, ASD prevalence was 32.2 per 1,000 children (one in 31) across the 16 sites, ranging from 9.7 in Texas (Laredo) to 53.1 in California. The overall observed prevalence estimate was similar to estimates calculated using Bayesian hierarchical and random effects models. ASD was 3.4 times as prevalent among boys (49.2) than girls (14.3). Overall, ASD prevalence was lower among non-Hispanic White (White) children (27.7) than among Asian or Pacific Islander (A/PI) (38.2), American Indian or Alaska Native (AI/AN) (37.5), non-Hispanic Black or African American (Black) (36.6), Hispanic or Latino (Hispanic) (33.0), and multiracial children (31.9). No association was observed between ASD prevalence and neighborhood median household income (MHI) at 11 sites; higher ASD prevalence was associated with lower neighborhood MHI at five sites.Record abstraction was completed for 15 of the 16 sites for 8,613 children aged 8 years who met the ASD case definition. Of these 8,613 children, 68.4% had a documented diagnostic statement of ASD, 67.3% had a documented autism special education eligibility, and 68.9% had a documented ASD ICD-9 or ICD-10 code. All three elements of the ASD case definition were present for 34.6% of children aged 8 years with ASD.Among 5,292 (61.4% of 8,613) children aged 8 years with ASD with information on cognitive ability, 39.6% were classified as having an intellectual disability. Intellectual disability was present among 52.8% of Black, 50.0% of AI/AN, 43.9% of A/PI, 38.8% of Hispanic, 32.7% of White, and 31.2% of multiracial children with ASD. The median age of earliest known ASD diagnosis was 47 months and ranged from 36 months in California to 69.5 months in Texas (Laredo).Cumulative incidence of ASD diagnosis or eligibility by age 48 months was higher among children born in 2018 (aged 4 years in 2022) than children born in 2014 (aged 8 years in 2022) at 13 of the 15 sites that were able to abstract records. Overall cumulative incidence of ASD diagnosis or eligibility by age 48 months was 1.7 times as high among those born in 2018 compared with those born in 2014 and ranged from 1.4 times as high in Arizona and Georgia to 3.1 times as high in Puerto Rico. Among children aged 4 years, for every 10 children meeting the case definition of ASD, one child met the definition of suspected ASD.Children with ASD who were born in 2018 had more evaluations and identification during ages 0-4 years than children with ASD who were born in 2014 during the 0-4 years age window, with an interruption in the pattern in early 2020 coinciding with onset of the COVID-19 pandemic.Overall, 66.5% of children aged 8 years with ASD had a documented autism test. Use of autism tests varied widely across sites: 24.7% (New Jersey) to 93.5% (Puerto Rico) of children aged 8 years with ASD had a documented autism test in their records. The most common tests documented for children aged 8 years were the Autism Diagnostic Observation Schedule, Autism Spectrum Rating Scales, Childhood Autism Rating Scale, Gilliam Autism Rating Scale, and Social Responsiveness Scale. Interpretation: Prevalence of ASD among children aged 8 years was higher in 2022 than previous years. ASD prevalence was higher among A/PI, Black, and Hispanic children aged 8 years than White children aged 8 years, continuing a pattern first observed in 2020. A/PI, Black, and Hispanic children aged 8 years with ASD were also more likely than White or multiracial children with ASD to have a co-occurring intellectual disability. Identification by age 48 months was higher among children born in 2018 com
Overview
AI snapshot
Written from the paper’s full text.
TL;DR
In 2022, ASD prevalence among children aged 8 years across 16 ADDM Network sites was 32.2 per 1,000 (one in 31), with wide site variation and higher prevalence among several racial and ethnic groups than White children. Early identification by age 48 months was 1.7 times as high among children born in 2018 compared with those born in 2014.
Key findings
- Among children aged 8 years, ASD prevalence was 32.2 per 1,000, ranging from 9.7 in Texas (Laredo) to 53.1 in California; prevalence was 49.2 per 1,000 among boys and 14.3 among girls (male-to-female ratio 3.4).
- Prevalence was lower among White children (27.7) than A/PI (38.2), AI/AN (37.5), Black (36.6), Hispanic (33.0), and multiracial children (31.9).
- Among 5,292 children aged 8 years with ASD and cognitive data, 39.6% had intellectual disability (IQ ≤70); median age of earliest known ASD diagnosis was 47 months.
- Cumulative incidence of ASD diagnosis or eligibility by age 48 months was 1.7 times as high among children born in 2018 (22.6 per 1,000) compared with children born in 2014 (13.1 per 1,000); suspected ASD among children aged 4 years was 3.1 per 1,000, or one suspected case for every 10 children meeting ASD case definition.
Methods
- Active surveillance in 16 sites in 2022 among children aged 4 and 8 years, using health and education records; ASD case definition required an ASD diagnostic statement, autism special education eligibility, or qualifying ICD-9/ICD-10 code, with suspected ASD defined for children aged 4 years.
- Record abstraction was completed for 15 sites for 8,613 children aged 8 years who met the ASD case definition; analyses included prevalence by sex, race and ethnicity, neighborhood median household income, and social vulnerability index.
- Prevalence was calculated per 1,000 children, with Bayesian hierarchical and random-effects models also used for overall estimates; cumulative incidence by age 48 months and monthly evaluation/identification patterns were compared between birth cohorts.
Limitations
- The paper states that ADDM surveillance populations are not nationally representative, overall estimates do not capture full community variability, and data quality depends on availability and completeness of records, which vary by site and source.
- The paper also states that sources reviewed generally do not include private schools or primary care providers, and that the surveillance definition of intellectual disability is not the same as a clinical diagnosis; IQ in young children may lack stability and adaptive behavior assessments are often absent.
- Evident from the text: Indiana was excluded from record-abstraction analyses because ASD diagnostic statement data were unavailable, and several site-specific estimates were suppressed because relative standard error was ≥30%.
Model-written summary. Check it against the paper before relying on it.
Integrity signals
Registry
Cites
Statistics
Figures
Verification
Claims the paper makes
93 Own result · 13 Not checked yet · 7 Own method · 7 Own interpretation · 2 No basis given
A result the paper reports from its own data — it cites no other source for it, so there is none to check. The quote shows it is in the paper.
In the paper
“The most common tests documented for children aged 8 years were the Autism Diagnostic Observation Schedule, Autism Spectrum Rating Scales, Childhood Autism Rating Scale, Gilliam Autism Rating Scale, and Social Responsiveness Scale.”
§ Prevalence and Early Identification of Autism Spectrum Disorder Among Children Aged 4 and 8 Years — Autism and Developmental Disabilities Monitoring Network, 16 Sites, United States, 2022 > Abstract > Results
plain- Asserted: passes — The authors put it forward as true.
- Checkable: passes — It can be checked against evidence.
- Load-bearing: unclear — It is unclear whether the paper’s conclusions depend on it.
- Based: passes — The paper gives a reason why it holds.
- Rests on an assumption: The surveillance ASD case definition accurately identifies children with ASD in the surveillance population.
A result the paper reports from its own data — it cites no other source for it, so there is none to check. The quote shows it is in the paper.
In the paper
“ASD prevalence was higher among A/PI, Black, and Hispanic children aged 8 years than White children aged 8 years, continuing a pattern first observed in 2020.”
§ Prevalence and Early Identification of Autism Spectrum Disorder Among Children Aged 4 and 8 Years — Autism and Developmental Disabilities Monitoring Network, 16 Sites, United States, 2022 > Abstract > Interpretation
plaincorrelational- Asserted: passes — The authors put it forward as true.
- Checkable: passes — It can be checked against evidence.
- Load-bearing: passes — The paper’s conclusions depend on it.
- Based: passes — The paper gives a reason why it holds.
- Rests on an assumption: The surveillance ASD case definition accurately identifies children with ASD in the surveillance population.
A result the paper reports from its own data — it cites no other source for it, so there is none to check. The quote shows it is in the paper.
In the paper
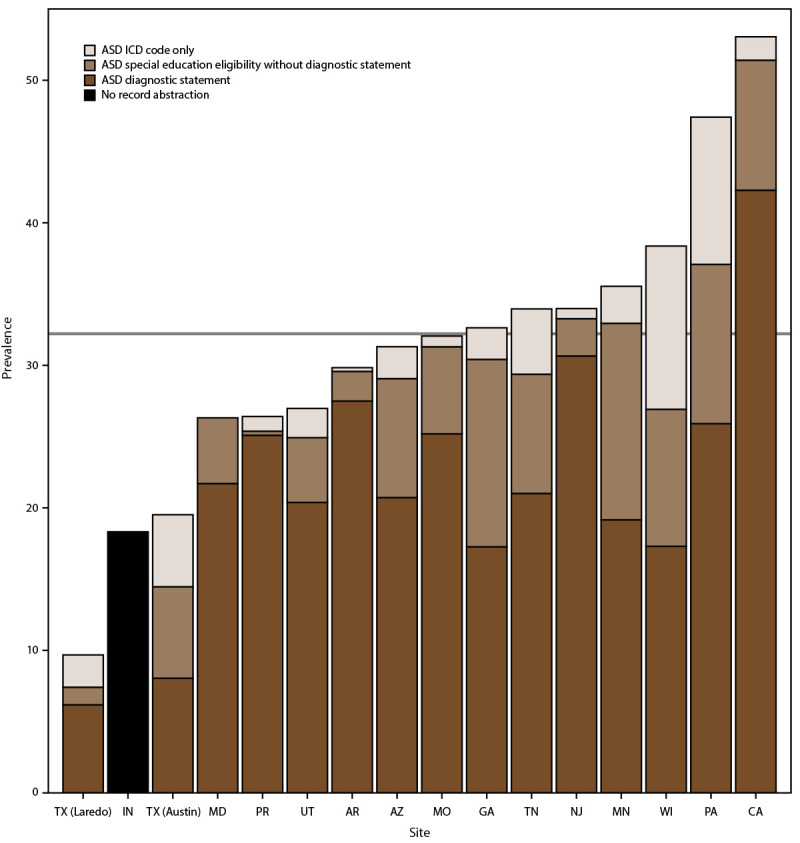
“Among children aged 8 years in 2022, ASD prevalence was 32.2 per 1,000 children (one in 31) across the 16 sites, ranging from 9.7 in Texas (Laredo) to 53.1 in California.”
- Also stated in: § ASD Prevalence Among Children Aged 8 Years · plain
“The overall observed ASD prevalence was 32.2 per 1,000 (one in 31) children aged 8 years and ranged from 9.7 in Texas (Laredo) to 53.1 in California (Table 1).”
§ Prevalence and Early Identification of Autism Spectrum Disorder Among Children Aged 4 and 8 Years — Autism and Developmental Disabilities Monitoring Network, 16 Sites, United States, 2022 > Abstract > Results
plainn = 8,613- Asserted: passes — The authors put it forward as true.
- Checkable: passes — It can be checked against evidence.
- Load-bearing: passes — The paper’s conclusions depend on it.
- Based: passes — The paper gives a reason why it holds.
- Rests on an assumption: The surveillance ASD case definition accurately identifies children with ASD in the surveillance population.
- Rests on an assumption: Children with ASD who are not captured by the available health and education records are negligible or do not substantially bias prevalence estimates.
- Also stated in: § ASD Prevalence Among Children Aged 8 Years · plain
A result the paper reports from its own data — it cites no other source for it, so there is none to check. The quote shows it is in the paper.
In the paper
“Overall, ASD prevalence was lower among non-Hispanic White (White) children (27.7) than among Asian or Pacific Islander (A/PI) (38.2), American Indian or Alaska Native (AI/AN) (37.5), non-Hispanic Black or African American (Black) (36.6), Hispanic or Latino (Hispanic) (33.0), and multiracial children (31.9).”
§ Prevalence and Early Identification of Autism Spectrum Disorder Among Children Aged 4 and 8 Years — Autism and Developmental Disabilities Monitoring Network, 16 Sites, United States, 2022 > Abstract > Results
plaincorrelationaln = 8,613- Asserted: passes — The authors put it forward as true.
- Checkable: passes — It can be checked against evidence.
- Load-bearing: unclear — It is unclear whether the paper’s conclusions depend on it.
- Based: passes — The paper gives a reason why it holds.
- Rests on an assumption: The surveillance ASD case definition accurately identifies children with ASD in the surveillance population.
A result the paper reports from its own data — it cites no other source for it, so there is none to check. The quote shows it is in the paper.
In the paper
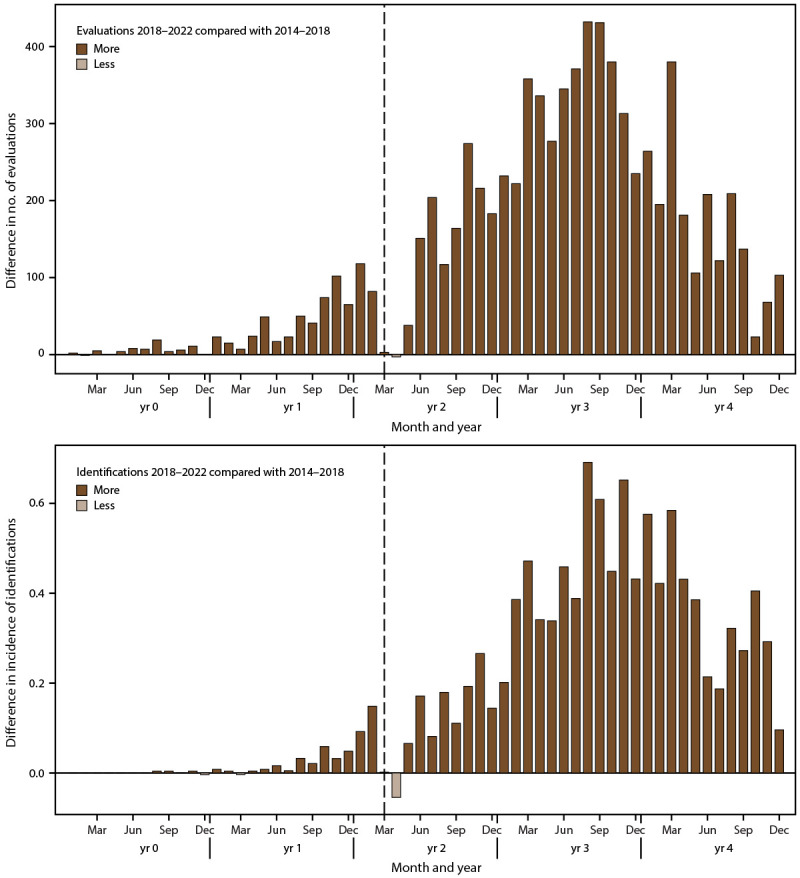
“Children with ASD who were born in 2018 had more evaluations and identification during ages 0–4 years than children with ASD who were born in 2014 during the 0–4 years age window, with an interruption in the pattern in early 2020 coinciding with onset of the COVID-19 pandemic.”
§ Prevalence and Early Identification of Autism Spectrum Disorder Among Children Aged 4 and 8 Years — Autism and Developmental Disabilities Monitoring Network, 16 Sites, United States, 2022 > Abstract > Results
plaincorrelational- Asserted: passes — The authors put it forward as true.
- Checkable: passes — It can be checked against evidence.
- Load-bearing: passes — The paper’s conclusions depend on it.
- Based: passes — The paper gives a reason why it holds.
- Rests on an assumption: The surveillance ASD case definition accurately identifies children with ASD in the surveillance population.
A result the paper reports from its own data — it cites no other source for it, so there is none to check. The quote shows it is in the paper.
In the paper
“ASD was 3.4 times as prevalent among boys (49.2) than girls (14.3).”
§ Prevalence and Early Identification of Autism Spectrum Disorder Among Children Aged 4 and 8 Years — Autism and Developmental Disabilities Monitoring Network, 16 Sites, United States, 2022 > Abstract > Results
plaincorrelationaln = 8,613- Asserted: passes — The authors put it forward as true.
- Checkable: passes — It can be checked against evidence.
- Load-bearing: unclear — It is unclear whether the paper’s conclusions depend on it.
- Based: passes — The paper gives a reason why it holds.
- Rests on an assumption: The surveillance ASD case definition accurately identifies children with ASD in the surveillance population.
A result the paper reports from its own data — it cites no other source for it, so there is none to check. The quote shows it is in the paper.
In the paper
“Among 5,292 (61.4% of 8,613) children aged 8 years with ASD with information on cognitive ability, 39.6% were classified as having an intellectual disability.”
§ Prevalence and Early Identification of Autism Spectrum Disorder Among Children Aged 4 and 8 Years — Autism and Developmental Disabilities Monitoring Network, 16 Sites, United States, 2022 > Abstract > Results
plainn = 5,292- Asserted: passes — The authors put it forward as true.
- Checkable: passes — It can be checked against evidence.
- Load-bearing: unclear — It is unclear whether the paper’s conclusions depend on it.
- Based: passes — The paper gives a reason why it holds.
- Rests on an assumption: The surveillance ASD case definition accurately identifies children with ASD in the surveillance population.
A result the paper reports from its own data — it cites no other source for it, so there is none to check. The quote shows it is in the paper.
In the paper
“Children with ASD who were born in 2018 had more evaluations and identification during ages 0–4 years than children with ASD who were born in 2014 during the 0–4 years age window, with an interruption in the pattern in early 2020 coinciding with onset of the COVID-19 pandemic.”
§ Prevalence and Early Identification of Autism Spectrum Disorder Among Children Aged 4 and 8 Years — Autism and Developmental Disabilities Monitoring Network, 16 Sites, United States, 2022 > Abstract > Results
plaincorrelational- Asserted: passes — The authors put it forward as true.
- Checkable: passes — It can be checked against evidence.
- Load-bearing: unclear — It is unclear whether the paper’s conclusions depend on it.
- Based: passes — The paper gives a reason why it holds.
- Rests on an assumption: The surveillance ASD case definition accurately identifies children with ASD in the surveillance population.
A result the paper reports from its own data — it cites no other source for it, so there is none to check. The quote shows it is in the paper.
In the paper
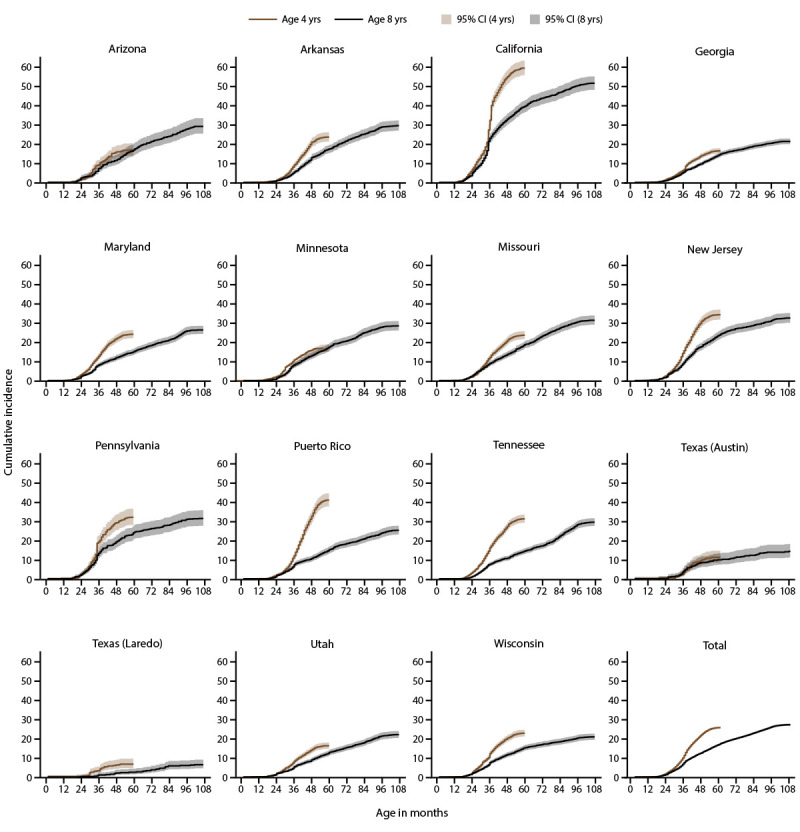
“Overall cumulative incidence of ASD diagnosis or eligibility by age 48 months was 1.7 times as high among those born in 2018 compared with those born in 2014 and ranged from 1.4 times as high in Arizona and Georgia to 3.1 times as high in Puerto Rico.”
§ Prevalence and Early Identification of Autism Spectrum Disorder Among Children Aged 4 and 8 Years — Autism and Developmental Disabilities Monitoring Network, 16 Sites, United States, 2022 > Abstract > Results
plaincorrelational- Asserted: passes — The authors put it forward as true.
- Checkable: passes — It can be checked against evidence.
- Load-bearing: passes — The paper’s conclusions depend on it.
- Based: passes — The paper gives a reason why it holds.
- Rests on an assumption: The surveillance ASD case definition accurately identifies children with ASD in the surveillance population.
A result the paper reports from its own data — it cites no other source for it, so there is none to check. The quote shows it is in the paper.
In the paper
“The median age of earliest known ASD diagnosis was 47 months and ranged from 36 months in California to 69.5 months in Texas (Laredo).”
§ Prevalence and Early Identification of Autism Spectrum Disorder Among Children Aged 4 and 8 Years — Autism and Developmental Disabilities Monitoring Network, 16 Sites, United States, 2022 > Abstract > Results
plain- Asserted: passes — The authors put it forward as true.
- Checkable: passes — It can be checked against evidence.
- Load-bearing: passes — The paper’s conclusions depend on it.
- Based: passes — The paper gives a reason why it holds.
- Rests on an assumption: The surveillance ASD case definition accurately identifies children with ASD in the surveillance population.
- It may state two separate claims as one. 25
- Probably not a substantial claim. 13
A result the paper reports from its own data — it cites no other source for it, so there is none to check. The quote shows it is in the paper.
In the paper
“Intellectual disability was present among 52.8% of Black, 50.0% of AI/AN, 43.9% of A/PI, 38.8% of Hispanic, 32.7% of White, and 31.2% of multiracial children with ASD.”
§ Prevalence and Early Identification of Autism Spectrum Disorder Among Children Aged 4 and 8 Years — Autism and Developmental Disabilities Monitoring Network, 16 Sites, United States, 2022 > Abstract > Results
plaincorrelational- Asserted: passes — The authors put it forward as true.
- Checkable: passes — It can be checked against evidence.
- Load-bearing: unclear — It is unclear whether the paper’s conclusions depend on it.
- Based: passes — The paper gives a reason why it holds.
It may state two separate claims as one.
- Rests on an assumption: The surveillance ASD case definition accurately identifies children with ASD in the surveillance population.
A result the paper reports from its own data — it cites no other source for it, so there is none to check. The quote shows it is in the paper.
In the paper
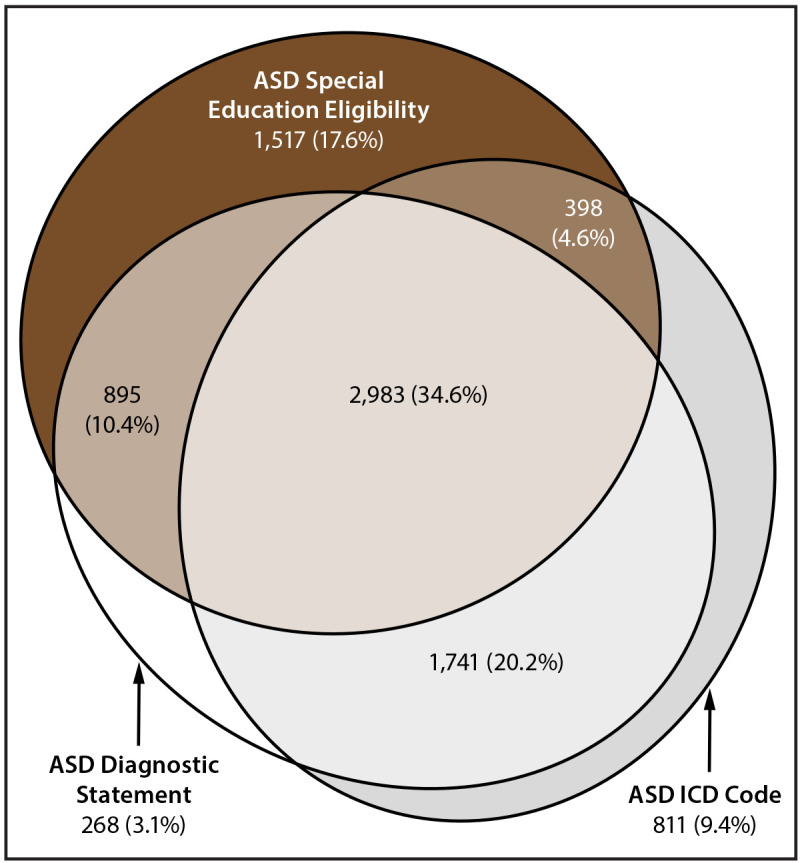
“Of these 8,613 children, 68.4% had a documented diagnostic statement of ASD, 67.3% had a documented autism special education eligibility, and 68.9% had a documented ASD ICD-9 or ICD-10 code.”
§ Prevalence and Early Identification of Autism Spectrum Disorder Among Children Aged 4 and 8 Years — Autism and Developmental Disabilities Monitoring Network, 16 Sites, United States, 2022 > Abstract > Results
plainn = 8,613- Asserted: passes — The authors put it forward as true.
- Checkable: passes — It can be checked against evidence.
- Load-bearing: passes — The paper’s conclusions depend on it.
- Based: passes — The paper gives a reason why it holds.
It may state two separate claims as one.
- Rests on an assumption: The surveillance ASD case definition accurately identifies children with ASD in the surveillance population.
A result the paper reports from its own data — it cites no other source for it, so there is none to check. The quote shows it is in the paper.
In the paper
“Variability was also observed in where children were identified (i.e., in a health or education setting), the frequency of cognitive and IQ testing, the proportion of children with IQ ≤70, and the use of ASD diagnostic tests.”
§ Prevalence and Early Identification of Autism Spectrum Disorder Among Children Aged 4 and 8 Years — Autism and Developmental Disabilities Monitoring Network, 16 Sites, United States, 2022 > Discussion
plain- Asserted: passes — The authors put it forward as true.
- Checkable: passes — It can be checked against evidence.
- Load-bearing: passes — The paper’s conclusions depend on it.
- Based: passes — The paper gives a reason why it holds.
It may state two separate claims as one.
A result the paper reports from its own data — it cites no other source for it, so there is none to check. The quote shows it is in the paper.
In the paper
“Prevalence of suspected ASD was 3.1 per 1,000 children aged 4 years, which translated to one child suspected of having ASD for every 10 children identified with ASD among children aged 4 years”
§ Prevalence and Early Identification of Autism Spectrum Disorder Among Children Aged 4 and 8 Years — Autism and Developmental Disabilities Monitoring Network, 16 Sites, United States, 2022 > Results > Early ASD Identification Among Children Aged 4 and 8 Years
plain- Asserted: passes — The authors put it forward as true.
- Checkable: passes — It can be checked against evidence.
- Load-bearing: unclear — It is unclear whether the paper’s conclusions depend on it.
- Based: passes — The paper gives a reason why it holds.
It may state two separate claims as one.
A result the paper reports from its own data — it cites no other source for it, so there is none to check. The quote shows it is in the paper.
In the paper
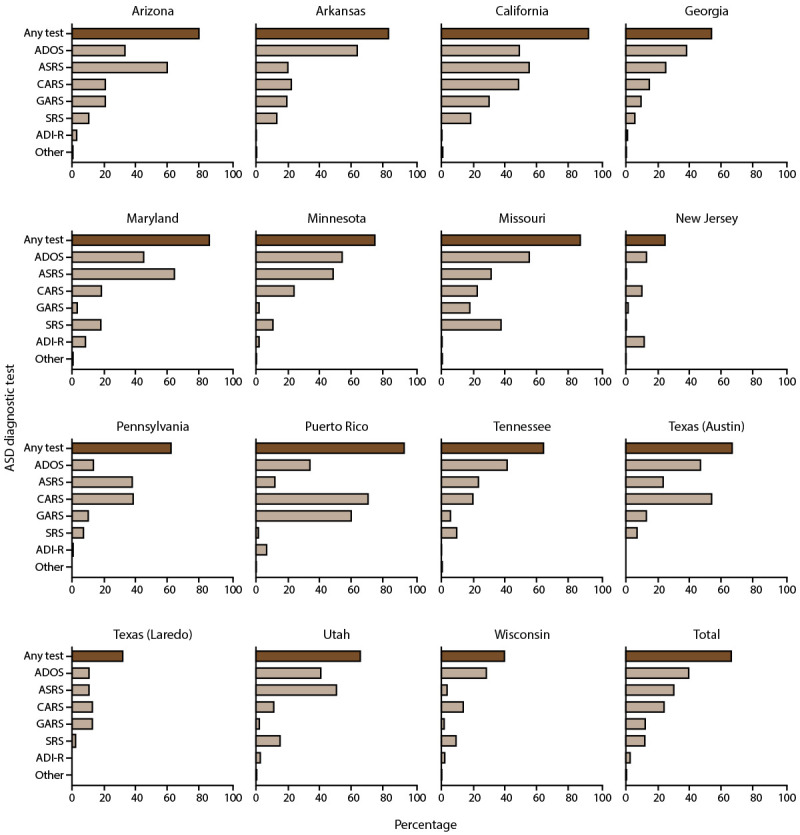
“The most common autism test documented among children aged 4 years with ASD was the CARS (38.0%), followed by the ADOS (31.7%), ASRS (21.1%), TELE-ASD-PEDS (8.7%), SRS (8.1%), GARS (6.2%), and ADI-R (3.8%).”
§ Prevalence and Early Identification of Autism Spectrum Disorder Among Children Aged 4 and 8 Years — Autism and Developmental Disabilities Monitoring Network, 16 Sites, United States, 2022 > Results > ASD Testing Among Children Aged 4 and 8 Years
plain- Asserted: passes — The authors put it forward as true.
- Checkable: passes — It can be checked against evidence.
- Load-bearing: unclear — It is unclear whether the paper’s conclusions depend on it.
- Based: passes — The paper gives a reason why it holds.
It may state two separate claims as one.
A result the paper reports from its own data — it cites no other source for it, so there is none to check. The quote shows it is in the paper.
In the paper
“The pattern of more evaluations and ASD identification among children born in 2018 resumed by June 2020 (Figure 5) and varied by site”
§ Prevalence and Early Identification of Autism Spectrum Disorder Among Children Aged 4 and 8 Years — Autism and Developmental Disabilities Monitoring Network, 16 Sites, United States, 2022 > Results > Evaluation and Identification After COVID-19 Pandemic Onset
plaincorrelational- Asserted: passes — The authors put it forward as true.
- Checkable: passes — It can be checked against evidence.
- Load-bearing: unclear — It is unclear whether the paper’s conclusions depend on it.
- Based: passes — The paper gives a reason why it holds.
It may state two separate claims as one.
A result the paper reports from its own data — it cites no other source for it, so there is none to check. The quote shows it is in the paper.
In the paper
“The Georgia site was the only site that met the threshold for statistical precision for AI/AN prevalence; the site-specific prevalence per 1,000 was 204.5 (111.5–345.0).”
§ Prevalence and Early Identification of Autism Spectrum Disorder Among Children Aged 4 and 8 Years — Autism and Developmental Disabilities Monitoring Network, 16 Sites, United States, 2022 > Results > ASD Prevalence Among Children Aged 8 Years
plain- Asserted: passes — The authors put it forward as true.
- Checkable: passes — It can be checked against evidence.
- Load-bearing: unclear — It is unclear whether the paper’s conclusions depend on it.
- Based: passes — The paper gives a reason why it holds.
It may state two separate claims as one.
A result the paper reports from its own data — it cites no other source for it, so there is none to check. The quote shows it is in the paper.
In the paper
“Significant differences for Pearson chi-square tests for proportion of Black children with IQ ≤70 among children with ASD versus A/PI, Hispanic, multiracial, or White (each comparison p<0.001); A/PI children with IQ ≤70 among children with ASD versus multiracial or White (each comparison p<0.001); Hispanic children with IQ ≤70 among children with ASD versus multiracial (p = 0.02) or White children”
§ Prevalence and Early Identification of Autism Spectrum Disorder Among Children Aged 4 and 8 Years — Autism and Developmental Disabilities Monitoring Network, 16 Sites, United States, 2022 > Results > Cognitive Ability Among Children with ASD Aged 8 Years
plaincorrelationaln = 8,613 ·- Asserted: passes — The authors put it forward as true.
- Checkable: passes — It can be checked against evidence.
- Load-bearing: unclear — It is unclear whether the paper’s conclusions depend on it.
- Based: passes — The paper gives a reason why it holds.
It may state two separate claims as one.
A result the paper reports from its own data — it cites no other source for it, so there is none to check. The quote shows it is in the paper.
In the paper
“| Total | 49.2 (48.1–50.3) | 14.3 (13.7–15.0) | 3.4 (3.3–3.6)** |”
§ Prevalence and Early Identification of Autism Spectrum Disorder Among Children Aged 4 and 8 Years — Autism and Developmental Disabilities Monitoring Network, 16 Sites, United States, 2022 > Results > ASD Prevalence Among Children Aged 8 Years
plain- Asserted: passes — The authors put it forward as true.
- Checkable: passes — It can be checked against evidence.
- Load-bearing: passes — The paper’s conclusions depend on it.
- Based: passes — The paper gives a reason why it holds.
It may state two separate claims as one.
A result the paper reports from its own data — it cites no other source for it, so there is none to check. The quote shows it is in the paper.
In the paper
“Similar percentages of girls and boys with ASD had data on cognitive ability (61.0 and 61.7%, respectively).”
§ Prevalence and Early Identification of Autism Spectrum Disorder Among Children Aged 4 and 8 Years — Autism and Developmental Disabilities Monitoring Network, 16 Sites, United States, 2022 > Results > Cognitive Ability Among Children with ASD Aged 8 Years
plain- Asserted: passes — The authors put it forward as true.
- Checkable: passes — It can be checked against evidence.
- Load-bearing: fails — The paper’s conclusions may not depend on it.
- Based: passes — The paper gives a reason why it holds.
Probably not a substantial claim. The paper’s conclusions may not depend on it.
A result the paper reports from its own data — it cites no other source for it, so there is none to check. The quote shows it is in the paper.
In the paper
“This pattern was consistent at most (13 of 16) sites, ranging from 1.4 times as high in Arizona and Georgia to 3.1 times as high in Puerto Rico.”
§ Prevalence and Early Identification of Autism Spectrum Disorder Among Children Aged 4 and 8 Years — Autism and Developmental Disabilities Monitoring Network, 16 Sites, United States, 2022 > Results > Early ASD Identification Among Children Aged 4 and 8 Years
plaincorrelational- Asserted: passes — The authors put it forward as true.
- Checkable: passes — It can be checked against evidence.
- Load-bearing: unclear — It is unclear whether the paper’s conclusions depend on it.
- Based: passes — The paper gives a reason why it holds.
It may state two separate claims as one.
A result the paper reports from its own data — it cites no other source for it, so there is none to check. The quote shows it is in the paper.
In the paper
“the top five eligibility categories were autism (77.7% of children); speech or language impairment (24.7%); health, physical, or other disability (7.9%); developmental delay (6.9%); and intellectual disability (3.6%).”
§ Prevalence and Early Identification of Autism Spectrum Disorder Among Children Aged 4 and 8 Years — Autism and Developmental Disabilities Monitoring Network, 16 Sites, United States, 2022 > Results > Presence of ASD Diagnostic Statements, Special Education Eligibility, and ICD Codes Among Children Aged 8 Years
plain- Asserted: passes — The authors put it forward as true.
- Checkable: passes — It can be checked against evidence.
- Load-bearing: unclear — It is unclear whether the paper’s conclusions depend on it.
- Based: passes — The paper gives a reason why it holds.
It may state two separate claims as one.
A result the paper reports from its own data — it cites no other source for it, so there is none to check. The quote shows it is in the paper.
In the paper
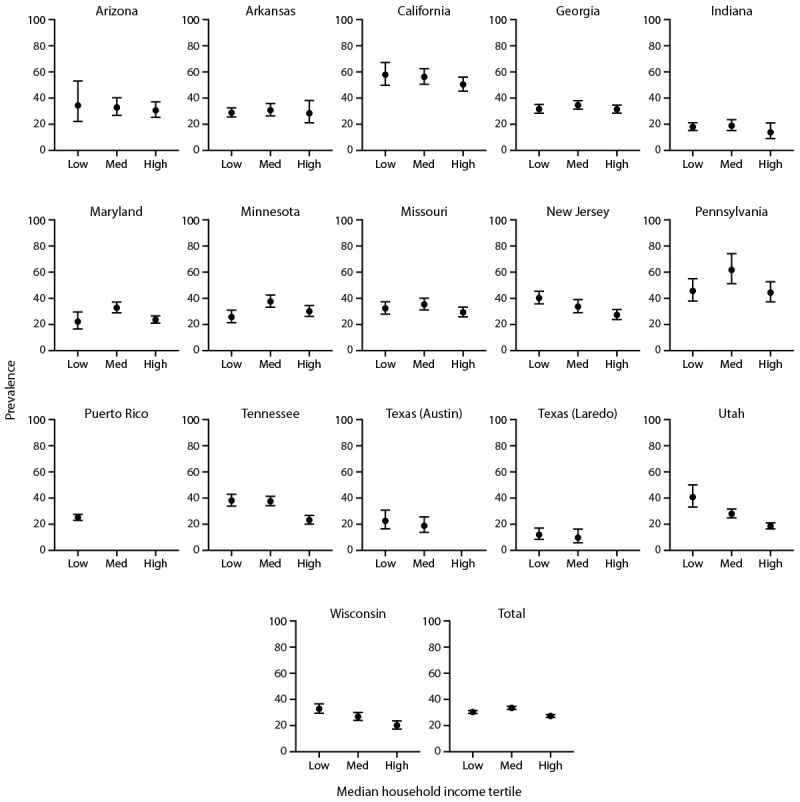
“lower neighborhood MHI was associated with higher ASD prevalence for five sites (New Jersey, Tennessee, Texas [Laredo], Utah, and Wisconsin) and overall (although the overall trend was not monotonic)”
§ Prevalence and Early Identification of Autism Spectrum Disorder Among Children Aged 4 and 8 Years — Autism and Developmental Disabilities Monitoring Network, 16 Sites, United States, 2022 > Results > ASD Prevalence Among Children Aged 8 Years
plaincorrelational- Asserted: passes — The authors put it forward as true.
- Checkable: passes — It can be checked against evidence.
- Load-bearing: unclear — It is unclear whether the paper’s conclusions depend on it.
- Based: passes — The paper gives a reason why it holds.
It may state two separate claims as one.
A result the paper reports from its own data — it cites no other source for it, so there is none to check. The quote shows it is in the paper.
In the paper
“ASD prevalence per 1,000 children aged 4 years in the 16 sites combined was 29.3, which was 0.9 times the overall prevalence among children aged 8 years in 2022”
§ Prevalence and Early Identification of Autism Spectrum Disorder Among Children Aged 4 and 8 Years — Autism and Developmental Disabilities Monitoring Network, 16 Sites, United States, 2022 > Results > Early ASD Identification Among Children Aged 4 and 8 Years
plain- Asserted: passes — The authors put it forward as true.
- Checkable: passes — It can be checked against evidence.
- Load-bearing: unclear — It is unclear whether the paper’s conclusions depend on it.
- Based: passes — The paper gives a reason why it holds.
It may state two separate claims as one.
A result the paper reports from its own data — it cites no other source for it, so there is none to check. The quote shows it is in the paper.
In the paper
“The median age of most recent cognitive test was 67 months overall and varied by site (range = 45 months in Texas [Austin] to 85 months in Puerto Rico)”
§ Prevalence and Early Identification of Autism Spectrum Disorder Among Children Aged 4 and 8 Years — Autism and Developmental Disabilities Monitoring Network, 16 Sites, United States, 2022 > Results > Cognitive Ability Among Children with ASD Aged 8 Years
plain- Asserted: passes — The authors put it forward as true.
- Checkable: passes — It can be checked against evidence.
- Load-bearing: unclear — It is unclear whether the paper’s conclusions depend on it.
- Based: passes — The paper gives a reason why it holds.
It may state two separate claims as one.
A result the paper reports from its own data — it cites no other source for it, so there is none to check. The quote shows it is in the paper.
In the paper
“higher social vulnerability was observed with higher ASD prevalence at five sites (Maryland, New Jersey, Tennessee, Utah, and Wisconsin) and overall (although overall, Maryland and Tennessee trends were not monotonic)”
§ Prevalence and Early Identification of Autism Spectrum Disorder Among Children Aged 4 and 8 Years — Autism and Developmental Disabilities Monitoring Network, 16 Sites, United States, 2022 > Results > ASD Prevalence Among Children Aged 8 Years
plaincorrelational- Asserted: passes — The authors put it forward as true.
- Checkable: passes — It can be checked against evidence.
- Load-bearing: unclear — It is unclear whether the paper’s conclusions depend on it.
- Based: passes — The paper gives a reason why it holds.
It may state two separate claims as one.
A result the paper reports from its own data — it cites no other source for it, so there is none to check. The quote shows it is in the paper.
In the paper
“AI/AN-to-White ratios were significant for Georgia (8.5 [95% CI = 4.7–15.5]) and overall (1.4 [95% CI = 1.0–1.9]).”
§ Prevalence and Early Identification of Autism Spectrum Disorder Among Children Aged 4 and 8 Years — Autism and Developmental Disabilities Monitoring Network, 16 Sites, United States, 2022 > Results > ASD Prevalence Among Children Aged 8 Years
plaincorrelational- Asserted: passes — The authors put it forward as true.
- Checkable: passes — It can be checked against evidence.
- Load-bearing: unclear — It is unclear whether the paper’s conclusions depend on it.
- Based: passes — The paper gives a reason why it holds.
It may state two separate claims as one.
A result the paper reports from its own data — it cites no other source for it, so there is none to check. The quote shows it is in the paper.
In the paper
“Among the 11 sites, prevalence was higher in 2022 than in 2020 at nine (from 14.0% to 36.7% higher) and overall (22.2% higher [absolute difference of 6.1 more children with ASD per 1,000 children aged 8 years]).”
§ Prevalence and Early Identification of Autism Spectrum Disorder Among Children Aged 4 and 8 Years — Autism and Developmental Disabilities Monitoring Network, 16 Sites, United States, 2022 > Results > ASD Prevalence Among Children Aged 8 Years
plain- Asserted: passes — The authors put it forward as true.
- Checkable: passes — It can be checked against evidence.
- Load-bearing: passes — The paper’s conclusions depend on it.
- Based: passes — The paper gives a reason why it holds.
It may state two separate claims as one.
- Rests on an assumption: The surveillance ASD case definition accurately identifies children with ASD in the surveillance population.
- Rests on an assumption: Children with ASD who are not captured by the available health and education records are negligible or do not substantially bias prevalence estimates.
The paper states this without a source or data behind it here, so there is nothing to check it against. The quote shows it is in the paper.
In the paper
“Puerto Rico was the site with second-highest prevalence among children aged 4 years, but prevalence among children aged 8 years in Puerto Rico was below the ADDM Network average.”
§ Prevalence and Early Identification of Autism Spectrum Disorder Among Children Aged 4 and 8 Years — Autism and Developmental Disabilities Monitoring Network, 16 Sites, United States, 2022 > Discussion
plain- Asserted: passes — The authors put it forward as true.
- Checkable: passes — It can be checked against evidence.
- Load-bearing: unclear — It is unclear whether the paper’s conclusions depend on it.
- Based: passes — The paper gives a reason why it holds.
It may state two separate claims as one.
None of the sources cited for this claim have been checked yet.
In the paper
“the American Academy of Pediatrics recommends that pediatric care providers screen all children for ASD at ages 18 and 24 months (2,3).”
§ Prevalence and Early Identification of Autism Spectrum Disorder Among Children Aged 4 and 8 Years — Autism and Developmental Disabilities Monitoring Network, 16 Sites, United States, 2022 > Introduction
What the sources say
- Not checked yetcites [2] Hyman, 2020, Identification, evaluation, and management of children with autism spectrum disorder., Pediatrics source
- Not checked yetcites [3] Lipkin, 2020, Promoting optimal development: identifying infants and young children with developmental disorders through developmental surveillance and screening., Pediatrics source
plain- Asserted: passes — The authors put it forward as true.
- Checkable: passes — It can be checked against evidence.
- Load-bearing: fails — The paper’s conclusions may not depend on it.
- Based: passes — The paper gives a reason why it holds.
Probably not a substantial claim. The paper’s conclusions may not depend on it.
In the paper
“Before 2016, the highest ASD prevalence was observed among White children and in children from neighborhoods with higher socioeconomic status (SES) (7).”
§ Prevalence and Early Identification of Autism Spectrum Disorder Among Children Aged 4 and 8 Years — Autism and Developmental Disabilities Monitoring Network, 16 Sites, United States, 2022 > Introduction
What the sources say
- Not checked yetcites [7] Durkin, 2017, Autism spectrum disorder among US children (2002–2010): socioeconomic, racial, and ethnic disparities., Am J Public Health source
plaincorrelational- Asserted: passes — The authors put it forward as true.
- Checkable: passes — It can be checked against evidence.
- Load-bearing: unclear — It is unclear whether the paper’s conclusions depend on it.
- Based: passes — The paper gives a reason why it holds.
It may state two separate claims as one.
None of the sources cited for this claim have been checked yet.
In the paper
“Although prevalence has been lower among children aged 4 years than aged 8 years in each reporting year, comparing cumulative incidence of identification by age 48 months has consistently indicated higher rates of ASD identification in younger cohorts (i.e., children born more recently) (9–11).”
§ Prevalence and Early Identification of Autism Spectrum Disorder Among Children Aged 4 and 8 Years — Autism and Developmental Disabilities Monitoring Network, 16 Sites, United States, 2022 > Introduction
What the sources say
- Not checked yetcites [9] Shaw, 2020, Early identification of autism spectrum disorder among children aged 4 years—Early Autism and Developmental Disabilities Monitoring Network, six sites, United States, 2016., MMWR Surveill Summ source
- Not checked yetcites [10] Shaw, 2021, Early identification of autism spectrum disorder among children aged 4 years—Autism and Developmental Disabilities Monitoring Network, 11 sites, United States, 2018., MMWR Surveill Summ source
- Not checked yetcites [11] Shaw, 2023, Early identification of autism spectrum disorder among children aged 4 years—Autism and Developmental Disabilities Monitoring Network, 11 sites, United States, 2020., MMWR Surveill Summ source
hedgedcorrelational- Asserted: passes — The authors put it forward as true.
- Checkable: passes — It can be checked against evidence.
- Load-bearing: unclear — It is unclear whether the paper’s conclusions depend on it.
- Based: passes — The paper gives a reason why it holds.
It may state two separate claims as one.
In the paper
“A report that presented data collected in 2020 found interruptions to early identification during the onset of the COVID-19 pandemic (11).”
§ Prevalence and Early Identification of Autism Spectrum Disorder Among Children Aged 4 and 8 Years — Autism and Developmental Disabilities Monitoring Network, 16 Sites, United States, 2022 > Introduction
What the sources say
- Not checked yetcites [11] Shaw, 2023, Early identification of autism spectrum disorder among children aged 4 years—Autism and Developmental Disabilities Monitoring Network, 11 sites, United States, 2020., MMWR Surveill Summ source
plaindirect- Asserted: passes — The authors put it forward as true.
- Checkable: passes — It can be checked against evidence.
- Load-bearing: fails — The paper’s conclusions may not depend on it.
- Based: passes — The paper gives a reason why it holds.
Probably not a substantial claim. The paper’s conclusions may not depend on it.
What the paper did — it cites no source for this, so there is none to check. The quote shows it is in the paper.
In the paper
“Record abstraction was completed for 15 of the 16 sites for 8,613 children aged 8 years who met the ASD case definition.”
§ Prevalence and Early Identification of Autism Spectrum Disorder Among Children Aged 4 and 8 Years — Autism and Developmental Disabilities Monitoring Network, 16 Sites, United States, 2022 > Abstract > Results
plainn = 8,613- Asserted: passes — The authors put it forward as true.
- Checkable: passes — It can be checked against evidence.
- Load-bearing: fails — The paper’s conclusions may not depend on it.
- Based: passes — The paper gives a reason why it holds.
Probably not a substantial claim. The paper’s conclusions may not depend on it.
In the paper
“Early identification of ASD can help children receive services and supports they might need for their development and to improve long-term outcomes (4).”
§ Prevalence and Early Identification of Autism Spectrum Disorder Among Children Aged 4 and 8 Years — Autism and Developmental Disabilities Monitoring Network, 16 Sites, United States, 2022 > Introduction
What the sources say
- Not checked yetcites [4] Zwaigenbaum, 2015, Early intervention for children with autism spectrum disorder under 3 years of age: recommendations for practice and research., Pediatrics source
hedgedconditional- Asserted: passes — The authors put it forward as true.
- Checkable: fails — It may be too vague to check against evidence.
- Load-bearing: fails — The paper’s conclusions may not depend on it.
- Based: passes — The paper gives a reason why it holds.
Probably not a substantial claim. It may be too vague to check against evidence. The paper’s conclusions may not depend on it.
What the paper did — it cites no source for this, so there is none to check. The quote shows it is in the paper.
In the paper
“A Bayesian hierarchical modelling approach and random-effects restricted maximum likelihood method were also used to calculate overall prevalence and measures of uncertainty (95% Bayesian credible intervals and 95% CIs, respectively) among children aged 8 years to better account for the wide range in prevalence across sites; full details are available (Supplementary Methods 2, https://stacks.cdc.”
§ Prevalence and Early Identification of Autism Spectrum Disorder Among Children Aged 4 and 8 Years — Autism and Developmental Disabilities Monitoring Network, 16 Sites, United States, 2022 > Methods > Analytic Methods
plain- Asserted: passes — The authors put it forward as true.
- Checkable: passes — It can be checked against evidence.
- Load-bearing: passes — The paper’s conclusions depend on it.
- Based: passes — The paper gives a reason why it holds.
Probably not a substantial claim.
The paper states this without a source or data behind it here, so there is nothing to check it against. The quote shows it is in the paper.
In the paper
“and has a local initiative (the Get SET Early model).”
§ Prevalence and Early Identification of Autism Spectrum Disorder Among Children Aged 4 and 8 Years — Autism and Developmental Disabilities Monitoring Network, 16 Sites, United States, 2022 > Discussion
plain- Asserted: passes — The authors put it forward as true.
- Checkable: passes — It can be checked against evidence.
- Load-bearing: passes — The paper’s conclusions depend on it.
- Based: passes — The paper gives a reason why it holds.
Probably not a substantial claim.
What the paper did — it cites no source for this, so there is none to check. The quote shows it is in the paper.
In the paper
“Thirteen sites had data agreements in place with education sources covering 100% of their study areas; three sites had agreements with education data sources covering <100% (Georgia [97.3%], Missouri [68.0%], and Texas [Laredo] [99.7%]).”
§ Prevalence and Early Identification of Autism Spectrum Disorder Among Children Aged 4 and 8 Years — Autism and Developmental Disabilities Monitoring Network, 16 Sites, United States, 2022 > Methods > Case Ascertainment and Surveillance Case Definition
plain- Asserted: passes — The authors put it forward as true.
- Checkable: passes — It can be checked against evidence.
- Load-bearing: fails — The paper’s conclusions may not depend on it.
- Based: passes — The paper gives a reason why it holds.
Probably not a substantial claim. The paper’s conclusions may not depend on it. It may state two separate claims as one.
What the paper did — it cites no source for this, so there is none to check. The quote shows it is in the paper.
In the paper
“Because Indiana did not have data available from record abstraction, Indiana is included in analyses of prevalence (by demographic characteristics, MHI, and SVI) but excluded from other analyses that required data from record abstraction (e.g., co-occurring intellectual disability or presence of evaluation or diagnosis or age at evaluation or diagnosis).”
§ Prevalence and Early Identification of Autism Spectrum Disorder Among Children Aged 4 and 8 Years — Autism and Developmental Disabilities Monitoring Network, 16 Sites, United States, 2022 > Methods > Analytic Methods
plain- Asserted: passes — The authors put it forward as true.
- Checkable: passes — It can be checked against evidence.
- Load-bearing: unclear — It is unclear whether the paper’s conclusions depend on it.
- Based: passes — The paper gives a reason why it holds.
It may state two separate claims as one.
In the paper
“In addition, California has regional centers throughout the state that provide evaluations and service coordination for persons with disabilities and their families (https://www.dds.ca.gov).”
§ Prevalence and Early Identification of Autism Spectrum Disorder Among Children Aged 4 and 8 Years — Autism and Developmental Disabilities Monitoring Network, 16 Sites, United States, 2022 > Discussion
What the sources say
- Not checked yetcites https://www.dds.ca.gov
plain- Asserted: passes — The authors put it forward as true.
- Checkable: passes — It can be checked against evidence.
- Load-bearing: fails — The paper’s conclusions may not depend on it.
- Based: passes — The paper gives a reason why it holds.
Probably not a substantial claim. The paper’s conclusions may not depend on it.
A conclusion the paper draws from its own results — it cites no other source for it, so there is none to check. The quote shows it is in the paper.
In the paper
“Variability in identification practices could affect receipt of services and suggests opportunities to implement successful identification strategies to ensure children in all communities receive the diagnostic and care services they need.”
§ Prevalence and Early Identification of Autism Spectrum Disorder Among Children Aged 4 and 8 Years — Autism and Developmental Disabilities Monitoring Network, 16 Sites, United States, 2022 > Discussion
hedgedconditional- Asserted: passes — The authors put it forward as true.
- Checkable: fails — It may be too vague to check against evidence.
- Load-bearing: passes — The paper’s conclusions depend on it.
- Based: passes — The paper gives a reason why it holds.
Probably not a substantial claim. It may be too vague to check against evidence. It may state two separate claims as one.
What the paper did — it cites no source for this, so there is none to check. The quote shows it is in the paper.
In the paper
“Prevalence estimates with a relative standard error ≥30% were suppressed because of limited statistical precision.”
§ Prevalence and Early Identification of Autism Spectrum Disorder Among Children Aged 4 and 8 Years — Autism and Developmental Disabilities Monitoring Network, 16 Sites, United States, 2022 > Methods > Analytic Methods
plain- Asserted: passes — The authors put it forward as true.
- Checkable: passes — It can be checked against evidence.
- Load-bearing: fails — The paper’s conclusions may not depend on it.
- Based: passes — The paper gives a reason why it holds.
Probably not a substantial claim. The paper’s conclusions may not depend on it.
What the paper did — it cites no source for this, so there is none to check. The quote shows it is in the paper.
In the paper
“All sites participating in 2022 had access to health and education records (Table 1).”
§ Prevalence and Early Identification of Autism Spectrum Disorder Among Children Aged 4 and 8 Years — Autism and Developmental Disabilities Monitoring Network, 16 Sites, United States, 2022 > Methods > Case Ascertainment and Surveillance Case Definition
plain- Asserted: passes — The authors put it forward as true.
- Checkable: passes — It can be checked against evidence.
- Load-bearing: fails — The paper’s conclusions may not depend on it.
- Based: passes — The paper gives a reason why it holds.
Probably not a substantial claim. The paper’s conclusions may not depend on it.
In the paper
“As part of the initiative, hundreds of local pediatricians have been trained to screen and refer children for assessment as early as possible, which could result in higher identification of ASD, especially at early ages (17).”
§ Prevalence and Early Identification of Autism Spectrum Disorder Among Children Aged 4 and 8 Years — Autism and Developmental Disabilities Monitoring Network, 16 Sites, United States, 2022 > Discussion
What the sources say
- Not checked yetcites [17] Pierce, 2021, Get SET Early to identify and treatment refer autism spectrum disorder at 1 year and discover factors that influence early diagnosis., J Pediatr source
hedgedconditional- Asserted: passes — The authors put it forward as true.
- Checkable: passes — It can be checked against evidence.
- Load-bearing: passes — The paper’s conclusions depend on it.
- Based: passes — The paper gives a reason why it holds.
It may state two separate claims as one.
A conclusion the paper draws from its own results — it cites no other source for it, so there is none to check. The quote shows it is in the paper.
In the paper
“Another reason for differences in prevalence could be whether children have insurance coverage or meet eligibility criteria for access to early intervention services.”
§ Prevalence and Early Identification of Autism Spectrum Disorder Among Children Aged 4 and 8 Years — Autism and Developmental Disabilities Monitoring Network, 16 Sites, United States, 2022 > Discussion
hedgedconditional- Asserted: passes — The authors put it forward as true.
- Checkable: passes — It can be checked against evidence.
- Load-bearing: fails — The paper’s conclusions may not depend on it.
- Based: passes — The paper gives a reason why it holds.
Probably not a substantial claim. The paper’s conclusions may not depend on it.
In the paper
“Pennsylvania, the site with second highest prevalence among children aged 8 years, has state Medicaid policy that includes children with physical, developmental, mental health, or intellectual disabilities regardless of parents’ income (18).”
§ Prevalence and Early Identification of Autism Spectrum Disorder Among Children Aged 4 and 8 Years — Autism and Developmental Disabilities Monitoring Network, 16 Sites, United States, 2022 > Discussion
What the sources say
- Not checked yetcites [18] Commonwealth of Pennsylvania, Department of Human Services. Medicaid for children with special needs. Harrisburg, PA: Commonwealth of Pennsylvania, Department of Human Services; 2024. https://www.pa.gov/agencies/dhs/resources/medicaid/medicaid-children-special-needs-ph95.html
plain- Asserted: passes — The authors put it forward as true.
- Checkable: passes — It can be checked against evidence.
- Load-bearing: passes — The paper’s conclusions depend on it.
- Based: passes — The paper gives a reason why it holds.
It may state two separate claims as one.
The paper relies on this without support.
The surveillance ASD case definition accurately identifies children with ASD in the surveillance population.
“children aged 8 years (born in 2014) or aged 4 years (born in 2018) met the surveillance ASD case definition if they lived in the surveillance area at any time in 2022 and they received 1) an ASD diagnostic statement in a comprehensive developmental evaluation, 2) autism special education eligibility, or 3) an ASD ICD-9 code in the 299 range or ICD-10 code of F84.0, F84.3, F84.5, F84.8, or F84.9.”
The paper relies on this without support.
Children with ASD who are not captured by the available health and education records are negligible or do not substantially bias prevalence estimates.
“All sites participating in 2022 had access to health and education records (Table 1).”
The authors state this as an assumption.
The methodology assumes that all Puerto Rico residents are Hispanic.
“This methodology assumes that all Puerto Rico residents are Hispanic.”
The paper relies on this without support.
Research has not demonstrated that living in certain communities puts children at greater risk for developing ASD.
“Research has not demonstrated that living in certain communities puts children at greater risk for developing ASD.”
Self-check
Percentages, sums and reported differences re-computed from the paper’s own numbers.
Each contradiction between two passages listed here was confirmed by an independent check.
Rated minor: it would not touch a result — a value no result rests on, a p-value that stays on the same side of the significance level, or a conflict that is clerical, resolved elsewhere in the paper, or outside its own findings.
In the paper
§ Prevalence and Early Identification of Autism Spectrum Disorder Among Children Aged 4 and 8 Years — Autism and Developmental Disabilities Monitoring Network, 16 Sites, United States, 2022 > Discussion
“In 2022, across the 13 sites with higher cumulative incidence of identification by age 48 months among children aged 4 years (born in 2018) compared with children aged 8 years (born in 2014), identification was 40%–300% higher in the younger group.”
§ Prevalence and Early Identification of Autism Spectrum Disorder Among Children Aged 4 and 8 Years — Autism and Developmental Disabilities Monitoring Network, 16 Sites, United States, 2022 > Results > Early ASD Identification Among Children Aged 4 and 8 Years
“This pattern was consistent at most (13 of 16) sites, ranging from 1.4 times as high in Arizona and Georgia to 3.1 times as high in Puerto Rico.”
Rated minor: it would not touch a result — a value no result rests on, a p-value that stays on the same side of the significance level, or a conflict that is clerical, resolved elsewhere in the paper, or outside its own findings.
In the paper
§ Prevalence and Early Identification of Autism Spectrum Disorder Among Children Aged 4 and 8 Years — Autism and Developmental Disabilities Monitoring Network, 16 Sites, United States, 2022 > Abstract > Results
“All three elements of the ASD case definition were present for 34.6% of children aged 8 years with ASD.”
§ Prevalence and Early Identification of Autism Spectrum Disorder Among Children Aged 4 and 8 Years — Autism and Developmental Disabilities Monitoring Network, 16 Sites, United States, 2022 > Results > Presence of ASD Diagnostic Statements, Special Education Eligibility, and ICD Codes Among Children Aged 8 Years
“A majority (69.9%) of children with ASD had at least two of the three types of ASD identification documented in their records and 34.7% had all three types (Figure 3).”
Citations
Cites
Diagnostic and Statistical Manual of Mental Disorders
American Psychiatric Association (2022) · doi:10.1176/appi.books.9780890425787 · Cited by 23,476
Maenner, M. J., Warren, Z., Williams, A. R., Amoakohene, E., Bakian, A. V., Bilder, D. A., Durkin, M. S., Fitzgerald, R. T., Furnier, S. M., Hughes, M. M., et al. (2023) · MMWR. Surveillance Summaries · doi:10.15585/mmwr.ss7202a1 · Cited by 2,706
Self-citationMaenner, M. J., Shaw, K. A., Bakian, A. V., Bilder, D. A., Durkin, M. S., Esler, A., Furnier, S. M., Hallas, L., Hall-Lande, J., Hudson, A., et al. (2021) · MMWR. Surveillance Summaries · doi:10.15585/mmwr.ss7011a1 · Cited by 1,818 · cited 4×
“For example, California has had the highest prevalence among children aged 4 years and 8 years since joining the ADDM Network in 2018 ( 6 , 10,11,13 ) and has a local initiative (the Get SET Early model).”
InfluentialSelf-citationIdentification, Evaluation, and Management of Children With Autism Spectrum Disorder
Hyman, S. L., Levy, S. E., Myers, S. M., COUNCIL ON CHILDREN WITH DISABILITIES, S. O. D. A. B. P., Kuo, D. Z., Apkon, S., Davidson, L. F., Ellerbeck, K. A., Foster, J. E. A., Noritz, G. H., et al. (2020) · Pediatrics · doi:10.1542/peds.2019-3447 · Cited by 1,798
Zwaigenbaum, L., Bauman, M. L., Choueiri, R., Kasari, C., Carter, A., Granpeesheh, D., Mailloux, Z., Smith Roley, S., Wagner, S., Fein, D., et al. (2015) · Pediatrics · doi:10.1542/peds.2014-3667e · Cited by 856
Self-citationLipkin, P. H., Macias, M. M., COUNCIL ON CHILDREN WITH DISABILITIES, S. O. D. A. B. P., Norwood, K. W., Brei, T. J., Davidson, L. F., Davis, B. E., Ellerbeck, K. A., Houtrow, A. J., Hyman, S. L., et al. (2020) · Pediatrics · doi:10.1542/peds.2019-3449 · Cited by 676
Christensen, D., Bilder, D. A., Zahorodny, W. M., Pettygrove, S. D., Durkin, M. S., Fitzgerald, R. T., Rice, C. E., Kurzius‐Spencer, M., Baio, J., & Yeargin‐Allsopp, M. (2015) · Journal of Developmental & Behavioral Pediatrics · doi:10.1097/dbp.0000000000000235 · Cited by 411
Self-citationDurkin, M. S., Maenner, M. J., Baio, J., Christensen, D., Daniels, J., Fitzgerald, R., Imm, P., Lee, L.-C., Schieve, L. A., Van Naarden Braun, K., et al. (2017) · American Journal of Public Health · doi:10.2105/ajph.2017.304032 · Cited by 347
Self-citationPierce, K., Gazestani, V. H., Bacon, E., Barnes, C. C., Cha, D., Nalabolu, S., Lopez, L., Moore, A., Pence-Stophaeros, S., & Courchesne, E. (2019) · JAMA Pediatrics · doi:10.1001/jamapediatrics.2019.0624 · Cited by 333
Self-citationShaw, K. A., Maenner, M. J., Baio, J., EdS1, Washington, A., Christensen, D. L., Wiggins, L. D., Pettygrove, S., Andrews, J. G., White, T., et al. (2020) · MMWR. Surveillance Summaries · doi:10.15585/mmwr.ss6903a1 · Cited by 286
Self-citation
Research works printed but not linked: 1
- Institute of Medicine (US) Committee on Understanding Premature Birth and Assuring Healthy Outcomes. Behrman RE, Butler AS, eds. Sociodemographic and community factors contributing to preterm birth [Chapter 4]. In: Preterm birth: causes, consequences, and prevention. Washington, DC: National Academies Press (US); 2007:124–47.
Cited by
Sorted by citations
Items 201–300 of 862
Long, E. E., & Gaffrey, M. S. (2026) · Journal of Developmental & Behavioral Pediatrics · doi:10.1097/dbp.0000000000001455 · Cited by 1
Progress in exercise interventions for autism spectrum disorder: exploring underlying mechanisms
Wang, C., Zhang, Y., Zhu, J., & Lin, Z. (2026) · Frontiers in Psychiatry · doi:10.3389/fpsyt.2025.1649005 · Cited by 4
Recent advances in the neurogenomics of autism spectrum disorder
Gogate, A., & Chahrour, M. H. (2026) · Current Opinion in Genetics & Development · doi:10.1016/j.gde.2025.102431 · Cited by 1
Fine and ultrafine particulate matter components and autism spectrum disorder (ASD)
Goodrich, A. J., Bennett, D. G., Kleeman, M. J., Tancredi, D. J., Ludeña, Y., Hertz‐Picciotto, I., & Schmidt, R. J. (2026) · Environment International · doi:10.1016/j.envint.2026.110068 · Cited by 2
Song, W., Bromberg, J., & Rast, J. E. (2025) · American Journal on Intellectual and Developmental Disabilities · doi:10.1080/19447515.2025.2578150 · Cited by 1
Towards treatments targeting the gut to improve behavioural outcomes in autism spectrum disorder
Munira, M. S., Stevens, J. E., Shahin, W., Wang, K., Franks, A. E., Perez, A. R. J., Scott, J. W., & Hill‐Yardin, E. L. (2026) · Journal of Neural Transmission · doi:10.1007/s00702-025-03061-4 · Cited by 1
Jiang, T., Wilson, M., Whitehouse, A. J. O., Sainsbury, W., & Waddington, H. (2026) · Journal of Autism and Developmental Disorders · doi:10.1007/s10803-025-07207-x · Cited by 1
Understanding Autism through the Eyes of Nurses: a Cross‐Sectional Study
Albloushi, M., Alghamdi, R. S., & Alqahtani, M. A. M. (2026) · Brain and Behavior · doi:10.1002/brb3.71217 · Cited by 1
“Globally, ASD affects approximately 1 in every 100 children (Zeidan et al. 2022 ), with recent US estimates reporting 1 in every 33 children in the United States (Shaw 2025 ).”
Ghumman, U., DiSalvo, M., Iorini, M., Srinivasan, A., Saeed, A., O’Connor, M., Ghaziuddin, M., Uchida, M., Ceranoglu, A. T., Wozniak, J. R., et al. (2026) · Journal of Autism and Developmental Disorders · doi:10.1007/s10803-026-07218-2 · Cited by 1
A Case Report: Effects of a ketogenic diet on PTEN mutation-associated autism spectrum disorder
Wang, Y., Guo, Y., Zhu, M., Zhang, L., Wang, L., Liu, Z., Zhao, Y., Yan, Z., Gao, J., & Cao, A. (2026) · Frontiers in Nutrition · doi:10.3389/fnut.2026.1721018 · Cited by 1
Vo, T. V., Nguyen, P. M., Nguyen, D. N., Nguyen, V., Thai, D. M., Ly, H. H. V., & Luu, T. N. N. (2026) · Journal of Autism and Developmental Disorders · doi:10.1007/s10803-026-07227-1 · Cited by 1
Lin, C.-Y., Kang, L.-J., Liao, H., Cheong, P., Yen, C. F., Liou, T., Wu, Y., & Yang, P.-Y. (2026) · Research in Developmental Disabilities · doi:10.1016/j.ridd.2026.105232 · Cited by 1
Zhang, T., Cao, Z., Li, W., & Lv, Z. (2026) · Pediatric Investigation · doi:10.1002/ped4.70038 · Cited by 2
Chericoni, N., Conti, E., Costanzo, V., Ieri, F., Colombino, I., Guainai, G., Riva, B., Apicella, F., Guzzetta, A., Calderoni, S., et al. (2026) · Journal of Clinical Medicine · doi:10.3390/jcm15031044 · Cited by 1
“Epidemiological studies consistently report a higher prevalence of ASD in males than in females, with male-to-female ratios typically ranging between 3:1 and 4:1 across countries and age groups [12,25].”
InfluentialSurgery through the spectrum: Behavioral and analgesic outcomes in children with autism
Davis, R. T., Malinova, D. N., Rosen, R. D., Galvin, R. M., Patterson, K. N., Ridelman, E., & Shanti, C. M. (2026) · Journal of Pediatric Surgery · doi:10.1016/j.jpedsurg.2026.162969 · Cited by 1
Acetaminophen, autism, and the evidence gap: a call for scientific rigor
Wang, Z., Qiu, Z., Zhen, X., Li, N., Xie, W., Jiao, J., & Wang, F. (2025) · Element · doi:10.20517/element.2025.02 · Cited by 1
Liu, K., Sun, B., Wang, B. K., Chen, J., Westover, M. B., Tian, F., Sun, H., & Kong, X. (2026) · Journal of Sleep Research · doi:10.1111/jsr.70309 · Cited by 2
“According to recent estimates, approximately 1 in 31 children in the United States is diagnosed with ASD (Shaw et al. 2025), with incidence rates continuing to rise.”
Sex-specific metrics for success: Gaps in social word use are bigger for autistic girls than boys
Cola, M., Schillinger, S., Lyons, M. A., Lee, A., Faulk, C. J., Covello, M., Howard, N., Franke, H., Mulqueen, A., Fulop, L. J., et al. (2026) · Autism · doi:10.1177/13623613261417535 · Cited by 1
“Girls are less likely to be diagnosed with autism than boys (Shaw et al., 2025), even when they have comparable autistic characteristics (Dworzynski et al., 2012).”
The relationship between age of autism diagnosis and life satisfaction in adulthood
Cremer, S., Antezana, L., Conner, C. M., Eack, S. M., Mazefsky, C. A., & Northrup, J. B. (2026) · Autism · doi:10.1177/13623613261416672 · Cited by 1
“%) than published rates in the autistic population (Shaw et al., 2025).”
InfluentialDaud, A. Z. C., Nayan, N. A. M., Toran, H. B., Ilias, K., Nor, N. K., Isa, K. A. M., Yang, W. W., Mohd, T. A. M. T., Baharom, N., & Kamaralzaman, S. (2026) · Autism Research · doi:10.1002/aur.70196 · Cited by 1
Guha, S., Elisha, D. H., Eshraghi, R. S., Mittal, R., Deth, R. C., & Eshraghi, A. A. (2026) · Journal of Molecular Neuroscience · doi:10.1007/s12031-026-02479-z · Cited by 1
“1) (Shaw et al. 2025).”
Badgett, N. M., Taylor-Swanson, L. J., Quist, S., Price, J., & Villanueva, J. (2026) · Frontiers in Reproductive Health · doi:10.3389/frph.2026.1762773 · Cited by 1
“Autism is a neurodevelopmental disorder defined by core characteristics related to deficits in social behavior and communication, occurring in 1 in 31 children in the United States according to the most recent prevalence data (5).”
Sotelo-Orozco, J., Taft, D. H., Al-Oboudi, J., Baikie, B. C., Lake, C., Miller, M. R., Mills, D. A., Tancredi, D. J., Schmidt, R. J., Hertz‐Picciotto, I., et al. (2026) · Autism Research · doi:10.1002/aur.70207 · Cited by 2
“Autism spectrum disorder (ASD) is a neurodevelopmental condition that is currently estimated to affect 1 in 31 children in the US (Shaw et al. 2025).”
Novel therapeutics in autism spectrum disorder
Kevelson, S. D., Elmaghraby, R., Patel, F., Brown, H. R., Gorenstein, M., Bain, J., Grinspan, Z. M., Pedapati, E. V., Veenstra-VanderWeele, J. M., & Vandana, P. (2026) · Neurotherapeutics · doi:10.1016/j.neurot.2026.e00857 · Cited by 5
Dana, H., Koçum, F., YILMAZ, O. N., Avcı, V., Demi̇rci̇, E., & Şener, E. F. (2026) · Journal of Psychiatric Research · doi:10.1016/j.jpsychires.2026.02.051 · Cited by 1
Associations between Prenatal Perceived Stress and Child Autism-Related Traits in the ECHO Cohort
Grosvenor, L. P., McGrath, M., Douglas, J., Ames, J., Amutah‐Onukagha, N., Avalos, L. A., Baker, B. H., Brennan, P. A., Christalin, N., Ferrara, A. M., et al. (2026) · The Journal of Pediatrics · doi:10.1016/j.jpeds.2026.115054 · Cited by 1
Self-citationStigmatization related experience among mothers of children with autism
Butiu, O.-R., Nechifor, D.-A., Popescu, T., Molnar, R.-I., & Mihai, A. (2026) · Frontiers in Public Health · doi:10.3389/fpubh.2026.1746420 · Cited by 1
Expanding Understanding of Autism Spectrum Disorder in Girls and Women: A New Paradigm
Bitensky, D., Clauss‐Ehlers, C. S., & Veksler, K. M. (2026) · Behavioral Sciences · doi:10.3390/bs16030396 · Cited by 1
“The Autism and Developmental Disabilities Monitoring Network is an organization that works to assess the prevalence rates of ASD and related characteristics among 4-to 8-year-olds (Shaw et al., 2025).”
Evaluating tact instruction in two languages for bilingual children with autism spectrum disorder
Zhao, X., Cengher, M., Li, T., Cortez, M. D., & Miguel, C. F. (2026) · Journal of Applied Behavior Analysis · doi:10.1002/jaba.70058 · Cited by 1
Hybrid ensemble learning for Autism Spectrum Disorder screening using eye-tracking scanpath
Alagha, N., Elkhodiry, A. A., Copiaco, A., Himeur, Y., Mansoor, W., Ritz, C. H., Eapen, V., Albanna, A., & Beheshti, A. (2026) · Array · doi:10.1016/j.array.2026.100753 · Cited by 1
Ahmadi, A., Baudry, J. Y., Tenhundfeld, N. L., Goff, K., & Adamek, D. (2026) · PLoS ONE · doi:10.1371/journal.pone.0342700 · Cited by 1
“The prevalence of ASD has significantly increased, with the CDC reporting that one in 36 children in the U.S. is diagnosed with ASD, a trend mirrored in Alabama with a 22% rise in prevalence since 2021 [20,21].”
Kapsi, S. (2026) · Frontiers in Computer Science · doi:10.3389/fcomp.2026.1678653 · Cited by 1
“Prevalence of ASD in children in the USA has increased (1:31) since 2022 (Shaw, 2025).”
Carrasco, V. I. U., Asantewaa, S. M., Zuckerman, K. E., & Lindly, O. J. (2026) · Frontiers in Psychiatry · doi:10.3389/fpsyt.2026.1767829 · Cited by 1
Griffin, B., Gosrani, R., & Eccles, J. (2026) · Evolutionary Applications · doi:10.1111/eva.70221 · Cited by 1
Mohamed, M. M., ELMeneza, S., & Hammouda, S. M. (2026) · Dialogues in Health · doi:10.1016/j.dialog.2026.100288 · Cited by 1
“In the USA, it was observed that the prevalence in 8-Year-Olds was 32.2 per 1000 children, which is equivalent to approximately 1 in 31 children [4].”
InfluentialREM Sleep Abnormalities in Children With Autism Spectrum Disorder
Ma, J., Qin, J., Jiang, H., Che, Y.-P., Li, H. H., Ma, D., & Zhu, J. (2026) · Autism Research · doi:10.1002/aur.70222 · Cited by 1
Carrasco, V. I. U., Zuckerman, K. E., Charlesworth, C. J., Watson, K., McConnell, K. J., & Lindly, O. J. (2026) · Journal of Autism and Developmental Disorders · doi:10.1007/s10803-026-07251-1 · Cited by 1
Pabón, D. G., Hatfield-King, J., Patel, S., Horn, B., Burkett, J. P., & Andari, E. (2026) · Molecular Autism · doi:10.1186/s13229-026-00712-5 · Cited by 1
“…in the past decade with recent estimates from the Centers for Disease Control and Prevention of 1 in 31 children in the United States having autism [1], research on treatment has been hindered, in part, by a lack of knowledge in the brain and molecular underpinnings of the complexity and…”
Bouhadana, G. C., Delisle, É., Borsuk, D. E., & Bortoluzzi, P. A. (2026) · Journal of Craniofacial Surgery · doi:10.1097/scs.0000000000012659 · Cited by 1
Mazouffre, C., Laronze, F., Amestoy, A., & N’Kaoua, B. (2026) · Autism · doi:10.1177/13623613261427571 · Cited by 2
“Furthermore, a study showed that in 2022, the over-all prevalence of ASD among 8-year-old children in the United States was 1 in 31 (Shaw et al., 2025).”
Autism spectrum disorder in China: Clinical practices, challenges, and future
Yang, N., Wang, J., Zhu, H., Pan, Q., You, M., Wang, Y., Wu, L., Ma, W., Wang, Y., & Zhou, H. (2026) · Med · doi:10.1016/j.medj.2026.101074 · Cited by 1
Hotez, E., Song, L., & Yang, Y. (2026) · Current Epidemiology Reports · doi:10.1007/s40471-026-00389-7 · Cited by 1
“One in 31 individuals in the U.S. is autistic [1].”
Martelli, M. E., Colella, S., Meloni, R., Gigliotti, F., Rosato, A., Panella, M., & Sogos, C. (2026) · NeuroSci · doi:10.3390/neurosci7020041 · Cited by 1
Elaziz, M. A., Mahmoud, N., Ewees, A. A., Khattap, M. G., Dahou, A., Alghamdi, S. M., Nafisah, I., Fares, I. A., & Al‐Betar, M. A. (2026) · PLoS ONE · doi:10.1371/journal.pone.0339921 · Cited by 1
“According to the World Health Organization (WHO), autism was estimated to affect about 1 in 127 people worldwide in 2021, while the U.S. Centers for Disease Control and Prevention (CDC) reported that approximately 1 in 31 children aged 8 years were identified with ASD in 2022 [2,3].”
RetractedAl-wakeel, N. S., Selim, M. E., Abd‐Elhakim, Y. M., & Hefny, M. M. (2026) · Bratislavské lekárske listy/Bratislava medical journal · doi:10.1007/s44411-026-00579-1 · Cited by 1
“Males are substantially more likely than females to be diagnosed with ASD, with prevalence ratios ranging from approximately 3:1 to 4:1 across multiple large ‐ scale studies [3, 4].”
Addressing the Major Challenges Facing the Autism Community
Dawson, G. (2026) · Archives of Pediatrics and Adolescent Medicine · doi:10.1001/jamapediatrics.2026.0403 · Cited by 1
The prevalence of autism in cerebellar malformations: a systematic review and meta-analysis
Wells, D. A., Jaber, D., Dey, S., VanZant, J. S., Carson, R. A., Klem, M. L., Sharghi, S., & Seese, R. R. (2026) · Journal of Neurodevelopmental Disorders · doi:10.1186/s11689-026-09691-3 · Cited by 1
“Autism spectrum disorder (ASD) is a prevalent (1:31) neurodevelopmental disability characterized by social communication differences and restricted interests and behaviors [5, 6].”
Exploring the Effects of Soft Skill Training among ABA Practitioners: A Systematic Review
Barrera-Lansford, A., O’Reilly, M. F., & DeMayo, M. (2026) · Behavior Analysis in Practice · doi:10.1007/s40617-026-01162-4 · Cited by 1
Getzler, I., Malachy, A., Fremder, A., & Stolar, O. E. (2026) · Journal of Autism and Developmental Disorders · doi:10.1007/s10803-026-07282-8 · Cited by 1
Dipu, R. H., Hridika, A. R., Ahmed, M. F., Arif, M. T., Das, S., & Salehin, A. (2025) · IEEE International Conference on Robotics, Automation, Artificial-Intelligence and Internet-of-Things (RAAICON) · doi:10.1109/raaicon69033.2025.11502258 · Cited by 1
Li, S., Li, X., Xie, L., Liu, X., Wei, X., Ji, W., Hu, L., & Li, H. (2026) · Review Journal of Autism and Developmental Disorders · doi:10.1007/s40489-026-00573-x · Cited by 1
Song, W., McQuaid, G. A., Charlton, R. A., & Wallace, G. L. (2026) · Autism · doi:10.1177/13623613261446878 · Cited by 2
“As the number of older people grows, and diagnoses of autism are becoming more common among older people (Shaw et al., 2025), there will be an increase in the demand for both formal and informal provisions of long-term care and support that maximize QoL.”
Su, W.-C., Tsuzuki, D., & Bhat, A. N. (2026) · Brain Sciences · doi:10.3390/brainsci16050540 · Cited by 1
“Autism Spectrum Disorder (ASD) is a prevalent neurodevelopmental condition, affecting approximately 1 in 31 children in the United States [1].”
Love, A. M. A., Edwards, C., Rideout, B., Hollenberg, L., Clapham, H., McKeown, G., Robinson, A., Cai, R. Y., Benzie, C. A., Rabba, A. S., et al. (2026) · Midwifery · doi:10.1016/j.midw.2026.104868 · Cited by 1
Claussen, S., & Pahr-Hosbach, S. (2026) · Journal of Autism and Developmental Disorders · doi:10.1007/s10803-026-07365-6 · Cited by 1
Autism Spectrum Disorder: Integrating Genetic and Environmental Risk
Kamijo, S., Miwa, H., & Ikeda, K. (2026) · Cells · doi:10.3390/cells15110985 · Cited by 2
“In the United States, the Autism and Developmental Disabilities Monitoring Network has tracked ASD prevalence among 8-year-old children biennially since 2000 [7].”
Rios-Vega, L., Rising, K. L., Freedman, B. H., Fields, M., DeCamp, L. R., Martinsen, E., Ramos, J., Arroyo, J., & Schaaf, R. C. (2026) · American Journal of Occupational Therapy · doi:10.5014/ajot.2026.051447 · Cited by 1
DeMonte, K. H., Lugo‐Neris, M. J., & Perry, B. J. (2026) · Language Speech and Hearing Services in Schools · doi:10.1044/2026_lshss-25-00080 · Cited by 1
Ryan, E., McDonnell, D., Healy, S., Lloyd, R. S., & Kinsella, S. (2026) · Autism · doi:10.1177/13623613261448516 · Cited by 1
“For example, in the United States, the prevalence of autism among 8-year-old children is estimated to be around 1 in 31 (Shaw, 2025), while in Northern Ireland, recent reports estimate figures to be 1 in 17 children (Kinghan & Pham, 2025).”
Moldovanu, I. D., Popa, E., & Moldovanu, S. (2026) · AI in Education · doi:10.3390/aieduc2020021 · Cited by 1
Cortical transcriptomic dysregulation in Autism spectrum disorder: A conceptual synthesis
Kurmashev, R. (2026) · IBRO Neuroscience Reports · doi:10.1016/j.ibneur.2026.06.004 · Cited by 1
Elkhodiry, A. A., Bokhari, S. A., Alagha, N., Mohammed, D., Kakkar, R., Abdalla, A., Copiaco, A., Himeur, Y., Ritz, C., Beheshti, A., et al. (2026) · BMC Psychiatry · doi:10.1186/s12888-026-08255-y · Cited by 1
Tsen, A. S. F., Bantalani, M. A., Rahim, M. N. A., Amat, S. Z. A., & Mokti, K. (2026) · Family Medicine and Community Health · doi:10.1136/fmch-2026-004072 · Cited by 1
Advances in supporting development in autistic children and youth
Penner, M., Zwaigenbaum, L., Piroddi, N., Park, S., Minhas, R. S., & Singal, D. (2026) · BMJ · doi:10.1136/bmj-2025-086562 · Cited by 2
“17”
Zhang, Q., Li, M., Zhou, Z., Tian, L., Liu, L. L., & Zhang, J. (2026) · Frontiers in Psychiatry · doi:10.3389/fpsyt.2026.1849124 · Cited by 1
Autism screening and diagnosis in children with congenital heart disease
Perez, N. L. O., Rios, P. M., Marchman, V. A., Aishworiya, R., Wang, S. F., & Feldman, H. M. (2026) · Frontiers in Pediatrics · doi:10.3389/fped.2026.1839114 · Cited by 1
Teaching students with autism: Teachers’ strengths, difficulties, facilitators, and barriers
Lory, C., Lei, Q., Gregori, E. V., Hammond, T., Lee, R., & Huff, S. (2026) · Research in Autism · doi:10.1016/j.reia.2026.202962 · Cited by 1
Dimer, N. A., Melo, A. P. S., Santomauro, D. F., Malta, D. C., Duncan, B. B., & de Goulart, B. N. G. (2026) · Revista Brasileira de Epidemiologia · doi:10.1590/1980-549720260025 · Cited by 1
“In 2022, the estimated prevalence in this age group ranged from 0.97% to 5.31% 13 .”
InfluentialLong, Q., Xu, C., Yang, Y., Wang, Y., Yan, X., Jz, L., & Yang, W. (2026) · Journal of Autism and Developmental Disorders · doi:10.1007/s10803-026-07414-0 · Cited by 1
Li, Q., Tuerdi, Z., Li, B., Guan, H., 张文清, Wang, Y., & He, Y. (2026) · BMC Psychiatry · doi:10.1186/s12888-026-08319-z · Cited by 4
“According to the most recent data released by the U.S. Centers for Disease Control and Prevention (CDC) based on its surveillance network, the prevalence of ASD among 8-year-old children has reached nearly 1 in 31, indicating a growing disease burden [1].”
Seung, H., Baek, J. M., Jung, A., Lee, S. H., & Girolamo, T. M. (2026) · American Journal of Speech-Language Pathology · doi:10.1044/2026_ajslp-25-00501 · Cited by 1
Wong, R. C. P., & Bates, G. W. (2026) · Mindfulness · doi:10.1007/s12671-026-02909-4 · Cited by 1
“Prevalence rates range from 0.29% in Taiwan (Chien et al., 2011) to 3.22% in the USA (Shaw et al., 2025).”
InfluentialGardner, L. M., Powell, L., & Campbell, J. M. (2026) · Research in Autism · doi:10.1016/j.reia.2026.202971 · Cited by 1
do Vale, P. R. L. F., CERQUEIRA, E. C. D. S., dos Santos, D. V., Dezoti, A. P., Mazza, V. D. A., de Carvalho, R. C., & Carvalho, E. S. D. S. (2026) · Revista Latino-Americana de Enfermagem · doi:10.1590/1518-8345.8152.4882 · Cited by 1
Accommodations to Evidence-Based Treatment for Autistic Clients: Quality ASD-Informed Care
Merrill, A. C., Green, A., & Burkhardt, S. (2026) · Journal of Health Service Psychology · doi:10.1007/s42843-026-00158-6 · Cited by 1
“The diagnosis of autism spectrum disorder (ASD) has been part of the clinical landscape for decades (Mintz, 2017; Orinstein et al., 2014; Smith, 2012) with the prevalence increasing (Shaw et al., 2025).”
Associations of prenatal metal exposures with autism-related outcomes in the ECHO cohort
Lin, P. D., Cárdenas, A., Lyall, K., Bilder, D. A., MacKenzie, D. A., Nozadi, S. S., Rennie, B. J., Schmidt, R. J., Volk, H. E., Dickerson, A. S., et al. (2026) · Environmental Epidemiology · doi:10.1097/ee9.0000000000000500 · Cited by 1
Self-citationWicker, A. L., Sutherland, V., Paez, E., Carrasco, V. I. U., Zuckerman, K. E., & Lindly, O. (2026) · Journal of Autism and Developmental Disorders · doi:10.1007/s10803-026-07457-3 · Cited by 2
Ram, K., Hill, M., Stewart, C., Hardy, K. P., & Khurana, S. G. (2026) · Developmental Medicine & Child Neurology · doi:10.1111/dmcn.70385 · Cited by 1
Autism Spectrum Disorder Incidence by Age and Sex in a US Health Care System, 2016 to 2024
Messias, E., Casanova, E., Huang, R., Battula, S., Loftin, R. L., Walsh, M., & Lin, P. (2026) · JAMA Network Open · doi:10.1001/jamanetworkopen.2026.24561 · Cited by 2
Heterogeneity in autism — challenges and opportunities
Yu, X. (2026) · Current Opinion in Neurobiology · doi:10.1016/j.conb.2026.103250 · Cited by 1
Neonatal Medical Male Circumcision and Child Autism Diagnosis
McGrath, M., Li, X., Jacobson, L. P., Leventhal, B., Aschner, J. L., Baker, B. H., Garcia, K. C., Dickerson, A. S., Elliott, A., Ganiban, J., et al. (2026) · Archives of Pediatrics and Adolescent Medicine · doi:10.1001/jamapediatrics.2026.3239 · Cited by 1
Self-citationCo-Occurring Autism and Obsessive-Compulsive Disorder: Evidence-Based Assessment and Intervention
Messerli, M. C., Yagi, K., Morgan, M. B., Trent, E. S., Onyeka, O. “., Storch, E. A., & Wiese, A. D. (2026) · Journal of Health Service Psychology · doi:10.1007/s42843-026-00160-y · Cited by 1
“…groups, girls, children with limited language abilities, and those facing socioeconomic barriers continue to experience disparities in the timing of autism identification and access to diagnostic and behavioral health services (Shaw et al., 2025; Zuckerman et al., 2014; Aylward et al., 2021).”
Dando, E., Hahn, J., Geier, D., Whiteley, A., & Whiteley, P. (2026) · Healthcare · doi:10.3390/healthcare14162492 · Cited by 1
“Multiple data show a consistent increase in both the number of children presenting with features of autism and those in receipt of a formal diagnoses [7] across decades.”
Wilson, R. J., Panesar, H. K., Dursun, İ., Mendieta, R., Andrew, P. M., Li, X., Lehmler, H., & Lein, P. J. (2026) · Frontiers in Toxicology · doi:10.3389/ftox.2026.1816944 · Cited by 1
“This, coupled with evidence that the prevalence of autism has increased over the past several decades (Shaw et al., 2025; Global Burden of Disease Study 2021 Autism Spectrum Collaborators, 2025), has generated considerable interest in identifying factors that influence individual risk and/or…”
Fowler, K. A., Zwald, M. L., Bryant, C. K., Blair, J. M., & Holland, K. (2026) · Injury Prevention · doi:10.1136/ip-2026-046194 · Cited by 1
Arutiunian, V., Sugar, C. A., Naples, A., Santhosh, M., Levin, A. R., Borland, H., Benton, J., Bernier, R., Chawarska, K., Dawson, G., et al. (2026) · European Neuropsychopharmacology · doi:10.1016/j.euroneuro.2026.113864 · Cited by 1
Excitation/inhibition balance subtypes in autism and their genetic, neural, and clinical profiles
Arutiunian, V., Sullivan, C. A. W., Santhosh, M., Neuhaus, E., Borland, H., Bernier, R., Bookheimer, S. Y., Dapretto, M., Jack, A., Jeste, S., et al. (2026) · Journal of Neural Transmission · doi:10.1007/s00702-026-03283-0 · Cited by 1
Cumulative Incidence and Prevalence of Autism Spectrum Disorder
Kim, Y. S., Liu, X., Chang, J., Koh, Y., Kim, J., Choi, Y., Cho, Y. J., Fombonne, E. J., & LEVENTHAL, B. L. (2026) · Archives of Pediatrics and Adolescent Medicine · doi:10.1001/jamapediatrics.2026.4066 · Cited by 2
CRISPR-Enabled functional genomics in hPSCs-derived neural models for autism spectrum disorder
Gopukumar, S. T., Saha, M., Soni, T. K., Alatwi, E. S., Khan, G. A., Asad, M. R., Shamshad, S., Tadakod, S., Sharma, A., & Das, U. (2026) · Metabolic Brain Disease · doi:10.1007/s11011-026-01968-9 · Cited by 2
“The disorder affects approximately 1–2% of the global population (Lai et al. 2014), with the most recent surveillance data from the United States estimating a prevalence of about 1 in 31 chil - dren aged 8 years (Shaw et al. 2025).”
Prevalence of autism spectrum disorder in children: complete census of a Brazilian municipality
Forcelini, C. M., Carregosa, A. L. D. S., Leitzke, E., da Silva, G., Ampese, R., de Moura, I. D., & de Melo, H. Y. (2026) · Cadernos de Saúde Pública · doi:10.1590/0102-311xen255925 · Cited by 1
Jack, A., & Gupta, A. R. (2026) · Research in Autism · doi:10.1016/j.reia.2026.203025 · Cited by 1
Wall, C. A., Dommer, K. J., Kim, S. H., Skytta, J. A. F., Corrigan, S., Olson, E., Michener, K., Juul, S. E., Mayock, D. E., Christakis, D., et al. (2026) · Autism · doi:10.1177/13623613261486726 · Cited by 1
Arutiunian, V., Davoudi, S., Gaougaou, G., Knoth, I. S., Buckser, R., Marcil, V., & Lippé, S. (2026) · Frontiers in Psychiatry · doi:10.3389/fpsyt.2026.1892698 · Cited by 1
Disparities in Autism Spectrum Disorder and Perinatal Risk Factors
del Giorgio, F., Driollet, B., Buajitti, E., Ahmed, A., Hutcheon, J. A., Rosella, L. C., & Yang, S. (2026) · JAMA Network Open · doi:10.1001/jamanetworkopen.2026.37174 · Cited by 1
Korkmaz, S., Agathe, J. D. S., Cliquet, F., Martin, L. C., Barthome, E., Fleury, M., Segers, J., Bonnot-Briey, S., de Puget, V. G., Zhou, Y., et al. (2026) · Biological Psychiatry · doi:10.1016/j.biopsych.2026.10.003 · Cited by 1
Clinical protocol for nutritional screening in autism (PANA): a cross-sectional study protocol
Vaz, J. D. S., Valle, S. C., Silva, E. D. S., Hoffmann, L. V., Luçardo, J. D. C., Maia, J. C., Magalhães, L. V. D. S., & Grokoski, K. C. (2025) · BMJ Open · doi:10.1136/bmjopen-2024-097321 · Cited by 2
Zhang, R., Chen, J., Liu, X., Gan, Y., & Wang, G. (2025) · Humanities and Social Sciences Communications · doi:10.1057/s41599-025-05068-4 · Cited by 1
“The prevalence rate was estimated to be one in 31 for children aged 8 years in the United States (Shaw et al., 2025).”
Rare Variant Burden and Behavioral Phenotypes in Children with Autism in Slovakia
Repiská, G., Konečný, M., Krasňanská, G., Celušáková, H., Belica, I., Rašková, B., Kopčíková, M., Keményová, P., Ostatníková, D., & Lakatošová, S. (2025) · Genes · doi:10.3390/genes16080893 · Cited by 2
Kozlova, E. V., Gonzalez, G. M., Denys, M. E., Bishay, A. E., Gutierrez, R., Reid, J., Krum, J. M., Lampel, G., Luvsanravdan, N., Rabbani, K. M., et al. (2025) · bioRxiv (Cold Spring Harbor Laboratory) · doi:10.1101/2025.09.02.673882 · Cited by 1
A prevalence study of Autism Spectrum Disorder in the Russian FederationPreprint
Talantseva, O. I., Romanova, R. S., Kuznetsova, J. E., Manasevich, V. A., Lind, K. V., Parfenenko, M. A., Benoit, J. S., & Grigorenko, E. L. (2025) · medRxiv · doi:10.1101/2025.10.20.25338431 · Cited by 1
Metadata
- Authors
- Shaw, K. A., Williams, S., Patrick, M. E., Valencia-Prado, M., Durkin, M. S., Howerton, E. M., Ladd-Acosta, C. M., Pas, E. T., Bakian, A. V., Bartholomew, P., Nieves-Muñoz, N., Sidwell, K., Alford, A., Bilder, D. A., DiRienzo, M., Fitzgerald, R. T., Furnier, S. M., Hudson, A. E., Pokoski, O. M., Shea, L., Tinker, S. C., Warren, Z., Zahorodny, W., Agosto-Rosa, H., Anbar, J., Chavez, K. Y., Esler, A., Forkner, A., Grzybowski, A., Agib, A. H., Hallas, L., Lopez, M., Magaña, S., Nguyen, R. H. N., Parker, J., Pierce, K., Protho, T., Torres, H., Vanegas, S. B., Vehorn, A., Zhang, M., Andrews, J., Greer, F., Hall-Lande, J., McArthur, D., Mitamura, M., Montes, A. J., Pettygrove, S., Shenouda, J., Skowyra, C., Washington, A., & Maenner, M. J.
- Affiliations
- Centers for Disease Control and Prevention (US)
- University of Wisconsin–Madison (US)
- Johns Hopkins University (US)
- University of Utah (US)
- University of California San Diego (US)
- National Center on Birth Defects and Developmental Disabilities (US)
- Rutgers New Jersey Medical School (US)
- Pennsylvania Department of Human Services (US)
- Washington University in St. Louis (US)
- University of Arkansas for Medical Sciences (US)
- Vanderbilt University Medical Center (US)
- Puerto Rico Department of Health (PR)
- University of Minnesota (US)
- The University of Texas at Austin (US)
- Arizona State University (US)
- University of Arizona (US)
- Corresponding author
- Shaw, Kelly A.
- ORCID
- Patrick, Mary E.
- Durkin, Maureen S.
- Howerton, Ellen M.
- Ladd-Acosta, Christine M.
- Pas, Elise T.
- Bakian, Amanda V.
- Alford, Amy
- Bilder, Deborah A.
- DiRienzo, Monica
- Fitzgerald, Robert T.
- Furnier, Sarah M.
- Pokoski, Olivia M.
- Shea, Lindsay
- Tinker, Sarah C.
- Warren, Zachary
- Zahorodny, Walter
- Anbar, Joshua
- Esler, Amy
- Lopez, Maya
- Magaña, Sandy
- Nguyen, Ruby H.N.
- Pierce, Karen
- Vanegas, Sandra B.
- Zhang, Minyu
- Andrews, Jennifer
- McArthur, Dedria
- Pettygrove, Sydney
- Shenouda, Josephine
- Washington, Anita
- Maenner, Matthew J.
- Venue
- MMWR. Surveillance Summaries
- Published
- 2025-04-17
- Volume
- 74
- Issue
- 2
- Pages
- 1-22
- ISSN
- 1545-8636 (ISSN-L)
- 1546-0738
- PMC
- PMC12011386
- OpenAlex
- W4409458169
- Semantic Scholar
- ce82e952834c1f4b32c7226767552851cc1f0430
- Cited by
- 867
- References
- 31
- Citations by year
- 2026: 615 · 2025: 252
- FWCI
- 491.83
- Type
- journal article
- Language
- en
- Open access
- diamond
- doi.org
- Licence
- public-domain
- Locations
- MMWR Surveillance Summaries (publishedVersion, public-domain)
- PubMed Central (publishedVersion, public-domain)
- PubMed (publishedVersion)
- Topics
- Life Sciences › Neuroscience › Cognitive Neuroscience › Autism Spectrum Disorder Research
- Health Sciences › Medicine › Psychiatry and Mental health › Child Nutrition and Feeding Issues
- Social Sciences › Psychology › Clinical Psychology › Family and Disability Support Research
- Keywords
- autism spectrum disorder, autism prevalence, sex differences, racial and ethnic disparities, ASD subtypes, developmental disabilities, prevalence, early detection, autism screening
- MeSH terms
- Autism Spectrum Disorder, Child, Child, Preschool, Female, Humans, Male, Population Surveillance, United States, Prevalence, Early Diagnosis
About these checks
Registry, retraction, Cites and statistics results are computed, not judged, with one exception: a printed reference that no index lists is read once by a model before it counts as a citation error. Claims are extracted by a model and kept only when their quote appears verbatim in the text; each cited source is then checked, with a model’s help, for whether it says what the claim relies on. Those verdicts can be wrong — read the claim’s quote and the cited source before relying on one.
A language model drew the claims from the paper on 2026-10-06, under version 3 of the claim definition (model deepseek-v4.1-flash, prompt extract-v3).
A second model labelled each claim on 2026-10-06 (model jev-1.13-20260917, definition revision gold-guideline-v0.2).
Statistics and arithmetic are recomputed, not judged.
Confidence bands are shown only for fields calibrated on our annotated test set. None is calibrated yet, so no band is shown.
What counts as a claim ›How we measure confidence ›How we check this ›
Are you an author, or do you see a problem with this page? Request a review
