

The DOI matches its Crossref record; 2 of the 2 references it cites were found in a registry or an index.
What makes a blood cell based miRNA expression pattern disease specific? - A miRNome analysis of blood cell subsets in lung cancer patients and healthy controls
Overview
The claims and statistics of this paper haven’t been checked yet.
Run the check — free, no account needed. It reads the open-access text and checks the sources it cites.
Integrity signals
Registry
Cites
Statistics
Figures
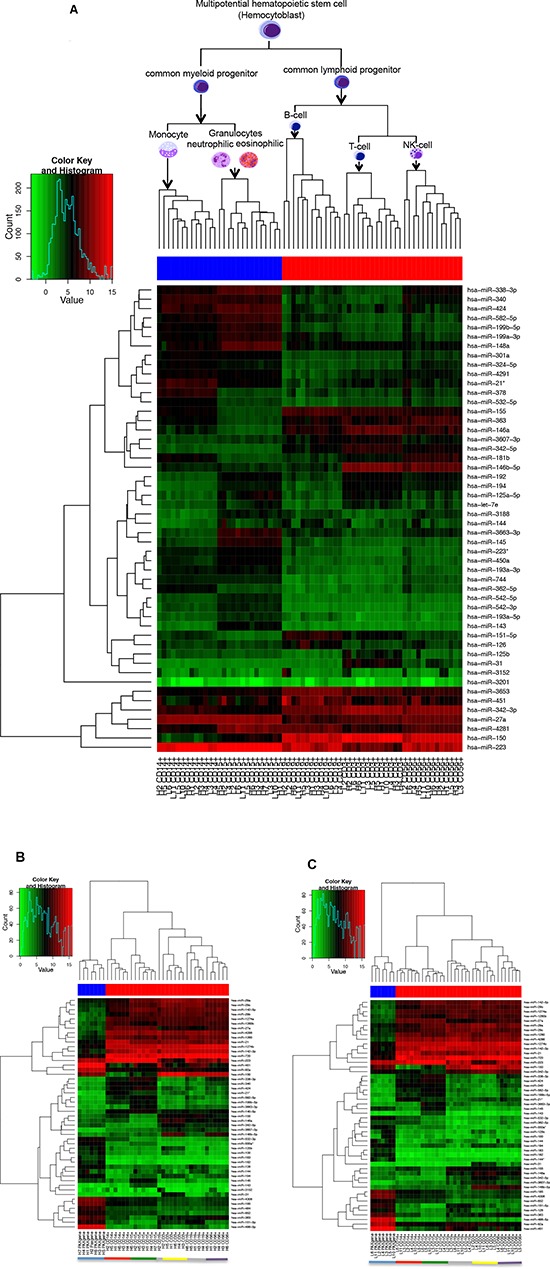
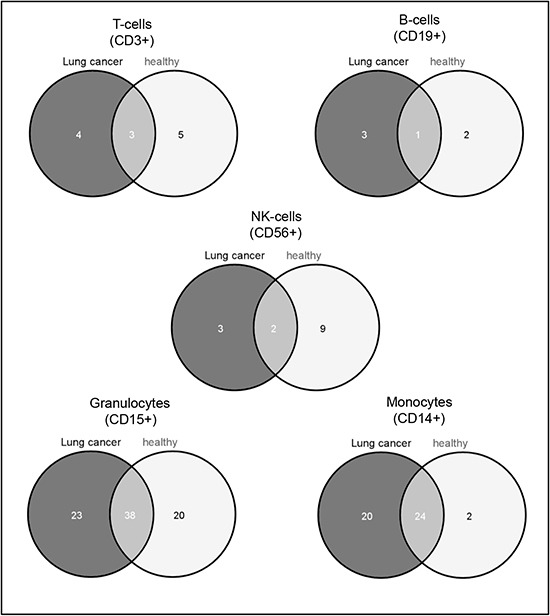
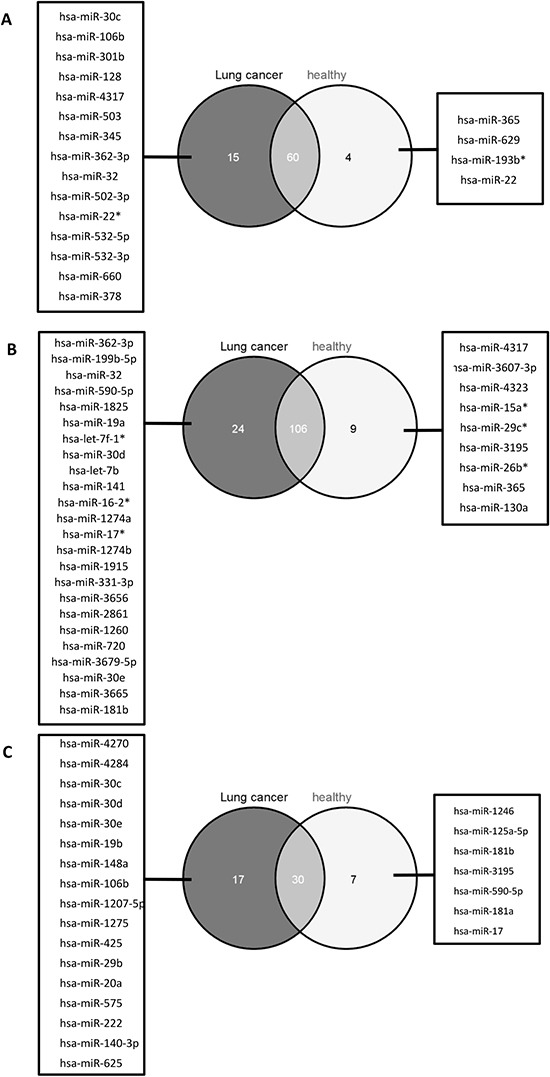
Verification
Claims the paper makes
The claims and statistics of this paper haven’t been checked yet.
Run the check — free, no account needed. It reads the open-access text and checks the sources it cites.
Claims other papers make about this one
Each is checked against this paper’s own text: does it say what the citing paper says it does?
In the citing paper
“However, additional blood components, such as erythrocytes, platelets, or exosomes, are presumed contributing to the whole blood miRNome”
From Red Blood Cells as Potential Repositories of MicroRNAs in the Circulatory System (2020) · cites this paper as Leidinger et al., 2014
In the citing paper
“Leidinger et al. (2014) found that the expression profiles of cancer-specific miRNAs in whole blood samples are mainly determined by leukocytes.”
From Red Blood Cells as Potential Repositories of MicroRNAs in the Circulatory System (2020) · cites this paper as Leidinger et al., 2014
In the citing paper
“(2) lungs are the main oxygen exchange organs where a large amount of RBCs accumulate, and RBCs may be one of the cell types of which miRNAs are influenced in lung cancer (Leidinger et al., 2014);”
From Red Blood Cells as Potential Repositories of MicroRNAs in the Circulatory System (2020) · cites this paper as Leidinger et al., 2014
Self-check
Percentages, sums and reported differences re-computed from the paper’s own numbers.
The self-check needs the paper’s full text.
Citations
Cites
Markou, A., Tsaroucha, E. G., Kaklamanis, L., Fotinou, M., Georgoulias, V., & Lianidou, E. S. (2008) · Clinical Chemistry · doi:10.1373/clinchem.2007.101741 · Cited by 441
Differential expression of microRNAs in hematopoietic cell lineages
Merkerova, M., Belickova, M., & Bruchova, H. (2008) · European Journal of Haematology · doi:10.1111/j.1600-0609.2008.01111.x · Cited by 240
Research works printed but not linked: 39
- Enright, 2006, miRBase: microRNA sequences, targets and gene nomenclature, Nucleic Acids Res, 34, D140
- Griffiths-Jones, miRBase: integrating microRNA annotation and deep-sequencing data, Nucleic Acids Res, 39, D152
- Agami, 2011, MicroRNA regulation by RNA-binding proteins and its implications for cancer, Nat Rev Cancer, 11, 644, 10.1038/nrc3107 · DOI · Paper page
- Mendell, 2006, A small piece in the cancer puzzle: microRNAs as tumor suppressors and oncogenes, Oncogene, 25, 6188, 10.1038/sj.onc.1209913 · DOI
- Slack, 2006, Oncomirs - microRNAs with a role in cancer, Nat Rev Cancer, 6, 259, 10.1038/nrc1840 · DOI · Paper page
- Cho, 2007, OncomiRs: the discovery and progress of microRNAs in cancers, Mol Cancer, 6, 60, 10.1186/1476-4598-6-60 · DOI
- Croce, 2009, Causes and consequences of microRNA dysregulation in cancer, Nat Rev Genet, 10, 704, 10.1038/nrg2634 · DOI
- Meese, 2011, Next-generation sequencing identifies novel microRNAs in peripheral blood of lung cancer patients, Molecular bioSystems, 7, 3187, 10.1039/c1mb05353a · DOI
- Ruprecht, 2011, Toward the blood-borne miRNome of human diseases, Nature methods, 8, 841, 10.1038/nmeth.1682 · DOI · Paper page
- Meese, 2009, miRNAs in lung cancer - studying complex fingerprints in patient's blood cells by microarray experiments, BMC Cancer, 9, 353, 10.1186/1471-2407-9-353 · DOI
- Meese, 2011, Stable serum miRNA profiles as potential tool for non-invasive lung cancer diagnosis, RNA Biol, 8, 506, 10.4161/rna.8.3.14994 · DOI
- Meese, 2012, MicroRNA expression changes after lung cancer resection: A follow-up study, RNA Biol, 9, 900, 10.4161/rna.20107 · DOI
- Meese, 2011, Specific peripheral miRNA profiles for distinguishing lung cancer from COPD, Lung Cancer, 74, 41, 10.1016/j.lungcan.2011.02.003 · DOI
- Meese, 2012, MicroRNAs - Important Molecules in Lung Cancer Research, Front Genet, 2, 104
- Jemal, 2013, Cancer statistics, 2013, CA Cancer J Clin, 63, 11, 10.3322/caac.21166 · DOI · Paper page
- Pacheco, 2012, Expression profiling of human immune cell subsets identifies miRNA-mRNA regulatory relationships correlated with cell type specific expression, PLoS One, 7, e29979, 10.1371/journal.pone.0029979 · DOI
- Benz, 2010, Comprehensive microRNA expression profiling of the hematopoietic hierarchy, Proc Natl Acad Sci U S A, 107, 15443, 10.1073/pnas.1009320107 · DOI
- Kieda, 2013, MicroRNAs and Tumor Vasculature Normalization: Impact on Anti-Tumor Immune Response, Arch Immunol Ther Exp (Warsz), 61, 285, 10.1007/s00005-013-0231-4 · DOI
- Hochberg, 1988, A sharper bonferroni procedure for multiple tests of significance, Biometrica, 75, 185, 10.1093/biomet/75.4.800 · DOI · Paper page
- Golani, 2001, Controlling the false discovery rate in behavior genetics research, Behav Brain Res, 125, 279, 10.1016/S0166-4328(01)00297-2 · DOI · Paper page
- Coussens, 2006, Paradoxical roles of the immune system during cancer development, Nat Rev Cancer, 6, 24, 10.1038/nrc1782 · DOI
- Tanabe, 2007, Cancer immunoediting from immune surveillance to immune escape, Immunology, 121, 1, 10.1111/j.1365-2567.2007.02587.x · DOI
- Speiser, 2012, The three main stumbling blocks for anticancer T cells, Trends Immunol, 33, 364, 10.1016/j.it.2012.02.006 · DOI
- Whiteside, 2013, Regulatory T cell subsets in human cancer: are they regulating for or against tumor progression?, Cancer Immunol Immunother
- Sakaguchi, 2010, Regulatory T cells in tumor immunity, Int J Cancer, 127, 759, 10.1002/ijc.25429 · DOI · Paper page
- Shu, 2010, MiR-21 overexpression in human primary squamous cell lung carcinoma is associated with poor patient prognosis, J Cancer Res Clin Oncol, 137, 557
- Lianidou, 2013, Clinical evaluation of microRNA expression profiling in non small cell lung cancer, Lung Cancer, 81, 388, 10.1016/j.lungcan.2013.05.007 · DOI
- Shu, 2011, Identification of plasma microRNA-21 as a biomarker for early detection and chemosensitivity of non-small cell lung cancer, Chin J Cancer, 30, 407, 10.5732/cjc.010.10522 · DOI
- De, 2011, Prognostic significance of serum miRNA-21 expression in human non-small cell lung cancer, J Surg Oncol, 104, 847, 10.1002/jso.22008 · DOI
- Pothof, 2014, DNA damage responsive microRNAs misexpressed in human cancer modulate therapy sensitivity, Molecular oncology, 8, 458, 10.1016/j.molonc.2013.12.011 · DOI
- Harris, 2012, Circulating micro-RNA expression profiles in early stage nonsmall cell lung cancer, Int J Cancer, 130, 1378, 10.1002/ijc.26153 · DOI
- Zhou, 2013, miR-150 blocks MLL-AF9-associated leukemia through oncogene repression, Mol Cancer Res, 11, 912, 10.1158/1541-7786.MCR-13-0002-T · DOI
- Rajewsky, 2007, MiR-150 controls B cell differentiation by targeting the transcription factor c-Myb, Cell, 131, 146, 10.1016/j.cell.2007.07.021 · DOI
- Xu, 2013, miR-150 promotes the proliferation of lung cancer cells by targeting P53, FEBS Lett, 587, 2346, 10.1016/j.febslet.2013.05.059 · DOI
- Gao, 2012, Expression of miR-150 and miR-3940-5p is reduced in non-small cell lung carcinoma and correlates with clinicopathological features, Oncol Rep, 29, 704
- Isacke, 2009, A HaemAtlas: characterizing gene expression in differentiated human blood cells, Blood, 113, e1, 10.1182/blood-2008-06-162958 · DOI
- Gretz, 2011, miRWalk- database: prediction of possible miRNA binding sites by “walking” the genes of three genomes, Journal of biomedical informatics, 44, 839, 10.1016/j.jbi.2011.05.002 · DOI
- Lenhof, 2007, GeneTrail—advanced gene set enrichment analysis, Nucleic Acids Research, 35
- Kanehisa, 2002, The KEGG database, Novartis Found Symp, 247, 91, 10.1002/0470857897.ch8 · DOI
Cited by
Sorted by citations
Red Blood Cells as Potential Repositories of MicroRNAs in the Circulatory System
Sun, L., Yu, Y., Niu, B., & Wang, D. (2020) · Frontiers in Genetics · doi:10.3389/fgene.2020.00442 · Cited by 83
Metadata
- Authors
- Leidinger, P., Backes, C., Dahmke, I. N., Galata, V., Huwer, H., Stehle, I., Bals, R., Keller, A., & Meese, E.
- Affiliations
- Institute of Human Genetics, Medical School, Saarland University, Building 60, 66421 Homburg/Saar, Germany
- Department of Clinical Bioinformatics, Saarland University, Building E2.1, 66123 Saarbrücken, Germany
- Institute for Clinical and Experimental Surgery, Saarland University, Building 65, 66421 Homburg/Saar, Germany
- Department of Thoracic Surgery, Voelklingen Heart Center, 66333 Voelklingen Germany
- Department of Pneumology, Medical School, Saarland University, Building 91, 66421 Homburg/Saar, Germany
- Venue
- Oncotarget
- Publisher
- Impact Journals, LLC
- Published
- 2014-09-19
- Volume
- 5
- Issue
- 19
- Pages
- 9484-9497
- ISSN
- 1949-2553
- PMC
- PMC4253448
- Cited by
- 54
- References
- 2
- Language
- en
About these checks
Registry, retraction, Cites and statistics results are computed, not judged, with one exception: a printed reference that no index lists is read once by a model before it counts as a citation error. Claims are extracted by a model and kept only when their quote appears verbatim in the text; each cited source is then checked, with a model’s help, for whether it says what the claim relies on. Those verdicts can be wrong — read the claim’s quote and the cited source before relying on one.
Statistics and arithmetic are recomputed, not judged.
Confidence bands are shown only for fields calibrated on our annotated test set. None is calibrated yet, so no band is shown.
What counts as a claim ›How we measure confidence ›How we check this ›
Are you an author, or do you see a problem with this page? Request a review
