Cited by 147

The DOI matches its Crossref record; 5 of the 5 references it cites were found in a registry or an index.

Endothelial exosomes contribute to the antitumor response during breast cancer neoadjuvant chemotherapy via microRNA transfer

Bovy, Nicolas, Blomme, Benoît, Frères, Pierre, Dederen, Stella, Nivelles, Olivier, Lion, Michelle, Carnet, Oriane, Martial, Joseph A., Noël, Agnès, Thiry, Marc, Jérusalem, Guy, Josse, Claire, Bours, Vincent, Tabruyn, Sébastien P., Struman, Ingrid·2015·Oncotarget

Overview

The claims and statistics of this paper haven’t been checked yet.

Run the check — free, no account needed. It reads the open-access text and checks the sources it cites.

A few free checks a day · papers already verified open instantly · results are public

Integrity signals

Registry

Crossref · 10.18632/oncotarget.3520

Cites

5 of 5 references verified0 citation errors · 0 not checkable

Statistics

Figures

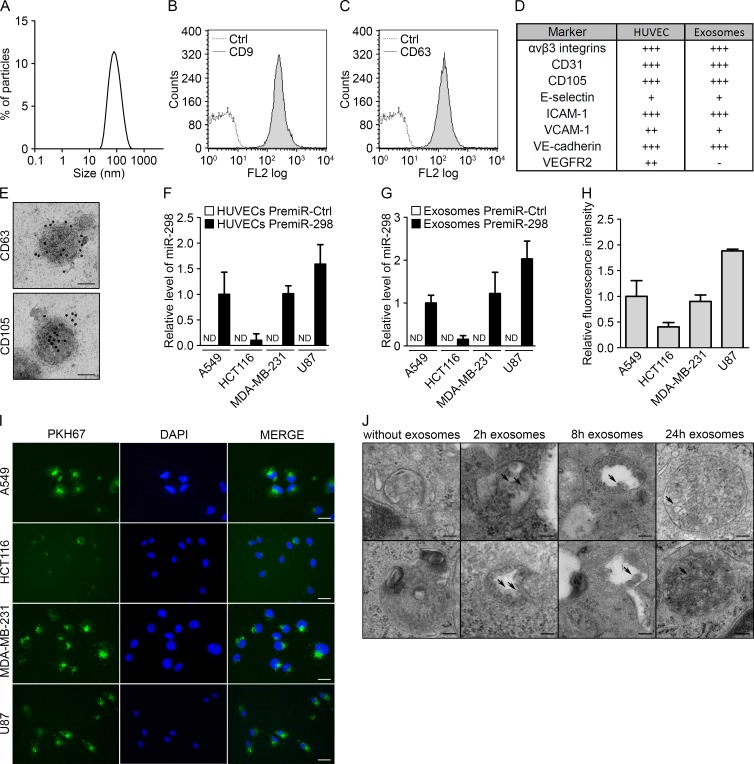
Figure 1 Endothelial exosomes can transfer miRNAs to tumor cells (A) Dynamic light scattering analysis of HUVEC exosomes (max = 94.93). Flow cytometry analysis of HUVEC exosomes immunolabeled for (B) CD9 and (C) CD63. (D) Table summarizing the levels of endothelial markers in HUVECs and HUVEC exosomes, measured using flow cytometry. (E) Electron micrographs of HUVEC exosomes labeled with CD63 and CD105, scale bars = 50 nm. (F) MiR-298 levels evaluated using qRT-PCR in cocultures either of tumor cells with HUVECs transfected with pre-miR-control or pre-miR-298 or (G) of tumor cells incubated with exosomes from HUVECs transfected with pre-miR-control or pre-miR-298. (H) Flow cytometry analysis of the uptake of exosomes (labeled with the green fluorescent PHK67 membrane linker) by tumor cells. (I) Fluorescence microscopy detection of the uptake of PHK67-labeled exosomes by tumor cells (DAPI, blue), scale bars = 25 μm. (J) Electron micrographs of MDA-MB-231 cell sections showing vesicles (arrows); after incubation with HUVEC exosomes for 0, 2, 8 and 24 hours, MDA-MB-231 cells showed larger multivesicular vesicles containing exosomes, scale bars = 100 nm. All data are the mean ± SD (n ≥ 3). *P < 0.05, **P < 0.01 and ***P < 0.001 vs. the respective control. Additionally, see Fig. S1.
Figure 1 Endothelial exosomes can transfer miRNAs to tumor cells (A) Dynamic light scattering analysis of HUVEC exosomes (max = 94.93). Flow cytometry analysis of HUVEC exosomes immunolabeled for (B) CD9 and (C) CD63. (D) Table summarizing the levels of endothelial markers in HUVECs and HUVEC exosomes, measured using flow cytometry. (E) Electron micrographs of HUVEC exosomes labeled with CD63 and CD105, scale bars = 50 nm. (F) MiR-298 levels evaluated using qRT-PCR in cocultures either of tumor cells with HUVECs transfected with pre-miR-control or pre-miR-298 or (G) of tumor cells incubated with exosomes from HUVECs transfected with pre-miR-control or pre-miR-298. (H) Flow cytometry analysis of the uptake of exosomes (labeled with the green fluorescent PHK67 membrane linker) by tumor cells. (I) Fluorescence microscopy detection of the uptake of PHK67-labeled exosomes by tumor cells (DAPI, blue), scale bars = 25 μm. (J) Electron micrographs of MDA-MB-231 cell sections showing vesicles (arrows); after incubation with HUVEC exosomes for 0, 2, 8 and 24 hours, MDA-MB-231 cells showed larger multivesicular vesicles containing exosomes, scale bars = 100 nm. All data are the mean ± SD (n ≥ 3). *P < 0.05, **P < 0.01 and ***P < 0.001 vs. the respective control. Additionally, see Fig. S1.CC BY · PubMed Central
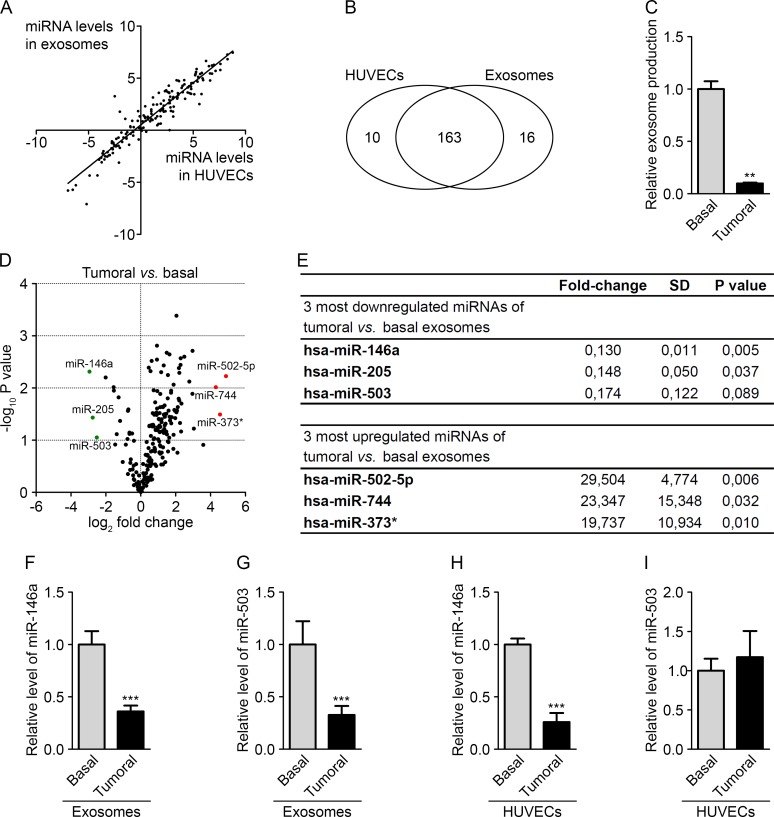
Figure 2 The tumor environment modifies the export of a subset of endothelial miRNAs (A) Dot plot of miRNA levels in HUVECs compared with HUVEC exosomes. (B) Diagram of miRNAs common and specific to HUVECs and HUVEC exosomes. (C) Exosome levels measured by protein quantification from the conditioned medium of HUVECs cultured in basal and tumor-mimicking medium conditions. (D) Volcano plot of fold changes (log2 values) and probability values (−log10) for individual miRNAs in the exosomes from HUVECs cultured under basal and tumoral conditions. (E) Table of the three most upregulated and downregulated miRNAs under tumoral vs. basal conditions. MiR-146a (F) and miR-503 (G) levels, evaluated by qRT-PCR in HUVEC exosomes cultured under tumoral or basal conditions. MiR-146a (H) and miR-503 (I) levels, evaluated by qRT-PCR in HUVECs cultured in tumoral or basal conditions. All data are the mean ± SD (A-E, n = 2; F-I, n = 3). *P < 0.05, **P < 0.01 and ***P < 0.001 vs. the respective control. Additionally, see Fig. S2.
Figure 2 The tumor environment modifies the export of a subset of endothelial miRNAs (A) Dot plot of miRNA levels in HUVECs compared with HUVEC exosomes. (B) Diagram of miRNAs common and specific to HUVECs and HUVEC exosomes. (C) Exosome levels measured by protein quantification from the conditioned medium of HUVECs cultured in basal and tumor-mimicking medium conditions. (D) Volcano plot of fold changes (log2 values) and probability values (−log10) for individual miRNAs in the exosomes from HUVECs cultured under basal and tumoral conditions. (E) Table of the three most upregulated and downregulated miRNAs under tumoral vs. basal conditions. MiR-146a (F) and miR-503 (G) levels, evaluated by qRT-PCR in HUVEC exosomes cultured under tumoral or basal conditions. MiR-146a (H) and miR-503 (I) levels, evaluated by qRT-PCR in HUVECs cultured in tumoral or basal conditions. All data are the mean ± SD (A-E, n = 2; F-I, n = 3). *P < 0.05, **P < 0.01 and ***P < 0.001 vs. the respective control. Additionally, see Fig. S2.CC BY · PubMed Central
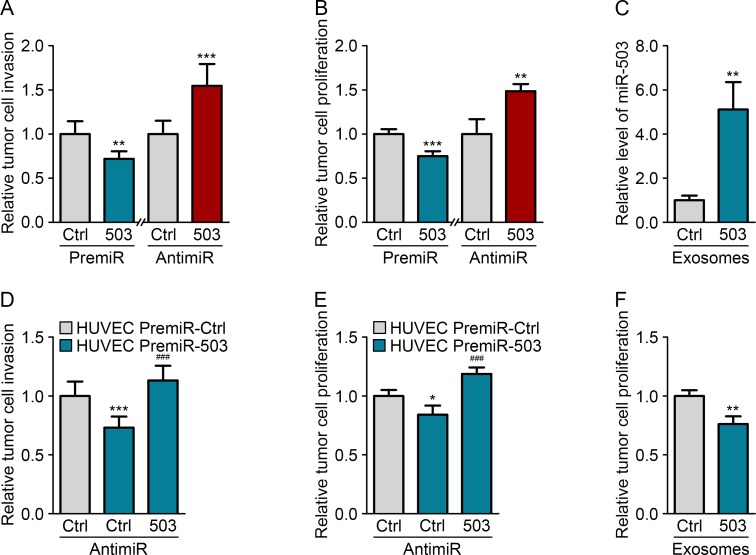
Figure 3 Endothelial miR-503 impairs tumor growth in vitro (A) Invasion level of MDA-MB-231 cells transfected with pre-miR-control or pre-miR-503 and with anti-miR-control or anti-miR-503. (B) Luminescence quantification of MDA-MB-231 cells transfected with pre-miR-control or pre-miR-503 and with anti-miR-control or anti-miR-503. (C) MiR-503 levels, measured by qRT-PCR in MDA-MB-231 cells incubated with 5 μg of HUVEC exosomes for 24 h. (D) Invasion level of MDA-MB-231 cells transfected with anti-miR-control or anti-miR-503 and cocultured with HUVECs transfected with pre-miR-control or pre-miR-503. (E) Luminescence quantification of MDA-MB-231 cells transfected with anti-miR-control or anti-miR-503 and cocultured with HUVECs transfected with pre-miR-control or pre-miR-503. (F) Luminescence quantification of MDA-MB-231 cells incubated with exosomes from HUVECs transfected with pre-miR-control or pre-miR-503. Additionally, see Fig. S3.
Figure 3 Endothelial miR-503 impairs tumor growth in vitro (A) Invasion level of MDA-MB-231 cells transfected with pre-miR-control or pre-miR-503 and with anti-miR-control or anti-miR-503. (B) Luminescence quantification of MDA-MB-231 cells transfected with pre-miR-control or pre-miR-503 and with anti-miR-control or anti-miR-503. (C) MiR-503 levels, measured by qRT-PCR in MDA-MB-231 cells incubated with 5 μg of HUVEC exosomes for 24 h. (D) Invasion level of MDA-MB-231 cells transfected with anti-miR-control or anti-miR-503 and cocultured with HUVECs transfected with pre-miR-control or pre-miR-503. (E) Luminescence quantification of MDA-MB-231 cells transfected with anti-miR-control or anti-miR-503 and cocultured with HUVECs transfected with pre-miR-control or pre-miR-503. (F) Luminescence quantification of MDA-MB-231 cells incubated with exosomes from HUVECs transfected with pre-miR-control or pre-miR-503. Additionally, see Fig. S3.CC BY · PubMed Central
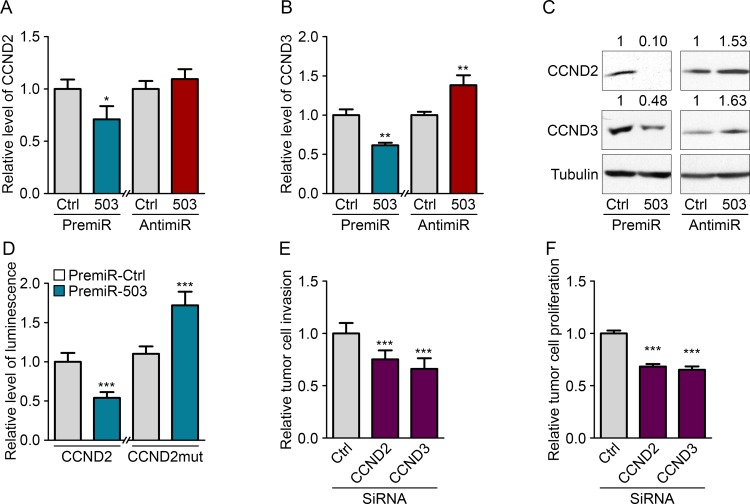
Figure 4 MiR-503 inhibits CCND2 and CCND3 expression of MDA-MB-231 Quantification of mRNA levels according to qRT-PCR of (A) CCND2 and (B) CCND3 in MDA-MB-231 cells transfected with pre-miR-503 or pre-miR-control and with anti-miR-control or anti-miR-503 and starved for 36 h. (C) Western blotting of CCND2 and CCND3 in MDA-MB-231 cells transfected with pre-miR-503 or pre-miR-control and with anti-miR-control or anti-miR-503 and starved for 36 h. (D) Luciferase activity from the CCND2 3′-UTR WT reporter plasmid and mutated NRAS 3′-UTR reporter plasmid cotransfected into MDA-MB-231 cells with pre-miR-control or pre-miR-503 after 24 hours. (E) Invasion levels of MDA-MB-231 cells transfected with siRNAs targeting CCND2 and CCND3. (F) Luminescence quantification of MDA-MB-231 cells transfected with siRNAs targeting CCND2 and CCND3. *P < 0.05, **P < 0.01 and ***P < 0.001 vs. the respective control. ###P < 0.001 vs. miR-503-exosomes with anti-miR-control. Additionally, see Fig. S4.
Figure 4 MiR-503 inhibits CCND2 and CCND3 expression of MDA-MB-231 Quantification of mRNA levels according to qRT-PCR of (A) CCND2 and (B) CCND3 in MDA-MB-231 cells transfected with pre-miR-503 or pre-miR-control and with anti-miR-control or anti-miR-503 and starved for 36 h. (C) Western blotting of CCND2 and CCND3 in MDA-MB-231 cells transfected with pre-miR-503 or pre-miR-control and with anti-miR-control or anti-miR-503 and starved for 36 h. (D) Luciferase activity from the CCND2 3′-UTR WT reporter plasmid and mutated NRAS 3′-UTR reporter plasmid cotransfected into MDA-MB-231 cells with pre-miR-control or pre-miR-503 after 24 hours. (E) Invasion levels of MDA-MB-231 cells transfected with siRNAs targeting CCND2 and CCND3. (F) Luminescence quantification of MDA-MB-231 cells transfected with siRNAs targeting CCND2 and CCND3. *P < 0.05, **P < 0.01 and ***P < 0.001 vs. the respective control. ###P < 0.001 vs. miR-503-exosomes with anti-miR-control. Additionally, see Fig. S4.CC BY · PubMed Central
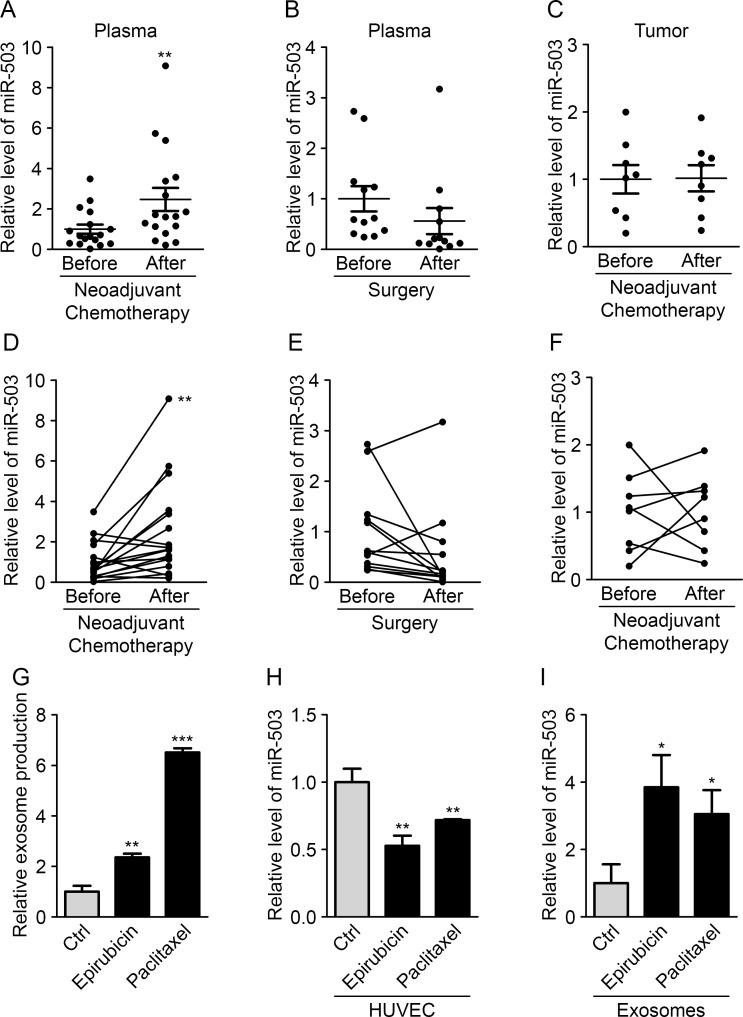
Figure 5 Neoadjuvant chemotherapy increases circulating miR-503 levels (A) The miR-503 ratio according to qRT-PCR in blood samples of breast cancer patients before and after neoadjuvant chemotherapy. (B) The miR-503 ratio according to qRT-PCR in blood samples of breast cancer patients before and after surgery. (C) The miR-503 ratio according to qRT-PCR in tumor biopsies and residual tumors of breast cancer patients. (D) Individual follow-up of miR-503 levels, evaluated by qRT-PCR, in blood samples of breast cancer patients before and after neoadjuvant chemotherapy. (E) Individual follow-up of miR-503 levels, evaluated by qRT-PCR, in blood samples of breast cancer patients before and after surgery. (F) Individual follow-up of miR-503 levels, evaluated by qRT-PCR, in tumor biopsies and residual tumors of breast cancer patients. (G) Exosome levels, measured by protein quantification, from the conditioned medium of HUVECs treated with paclitaxel and epirubicin for 24 h. (H) The miR-503 levels, evaluated by qRT-PCR, in HUVECs treated with paclitaxel and epirubicin for 24 h. (I) The miR-503 levels, evaluated by qRT-PCR, in exosomes from HUVECs treated with paclitaxel and epirubicin for 24 h. *P < 0.05, **P < 0.01 and ***P < 0.001 vs. the respective control.
Figure 5 Neoadjuvant chemotherapy increases circulating miR-503 levels (A) The miR-503 ratio according to qRT-PCR in blood samples of breast cancer patients before and after neoadjuvant chemotherapy. (B) The miR-503 ratio according to qRT-PCR in blood samples of breast cancer patients before and after surgery. (C) The miR-503 ratio according to qRT-PCR in tumor biopsies and residual tumors of breast cancer patients. (D) Individual follow-up of miR-503 levels, evaluated by qRT-PCR, in blood samples of breast cancer patients before and after neoadjuvant chemotherapy. (E) Individual follow-up of miR-503 levels, evaluated by qRT-PCR, in blood samples of breast cancer patients before and after surgery. (F) Individual follow-up of miR-503 levels, evaluated by qRT-PCR, in tumor biopsies and residual tumors of breast cancer patients. (G) Exosome levels, measured by protein quantification, from the conditioned medium of HUVECs treated with paclitaxel and epirubicin for 24 h. (H) The miR-503 levels, evaluated by qRT-PCR, in HUVECs treated with paclitaxel and epirubicin for 24 h. (I) The miR-503 levels, evaluated by qRT-PCR, in exosomes from HUVECs treated with paclitaxel and epirubicin for 24 h. *P < 0.05, **P < 0.01 and ***P < 0.001 vs. the respective control.CC BY · PubMed Central
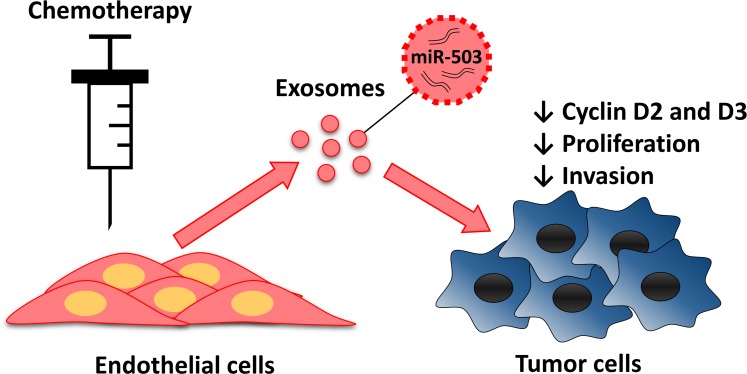
Figure 6 Endothelial transfer of miR-503 elicit antitumor response during neoadjuvant chemotherapy Endothelial cells treated with chemotherapeutic agents release more exosomes that contain more miR-503. MiR-503 loaded exosomes induce a reduction of breast cancer cells proliferation and invasion caused by the inhibition of CCND2 and CCND3.
Figure 6 Endothelial transfer of miR-503 elicit antitumor response during neoadjuvant chemotherapy Endothelial cells treated with chemotherapeutic agents release more exosomes that contain more miR-503. MiR-503 loaded exosomes induce a reduction of breast cancer cells proliferation and invasion caused by the inhibition of CCND2 and CCND3.CC BY · PubMed Central

Verification

Claims the paper makes

The claims and statistics of this paper haven’t been checked yet.

Run the check — free, no account needed. It reads the open-access text and checks the sources it cites.

A few free checks a day · papers already verified open instantly · results are public

Claims other papers make about this one

Each is checked against this paper’s own text: does it say what the citing paper says it does?

Self-check

Percentages, sums and reported differences re-computed from the paper’s own numbers.

The self-check needs the paper’s full text.

Citations

Cites

Research works printed but not linked: 36

  1. Miyazono, 2014, MicroRNA regulons in tumor microenvironment, Oncogene
  2. Burnouf, 2014, Regulation of tumor growth and metastasis: the role of tumor microenvironment, Cancer Growth Metastasis, 7, 9
  3. Carmeliet, 2005, Angiogenesis in life, disease and medicine, Nature, 438, 932, 10.1038/nature04478 · DOI
  4. Cheng, 2010, microRNA and cancer, AAPS J, 12, 309, 10.1208/s12248-010-9194-0 · DOI
  5. Zhang, 2010, MicroRNAs in vascular biology and vascular disease, J Cardiovasc Transl Res, 3, 235, 10.1007/s12265-010-9164-z · DOI
  6. Bartel, 2009, MicroRNAs: target recognition and regulatory functions, Cell, 136, 215, 10.1016/j.cell.2009.01.002 · DOI · Paper page
  7. Bartel, 2004, MicroRNAs: genomics, biogenesis, mechanism, and function, Cell, 116, 281, 10.1016/S0092-8674(04)00045-5 · DOI
  8. Gercel-Taylor, 2008, MicroRNA signatures of tumor-derived exosomes as diagnostic biomarkers of ovarian cancer, Gynecol Oncol, 110, 13, 10.1016/j.ygyno.2008.04.033 · DOI
  9. Lotvall, 2007, Exosome-mediated transfer of mRNAs and microRNAs is a novel mechanism of genetic exchange between cells, Nat Cell Biol, 9, 654, 10.1038/ncb1596 · DOI · Paper page
  10. Simpson, 2010, Exosomes: extracellular organelles important in intercellular communication, J Proteomics, 73, 1907, 10.1016/j.jprot.2010.06.006 · DOI
  11. Panaretakis, 2012, Tumor cell-derived exosomes: a message in a bottle, Biochim Biophys Acta, 1826, 103
  12. Sanchez-Madrid, 2011, Unidirectional transfer of microRNA-loaded exosomes from T cells to antigen-presenting cells, Nat Commun, 2, 282, 10.1038/ncomms1285 · DOI
  13. Martial, 2013, MicroRNA-146a is a therapeutic target and biomarker for peripartum cardiomyopathy, J Clin Invest, 123, 2143, 10.1172/JCI64365 · DOI
  14. Boon, 2012, Atheroprotective communication between endothelial cells and smooth muscle cells through miRNAs, Nat Cell Biol, 14, 249, 10.1038/ncb2441 · DOI
  15. Huang, 2014, Identification of a circulating microRNA signature for colorectal cancer detection, PLoS One, 9, e87451, 10.1371/journal.pone.0087451 · DOI
  16. Jerusalem, 2014, Neoadjuvant chemotherapy in breast cancer patients induces miR-34a and miR-122 expression, J Cell Physiol
  17. Liu, 2014, Circulating miR-222 in plasma and its potential diagnostic and prognostic value in gastric cancer, Med Oncol, 31, 164, 10.1007/s12032-014-0164-8 · DOI
  18. Kalluri, 2013, Exosomes in tumor microenvironment influence cancer progression and metastasis, J Mol Med (Berl), 91, 431, 10.1007/s00109-013-1020-6 · DOI
  19. Belting, 2013, Emerging roles of extracellular vesicles in the adaptive response of tumour cells to microenvironmental stress, J Extracell Vesicles, 2
  20. Clayton, 2010, Cancer exosomes trigger fibroblast to myofibroblast differentiation, Cancer Res, 70, 9621, 10.1158/0008-5472.CAN-10-1722 · DOI
  21. Ferrara, 2012, Tumour-secreted miR-9 promotes endothelial cell migration and angiogenesis by activating the JAK-STAT pathway, EMBO J, 31, 3513, 10.1038/emboj.2012.183 · DOI
  22. Llorente, 2012, Profiling of microRNAs in exosomes released from PC-3 prostate cancer cells, Biochim Biophys Acta, 1819, 1154, 10.1016/j.bbagrm.2012.08.016 · DOI
  23. Liu, 2013, miR-503 regulates the resistance of non-small cell lung cancer cells to cisplatin by targeting Bcl-2, Int J Mol Med, 32, 593, 10.3892/ijmm.2013.1439 · DOI
  24. Zhou, 2013, MicroRNA-503 inhibits the G1/S transition by downregulating cyclin D3 and E2F3 in hepatocellular carcinoma, J Transl Med, 11, 195, 10.1186/1479-5876-11-195 · DOI · Paper page
  25. Li, 2014, MiR-503 targets PI3K p85 and IKK-beta and suppresses progression of non-small cell lung cancer, Int J Cancer, 135, 1531, 10.1002/ijc.28799 · DOI
  26. Verhaar, 2013, Endothelial cells require miR-214 to secrete exosomes that suppress senescence and induce angiogenesis in human and mouse endothelial cells, Blood, 121, S1
  27. Asada, 2014, Dll4-containing exosomes induce capillary sprout retraction in a 3D microenvironment, Sci Rep, 4, 4031, 10.1038/srep04031 · DOI
  28. Kim, 2013, Exosomes derived from mesenchymal stem cells suppress angiogenesis by down-regulating VEGF expression in breast cancer cells, PLoS One, 8, e84256, 10.1371/journal.pone.0084256 · DOI
  29. Xu, 2012, Exosomes derived from human bone marrow mesenchymal stem cells promote tumor growth in vivo, Cancer Lett, 315, 28, 10.1016/j.canlet.2011.10.002 · DOI · Paper page
  30. Amigorena, 1998, Eradication of established murine tumors using a novel cell-free vaccine: dendritic cell-derived exosomes, Nat Med, 4, 594, 10.1038/nm0598-594 · DOI
  31. Dutta, 2010, MiR-322/424 and -503 are induced during muscle differentiation and promote cell cycle quiescence and differentiation by down-regulation of Cdc25A, Mol Biol Cell, 21, 2138, 10.1091/mbc.e10-01-0062 · DOI
  32. Wang, 2013, MicroRNA-503 targets FGF2 and VEGFA and inhibits tumor angiogenesis and growth, Cancer Lett, 333, 159, 10.1016/j.canlet.2013.01.028 · DOI
  33. Huber, 2010, MicroRNA expression after ionizing radiation in human endothelial cells, Radiat Oncol, 5, 25, 10.1186/1748-717X-5-25 · DOI
  34. Papadimitriou, 2012, Endothelial vascular toxicity from chemotherapeutic agents: preclinical evidence and clinical implications, Cancer Treatment Reviews, 38, 473, 10.1016/j.ctrv.2011.09.002 · DOI
  35. Bartel, 2011, MicroRNA destabilization enables dynamic regulation of the miR-16 family in response to cell-cycle changes, Mol Cell, 43, 993, 10.1016/j.molcel.2011.08.021 · DOI
  36. Griffioen, 2009, NF-kappaB activation in endothelial cells is critical for the activity of angiostatic agents, Mol Cancer Ther, 8, 2645, 10.1158/1535-7163.MCT-09-0383 · DOI

Cited by

Sorted by citations

See all 147

Metadata

Authors
Bovy, N., Blomme, B., Frères, P., Dederen, S., Nivelles, O., Lion, M., Carnet, O., Martial, J. A., Noël, A., Thiry, M., Jérusalem, G., Josse, C., Bours, V., Tabruyn, S. P., & Struman, I.
Affiliations
  • Laboratory of Molecular Angiogenesis, GIGA-R, University of Liège, Belgium
  • Laboratory of Human Genetics, GIGA-R, University of Liège, Belgium
  • Laboratory of Tumor & Development Biology, GIGA-R, University of Liège, Belgium
  • Laboratory of Cell and Tissues Biology, University of Liège, Belgium
  • Department of Medical Oncology, CHU, Liège, Belgium
Venue
Oncotarget
Published
2015-03-10
Volume
6
Issue
12
Pages
10253-10266
ISSN
1949-2553
Cited by
147
References
5
Language
en

About these checks

Registry, retraction, Cites and statistics results are computed, not judged, with one exception: a printed reference that no index lists is read once by a model before it counts as a citation error. Claims are extracted by a model and kept only when their quote appears verbatim in the text; each cited source is then checked, with a model’s help, for whether it says what the claim relies on. Those verdicts can be wrong — read the claim’s quote and the cited source before relying on one.

Statistics and arithmetic are recomputed, not judged.

Confidence bands are shown only for fields calibrated on our annotated test set. None is calibrated yet, so no band is shown.

What counts as a claim ›How we measure confidence ›How we check this ›

Are you an author, or do you see a problem with this page? Request a review