

The DOI matches its Crossref record; 50 of the 50 references it cites were found in a registry or an index; 26 of the 28 sources its claims cite were checked for support.
Bile Acids Are Substrates for Amine N-Acyl Transferase Activity by Bile Salt Hydrolase
Open accessPreprint — published as 10.1038/s41586-023-06990-w · Paper page
Abstract
Bacteria in the gastrointestinal tract (GI) produce a variety of amino acid bile acid amidates that impact host-mediated metabolic processes; however, the bacterial gene(s) responsible for their production remain unknown. Herein, we report that bile salt hydrolase (BSH) possesses dual functions, including a new role in bile acid metabolism by functioning as an amine N-acyl transferase that conjugates amines to form bacterial bile acid amidates (BBAAs). To characterize this new amine N-acyl transferase role for BSH, we used pharmacological inhibition of BSH, heterologous expression of bsh in Escherichia coli, and generated a bsh knockout and knockin in Bacteroides fragilis to demonstrate that BSH is necessary and sufficient for BBAA production. Lastly, we report that BBAAs activate host ligand-activated transcription factors including the farnesoid X receptor, pregnane X receptor, constitutive androstane receptor, and the aryl hydrocarbon receptor. These new findings expand our understanding and appreciation for the important roles that bacteria play in shaping the bile acid metabolic network.
Overview
AI snapshot
Written from the paper’s full text.
TL;DR
The paper reports that bacterial bile salt hydrolase (BSH) has a previously unknown amine N-acyltransferase activity that conjugates amines to bile acids, forming bacterial bile acid amidates (BBAAs), in addition to its canonical deconjugation role. It links BSH/bsh to BBAA production in bacterial isolates, gnotobiotic mice, and human infants, and shows BBAAs can activate host nuclear receptors in cell and organoid models.
Key findings
- BSH is necessary and sufficient for BBAA formation: the pan-BSH inhibitor GR-7 reduced BBAA production; purified BlBSH synthesized BBAAs from CA or TCA; E. coli expressing BlBSH produced BBAAs; B. fragilis Δbsh eliminated BBAA production from CA/TCA and complementation rescued it.
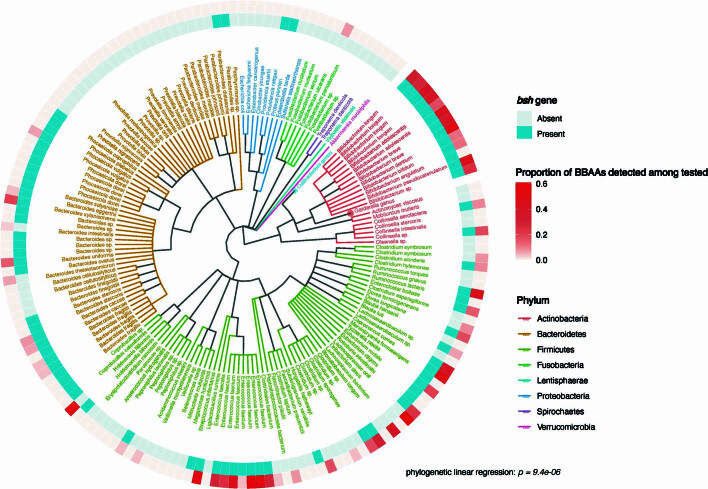
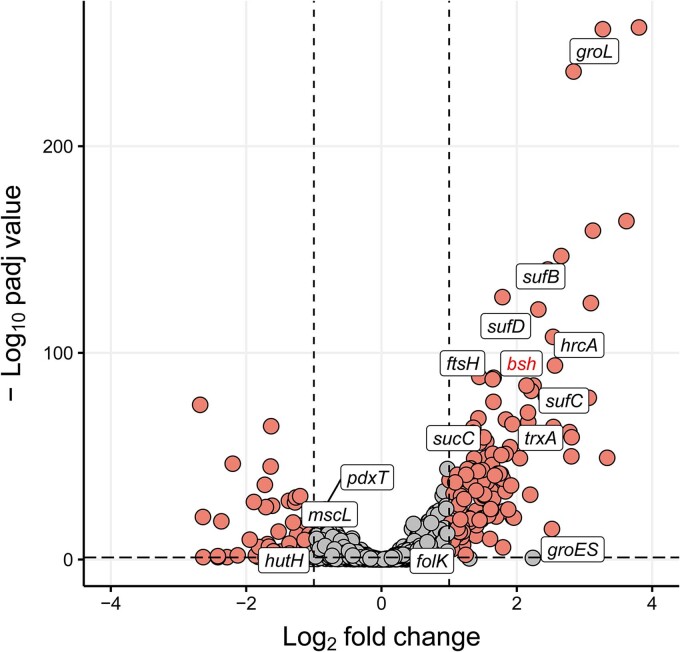
- bsh presence was significantly associated with BBAA production across combined isolate datasets (P = 9.4 × 10⁻⁶, phylogenetic linear regression); in B. longum, bsh was upregulated by CA/DCA (RNA-seq log2FC = 2.14, adjusted P = 6.52 × 10−85; RT-qPCR 2.7-fold, P = 0.0026).
- In germ-free mice monocolonized with B. fragilis WT vs Δbsh, Δbsh-colonized mice had depleted BBAA levels (P = 3.1 × 10⁻⁴) and altered primary bile acids; free caecal taurine was higher in WT-colonized mice (P = 4.27 × 10⁻⁴).
- In a human infant cohort (n = 108), BBAA levels increased from 0–4 days to 12 months; Enterococcus abundance positively correlated with BBAAs, and Bifidobacterium with His/Thr conjugates. BBAAs activated host receptors: Glu-conjugated bile acids activated FXR, CAR3, PXR, AHR and PPARα (P < 0.0001); mouse organoids upregulated Cyp3a11, Cyp1a1 and Bsep, and human organoids upregulated CYP1A1 with 100 µM Glu-CDCA (P < 0.01).
Methods
- Combined LC–MS/MS BBAA data from two published bacterial isolate datasets (202 HMP isolates and 69 representative gut bacteria) with genomes; used phylogenetic linear regression to test bsh–BBAA association; performed RNA-seq and RT-qPCR in B. longum NCTC 11818.
- Used purified BlBSH enzyme assays, heterologous expression and site-directed mutagenesis in E. coli, B. fragilis NCTC 9343 Δbsh and complementation, and germ-free C57BL/6J mice monocolonized with WT or Δbsh B. fragilis (n = 7 WT, n = 8 Δbsh) with LC–MS/MS and 1H NMR.
- Human infant IGRAM cohort stool samples (56 male, 52 female) at birth, 1 month, and 12 months; shotgun metagenomics and LC–MS/MS; cell-based reporter assays for FXR, VDR, CAR3, PXR, AHR, PPARα/β/δ/γ and mouse/human enteroid qPCR.
Limitations
- Stated: the conjugation mechanism is unclear; human organoid responses were less pronounced than mouse; further in vitro and in vivo studies are required to show whether BBAAs affect metabolism of substrates, drugs and carcinogens regulated by PXR and AHR; future studies must re-evaluate BBAA contribution to disease outcomes related to BSH activity.
- Evident from the text: receptor activation evidence is largely cell culture/organoid, not in vivo; human infant findings are observational correlations; mouse work uses monocolonization with one B. fragilis strain, so generalizability to complex microbiota is not established.
Model-written summary. Check it against the paper before relying on it.
Integrity signals
Registry
Cites
Statistics
Figures
Verification
Claims the paper makes
26 Own result · 9 Own method · 9 Own interpretation · 4 Partly supported · 3 Supported · 2 Couldn’t confirm · 2 No full text of the sources · 1 No basis given · accuracy not yet measured
The cited sources support only part of this claim — read each source’s verdict below.
In the paper
“Some BBAAs activate host bile acid nuclear receptors like the farnesoid X receptor (FXR) and pregnane X receptor (PXR)1,3, but an assessment of other receptors has not been completed.”
§ Bile salt hydrolase catalyses formation of amine-conjugated bile acids > Main
What the sources say
- Partly supportedcites [1] Quinn RA Global chemical effects of the microbiome include new bile-acid conjugations Nature 2020 579 123 129 10.1038/s41586-020-2047-9 32103176 PMC7252668 sourceExperimental — accuracy not yet measured
The “Novel Bile Acids and FXR” section reports that phenylalanine- and tyrosine-conjugated bile acids activate human FXR in a cell-based assay. The passages in our copy do not report activation of PXR, so the citation supports the FXR part but not the PXR part. (LLM, conf=0.88)
- Partly supportedcites [3] Gentry, E. C. et al. Reverse metabolomics for the discovery of chemical structures from humans. Nature10.1038/s41586-023-06906-8 (2023). PMC10849969 38052229 sourceExperimental — accuracy not yet measured
The 'Validation of the IBD association' section reports that several conjugated bile acids act as PXR agonists and that two increased PXR activation in intestinal organoids. Our copy does not report that BBAAs activate FXR; FXR appears only in the title of a cited reference, not as a finding of this paper. (LLM, conf=0.88)
plaindirect- Asserted: passes — The authors put it forward as true.
- Checkable: passes — It can be checked against evidence.
- Load-bearing: passes — The paper’s conclusions depend on it.
- Based: passes — The paper gives a reason why it holds.
- Partly supported
The cited sources that could be checked couldn’t confirm or dispute this claim.
In the paper
“As there are hundreds of different BSHs found in microbiota that synthesize different BBAAs3, BSHs may be instrumental in fine tuning different pathways that promote health or disease.”
§ Bile salt hydrolase catalyses formation of amine-conjugated bile acids > Conclusion
What the sources say
- Could not verifycites [3] Gentry, E. C. et al. Reverse metabolomics for the discovery of chemical structures from humans. Nature10.1038/s41586-023-06906-8 (2023). PMC10849969 38052229 sourceExperimental — accuracy not yet measured
The Microbial production of bile amides section reports that bacteria produce some conjugated bile acids, and Validation of the IBD association reports immune activity for several conjugates. But the copy does not say that BSHs synthesize different BBAAs or fine-tune health- or disease-related pathways; searches for “BSH” and “bile salt hydrolase” found only a reference-list entry. (LLM, conf=0.73)
hedgedconditional- Asserted: passes — The authors put it forward as true.
- Checkable: unclear — It is unclear whether it could be checked against evidence.
- Load-bearing: passes — The paper’s conclusions depend on it.
- Based: passes — The paper gives a reason why it holds.
- Could not verify
The cited sources support only part of this claim — read each source’s verdict below.
In the paper
“Bacteria in the gastrointestinal tract produce amino acid bile acid amidates that can affect host-mediated metabolic processes1–6; however, the bacterial gene(s) responsible for their production remain unknown.”
§ Bile salt hydrolase catalyses formation of amine-conjugated bile acids > Abstract
What the sources say
- Supportedcites [1] Quinn RA Global chemical effects of the microbiome include new bile-acid conjugations Nature 2020 579 123 129 10.1038/s41586-020-2047-9 32103176 PMC7252668 source
In “Microbes produce the novel bile acids,” the paper reports that gut bacterium C. bolteae synthesized amino-acid–conjugated bile acids. “Novel Bile Acids and FXR” reports that these conjugates stimulate human FXR in a cell-based system and reduce expression of liver genes involved in bile-acid production when administered to mice. The paper also says the microbial enzyme responsible remains unknown. (LLM, conf=0.93)
- Supportedcites [2] Lucas LN Dominant bacterial phyla from the human gut show widespread ability to transform and conjugate bile acids mSystems 2021 6 e00805 e00821 10.1128/mSystems.00805-21 PMC12338150 34463573 source
The Results and Discussion section reports that gut bacteria conjugate bile acids to amino acids and that certain resulting conjugates can act as FXR agonists. The Introduction identifies FXR as a host receptor involved in regulating metabolic processes. The paper notes that the physiological effects of most other amino-acid conjugates remain unknown. (LLM, conf=0.85)
- Supportedcites [3] Gentry, E. C. et al. Reverse metabolomics for the discovery of chemical structures from humans. Nature10.1038/s41586-023-06906-8 (2023). PMC10849969 38052229 source
The “Microbial production of bile amides” section reports that bacterial cultures produced amino-acid conjugates of bile acids. The “Validation of the IBD association” section reports that several of these conjugates activate the host PXR receptor, which the paper describes as involved in metabolism, and that two increased expression of a downstream target gene (pages not provided). (LLM, conf=0.90)
- Partly supportedcites [4] Hoffmann MA High-confidence structural annotation of metabolites absent from spectral libraries Nat. Biotechnol. 2022 40 411 421 10.1038/s41587-021-01045-9 34650271 PMC8926923 sourceExperimental — accuracy not yet measured
In Results, ‘Searching for novel bile acid conjugates’ (page unavailable), the paper describes amino-acid bile acid conjugates produced by microbes and suggests microbial involvement in producing additional conjugates. It says bile acids act as signaling molecules, but does not establish that the amino-acid conjugates affect host-mediated metabolic processes. (LLM, conf=0.84)
- Partly supportedcites [5] Funabashi M A metabolic pathway for bile acid dehydroxylation by the gut microbiome Nature 2020 582 566 570 10.1038/s41586-020-2396-4 32555455 PMC7319900 sourceExperimental — accuracy not yet measured
The Abstract says gut bacteria produce the secondary bile acids DCA and LCA, which modulate host metabolism. It does not say they produce amino acid bile acid amidates or that those amidates affect host metabolic processes; the paper addresses a different class of bile acid products. (LLM, conf=0.84)
- Partly supportedcites [6] Aatsinki, A.-K. et al. Dynamics of gut metabolome and microbiome maturation during early life. Preprint at medRxiv10.1101/2023.05.29.23290441 (2023). sourceExperimental — accuracy not yet measured
The Introduction (page unavailable) says microbial transformation of bile acids can regulate human physiology, and the Discussion (page unavailable) links bile acids to metabolic processes. Neither passage says gut bacteria produce amino acid bile acid amidates specifically; the Discussion instead describes bacterial deconjugation of glycine from bile acids. (LLM, conf=0.84)
plaindirect- Asserted: passes — The authors put it forward as true.
- Checkable: passes — It can be checked against evidence.
- Load-bearing: passes — The paper’s conclusions depend on it.
- Based: passes — The paper gives a reason why it holds.
- Supported
The cited sources that could be checked couldn’t confirm or dispute this claim.
In the paper
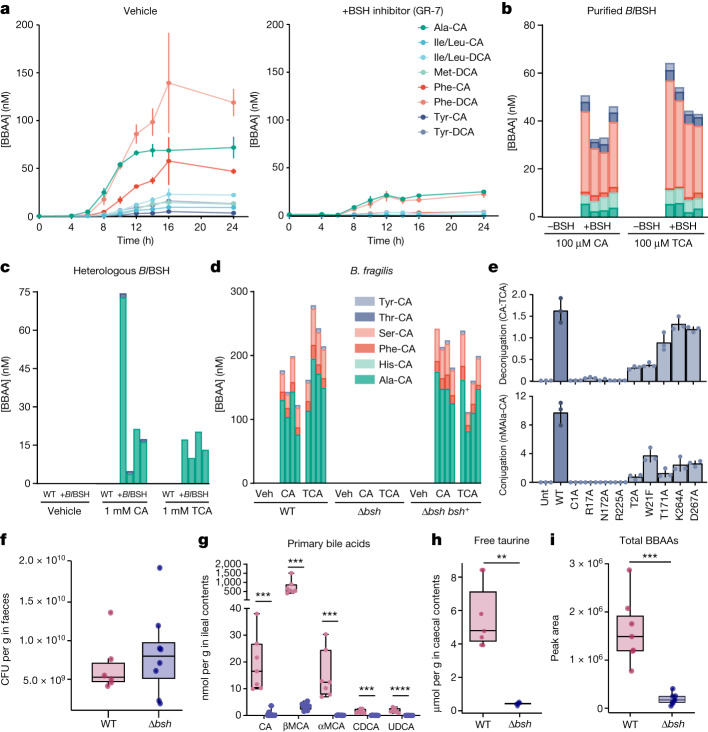
“However, the greater diversity of BBAAs produced by purified BlBSH in vitro (Fig. 2b) compared to BlBSH-expressing E. coli (Fig. 2c) is probably a result of the different amino acid profiles in E. coli (alanine is present at about a 100-fold greater concentration than serine)23.”
§ Bile salt hydrolase catalyses formation of amine-conjugated bile acids > BSH is a bacterial N-acyltransferase
What the sources say
- Could not verifycites [23] Bennett BD Absolute metabolite concentrations and implied enzyme active site occupancy in Escherichia coli Nat. Chem. Biol. 2009 5 593 599 10.1038/nchembio.186 19561621 PMC2754216 sourceExperimental — accuracy not yet measured
The Results and Discussion describe measurements of E. coli metabolite concentrations, but the passages found for “alanine,” “serine,” and their concentration ratio give no values for either amino acid. Our copy therefore does not verify the approximately 100-fold comparison for which this paper is cited. (LLM, conf=0.73)
hedgedconditional- Asserted: passes — The authors put it forward as true.
- Checkable: passes — It can be checked against evidence.
- Load-bearing: unclear — It is unclear whether the paper’s conclusions depend on it.
- Based: passes — The paper gives a reason why it holds.
- Could not verify
Every source the paper cites for this claim was checked and supports it.
In the paper
“Most of the BBAA activators of the human bile acid receptor FXR were conjugates of CDCA (5 of 8, P < 0.0001), probably reflecting the potency of CDCA as an FXR agonist26.”
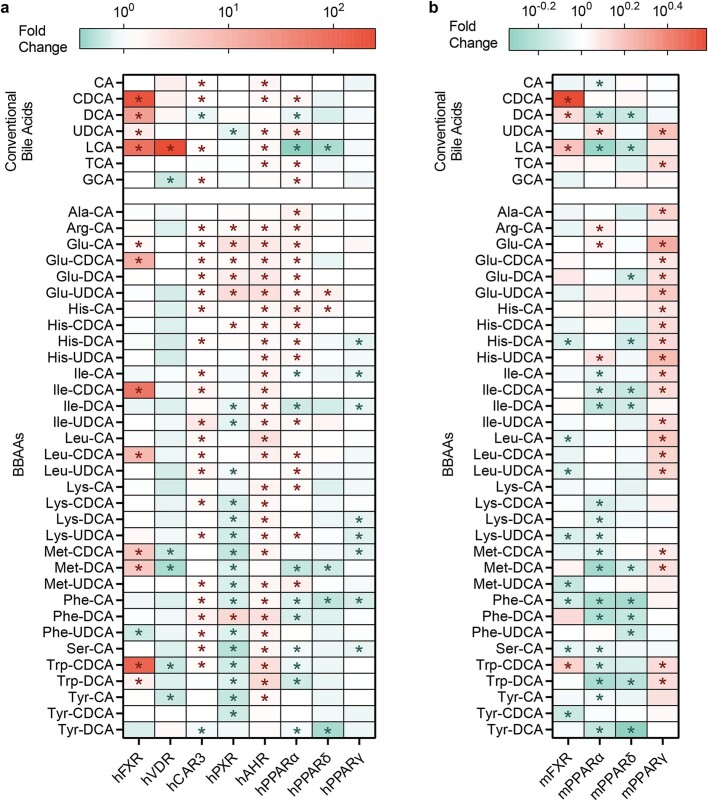
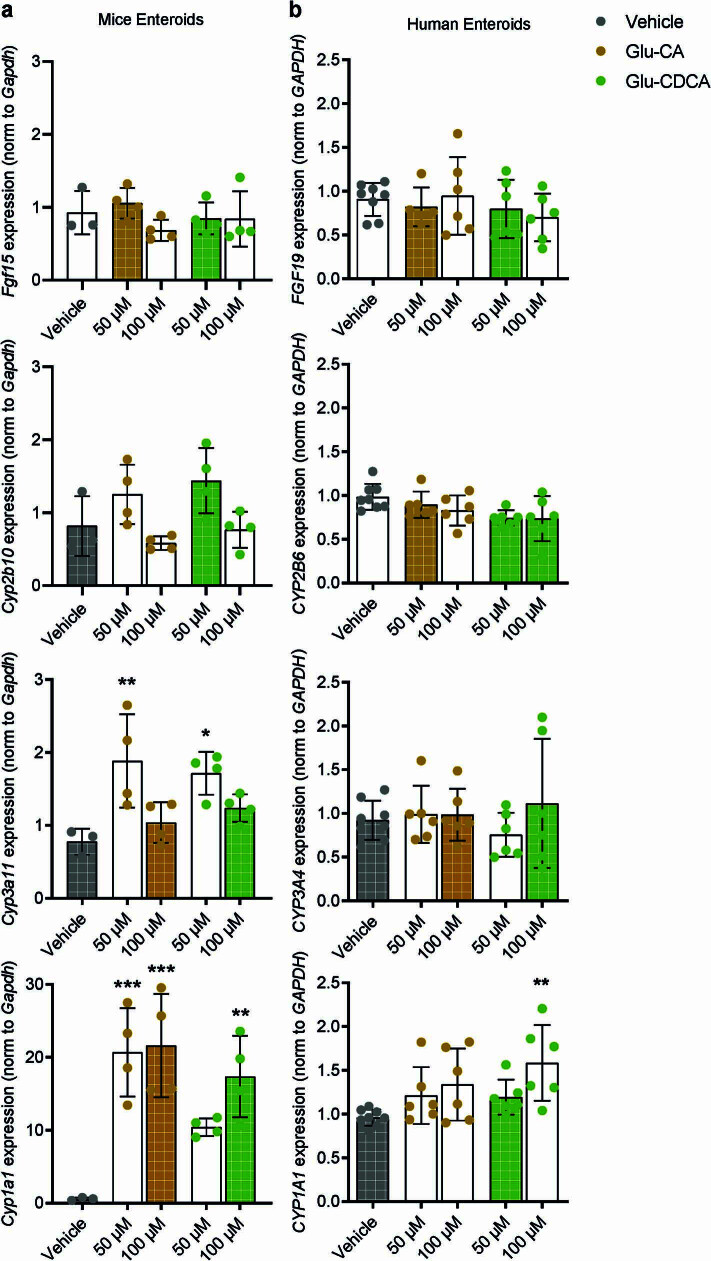
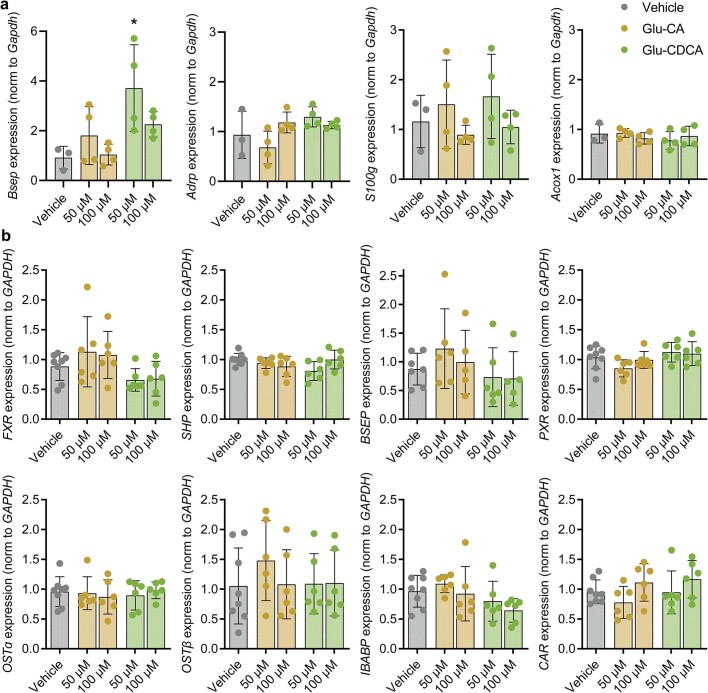
§ Bile salt hydrolase catalyses formation of amine-conjugated bile acids > BBAAs activate host transcription factors To demonstrate potential biological relevance of BSH-mediated BBAA production, we assessed in cell culture models the activation of VDR, CAR3, PXR and AHR in a cell-based reporter assay (Extended Data Fig. 7). Most of the BBAA activators of the human bile acid receptor FXR were conjugates of CDCA (5 of 8, P < 0.0001), probably reflecting the potency of CDCA as an FXR agonist26. Bile acids conjugated with glutamate activated human FXR, CAR3, PXR, AHR and PPARα (P < 0.0001). Therefore, we selected Glu-CA and Glu-CDCA for further exploration in organoid models. We treated organoids cultured from mouse and human small intestinal crypts with 50 µM or 100 µM Glu-CA or Glu-CDCA and measured the expression of FXR, CAR, PXR and AHR target genes. In mouse organoids, Glu-CA and Glu-CDCA upregulated Cyp3a11, Cyp1a1 and Bsep expression, indicating that PXR and AHR were transcriptionally activated (Extended Data Figs. 8a and 9a). Responses in human organoids were less pronounced, but CYP1A1 expression was also upregulated with 100 µM Glu-CDCA treatment (P < 0.01, Extended Data Figs. 8b and 9b). We previously showed that Glu-conjugated bile acids were activators of human PXR in vitro14, and herein, we observed activation of AHR by both bacterially conjugated and conventional bile acids in vitro. Further studies, both in vitro and in vivo, are required to demonstrate whether BBAAs affect the metabolism of substrates, drugs and carcinogens regulated by PXR26 and AHR27.
What the sources say
- Supportedcites [26] Li T Chiang JYL Nuclear receptors in bile acid metabolism Drug Metab. Rev. 2013 45 145 155 10.3109/03602532.2012.740048 23330546 PMC3676171 source
The citation is attached to the explanation that CDCA is a strong FXR agonist, not to the citing paper’s 5-of-8 count or P value. The “Bile-acid–activated nuclear receptors” section says CDCA is the most efficacious FXR ligand among bile acids and gives its EC50 as approximately 10 μM. (LLM, conf=0.90)
hedgedcorrelational- Asserted: passes — The authors put it forward as true.
- Checkable: passes — It can be checked against evidence.
- Load-bearing: unclear — It is unclear whether the paper’s conclusions depend on it.
- Based: passes — The paper gives a reason why it holds.
- Supported
A result the paper reports from its own data — it cites no other source for it, so there is none to check. The quote shows it is in the paper.
In the paper
“Lastly, we report that in cell culture models, BBAAs activate host ligand-activated transcription factors including the pregnane X receptor and the aryl hydrocarbon receptor.”
§ Bile salt hydrolase catalyses formation of amine-conjugated bile acids > Abstract
plaindirect- Asserted: passes — The authors put it forward as true.
- Checkable: passes — It can be checked against evidence.
- Load-bearing: passes — The paper’s conclusions depend on it.
- Based: passes — The paper gives a reason why it holds.
A result the paper reports from its own data — it cites no other source for it, so there is none to check. The quote shows it is in the paper.
In the paper
“We further show in a human infant cohort that BBAA production is positively correlated with the colonization of bsh-expressing bacteria.”
§ Bile salt hydrolase catalyses formation of amine-conjugated bile acids > Abstract
plaincorrelational- Asserted: passes — The authors put it forward as true.
- Checkable: passes — It can be checked against evidence.
- Load-bearing: passes — The paper’s conclusions depend on it.
- Based: passes — The paper gives a reason why it holds.
A result the paper reports from its own data — it cites no other source for it, so there is none to check. The quote shows it is in the paper.
In the paper
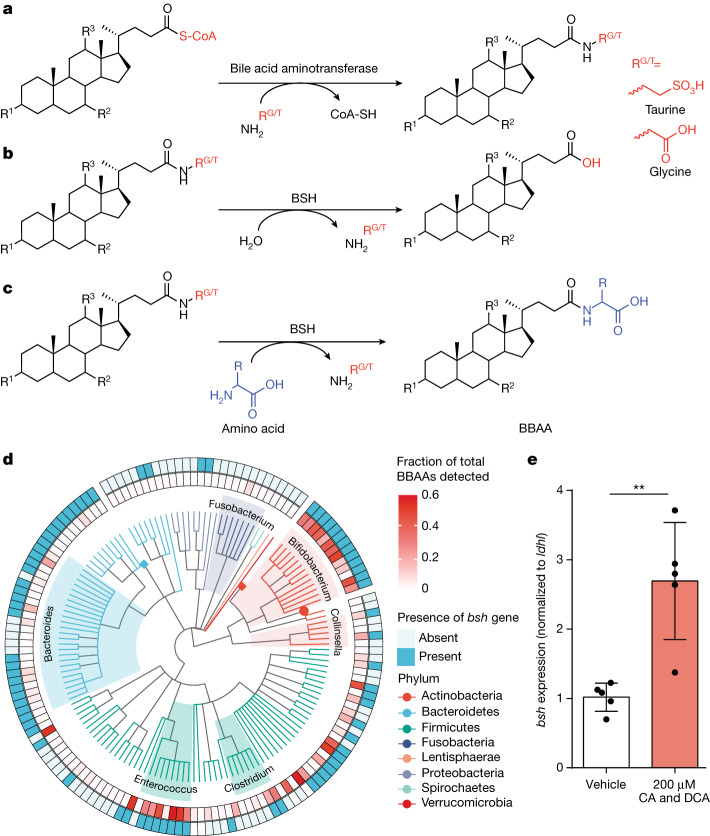
“Global transcriptional profiling identified 1,929 genes, of which 89 were differentially expressed (adjusted P ≤ 0.05 and log2FC ≤ −1.5 or ≥ 1.5), including bsh, which was significantly upregulated (log2FC = 2.14, adjusted P = 6.52 × 10−85) (Extended Data Fig. 2 and Supplementary Table 1).”
- Also stated in: another passage · plain
“We also validated the RNA sequencing results with quantitative reverse transcription polymerase chain reaction (RT-qPCR), confirming that bsh messenger RNA was increased 2.7-fold (P = 0.0026) (Fig. 1e).”
§ Bile salt hydrolase catalyses formation of amine-conjugated bile acids > BSH correlates with BBAA production
plaindirect- Asserted: passes — The authors put it forward as true.
- Checkable: passes — It can be checked against evidence.
- Load-bearing: passes — The paper’s conclusions depend on it.
- Based: passes — The paper gives a reason why it holds.
- Also stated in: another passage · plain
A result the paper reports from its own data — it cites no other source for it, so there is none to check. The quote shows it is in the paper.
In the paper
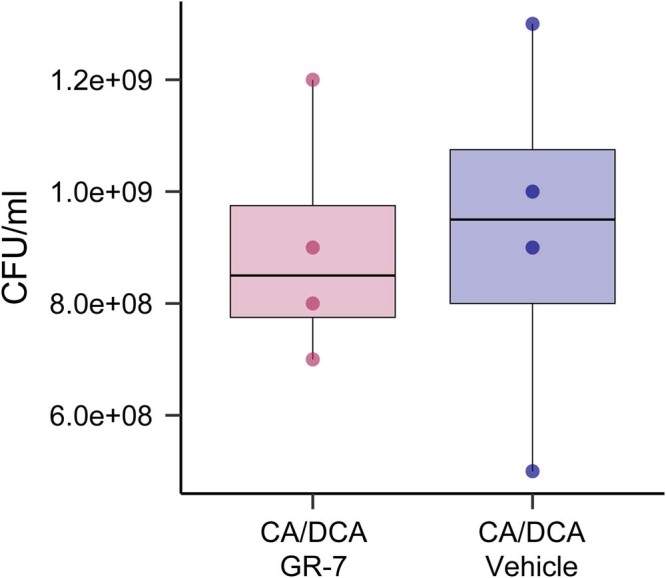
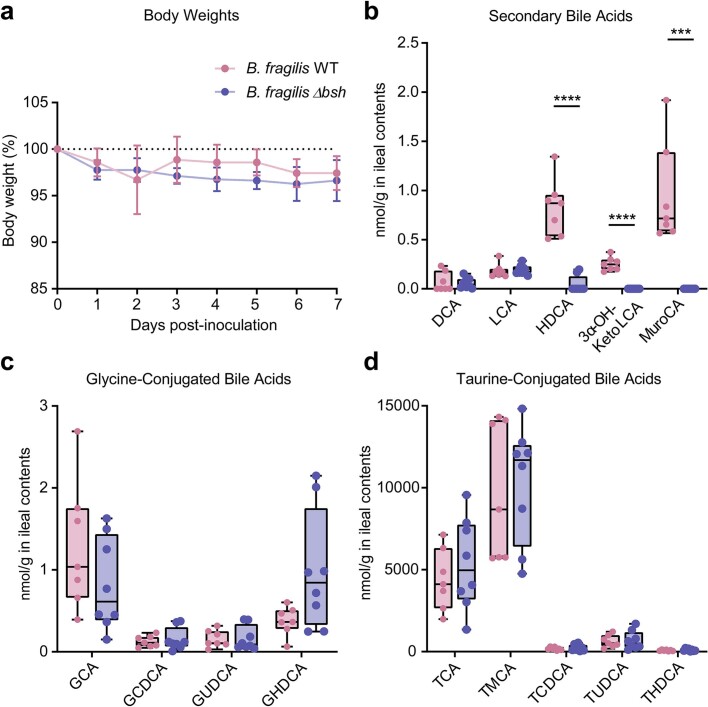
“Both strains equally colonized the mouse gastrointestinal tract seven days after gavage (Fig. 2f), and there was no change in body weight between the groups (Extended Data Fig. 5).”
§ Bile salt hydrolase catalyses formation of amine-conjugated bile acids > BSH is a bacterial N-acyltransferase
plain- Asserted: passes — The authors put it forward as true.
- Checkable: passes — It can be checked against evidence.
- Load-bearing: passes — The paper’s conclusions depend on it.
- Based: passes — The paper gives a reason why it holds.
A result the paper reports from its own data — it cites no other source for it, so there is none to check. The quote shows it is in the paper.
In the paper
“Responses in human organoids were less pronounced, but CYP1A1 expression was also upregulated with 100 µM Glu-CDCA treatment (P < 0.01, Extended Data Figs. 8b and 9b).”
§ Bile salt hydrolase catalyses formation of amine-conjugated bile acids > BBAAs activate host transcription factors To demonstrate potential biological relevance of BSH-mediated BBAA production, we assessed in cell culture models the activation of VDR, CAR3, PXR and AHR in a cell-based reporter assay (Extended Data Fig. 7). Most of the BBAA activators of the human bile acid receptor FXR were conjugates of CDCA (5 of 8, P < 0.0001), probably reflecting the potency of CDCA as an FXR agonist26. Bile acids conjugated with glutamate activated human FXR, CAR3, PXR, AHR and PPARα (P < 0.0001). Therefore, we selected Glu-CA and Glu-CDCA for further exploration in organoid models. We treated organoids cultured from mouse and human small intestinal crypts with 50 µM or 100 µM Glu-CA or Glu-CDCA and measured the expression of FXR, CAR, PXR and AHR target genes. In mouse organoids, Glu-CA and Glu-CDCA upregulated Cyp3a11, Cyp1a1 and Bsep expression, indicating that PXR and AHR were transcriptionally activated (Extended Data Figs. 8a and 9a). Responses in human organoids were less pronounced, but CYP1A1 expression was also upregulated with 100 µM Glu-CDCA treatment (P < 0.01, Extended Data Figs. 8b and 9b). We previously showed that Glu-conjugated bile acids were activators of human PXR in vitro14, and herein, we observed activation of AHR by both bacterially conjugated and conventional bile acids in vitro. Further studies, both in vitro and in vivo, are required to demonstrate whether BBAAs affect the metabolism of substrates, drugs and carcinogens regulated by PXR26 and AHR27.
plaindirect- Asserted: passes — The authors put it forward as true.
- Checkable: passes — It can be checked against evidence.
- Load-bearing: passes — The paper’s conclusions depend on it.
- Based: passes — The paper gives a reason why it holds.
- Probably not a substantial claim. 13
- It may state two separate claims as one. 12
Every source the paper cites for this claim was checked and supports it.
In the paper
“Furthermore, bacterial bile acid amidates (BBAAs) are abundant in the gastrointestinal tract18 and have been associated with human inflammatory bowel disease3.”
§ Bile salt hydrolase catalyses formation of amine-conjugated bile acids > Main
What the sources say
- Supportedcites [18] Shalon D Profiling the human intestinal environment under physiological conditions Nature 2023 617 581 591 10.1038/s41586-023-05989-7 37165188 PMC10191855 source
The citation to this paper is attached to the claim that bacterial bile acid amidates are abundant in the gastrointestinal tract. In “Amino acid-specific bile acid conjugation,” the paper reports detecting 22 microbially conjugated bile acids in intestinal samples from all participants, at significantly higher concentrations than in stool. The IBD association is attached to a different citation. (LLM, conf=0.90)
- Supportedcites [3] Gentry, E. C. et al. Reverse metabolomics for the discovery of chemical structures from humans. Nature10.1038/s41586-023-06906-8 (2023). PMC10849969 38052229 source
Citation 3 is attached to the association with human inflammatory bowel disease, not the separate claim about gastrointestinal abundance. The paper’s “Validation of the IBD association” section reports higher abundance of several bile acid amidates in patients with Crohn’s disease than in individuals without IBD. (LLM, conf=0.93)
plaincorrelational- Asserted: passes — The authors put it forward as true.
- Checkable: passes — It can be checked against evidence.
- Load-bearing: fails — The paper’s conclusions may not depend on it.
- Based: passes — The paper gives a reason why it holds.
Probably not a substantial claim. The paper’s conclusions may not depend on it. It may state two separate claims as one.
- Supported
Every source the paper cites for this claim was checked and supports it.
In the paper
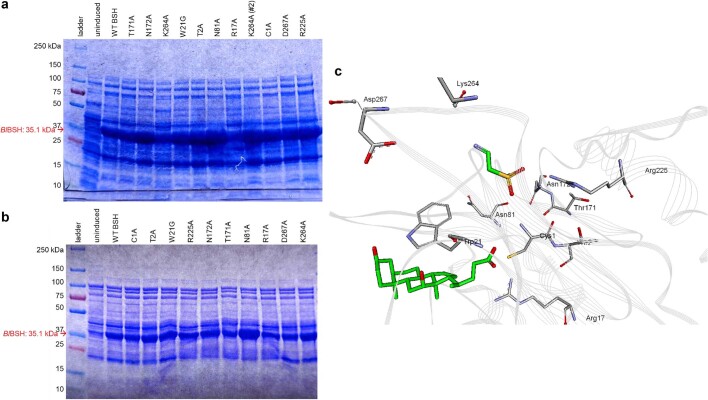
“the terminal cysteine Cys1 of BlBSH is predicted to be the primary catalytic residue, although other active site residues (for example, Thr2, Trp21, Thr171, Asn172 and Arg225) may also be important for BSH activity or substrate specificity24.”
§ Bile salt hydrolase catalyses formation of amine-conjugated bile acids > BSH is a bacterial N-acyltransferase
What the sources say
- Supportedcites [24] Kumar RS Structural and functional analysis of a conjugated bile salt hydrolase from Bifidobacterium longum reveals an evolutionary relationship with penicillin V acylase J. Biol. Chem. 2006 281 32516 32525 10.1074/jbc.M604172200 16905539 source
The Results identify Cys1 as catalytic: replacing it with alanine made BlBSH completely inactive. The same section describes Trp21, Thr171, Asn172 and Arg225 as putatively important residues near Cys1; it also reports reduced catalytic activity for the T2A mutant and suggests Trp21 has a selective role in substrate binding. (LLM, conf=0.94)
hedgedconditional- Asserted: passes — The authors put it forward as true.
- Checkable: passes — It can be checked against evidence.
- Load-bearing: passes — The paper’s conclusions depend on it.
- Based: passes — The paper gives a reason why it holds.
It may state two separate claims as one.
- Supported
The cited sources support only part of this claim — read each source’s verdict below.
In the paper
“The enzymes responsible for these conjugation reactions are unknown.”
§ Bile salt hydrolase catalyses formation of amine-conjugated bile acids > Main
What the sources say
- Supportedcites [1] Quinn RA Global chemical effects of the microbiome include new bile-acid conjugations Nature 2020 579 123 129 10.1038/s41586-020-2047-9 32103176 PMC7252668 source
In the Main section, under “Novel Bile Acids and FXR,” the paper identifies microbial amide conjugation with phenylalanine, tyrosine and leucine, then states that the microbial enzyme responsible remains unknown. No page number is provided in our copy. (LLM, conf=0.95)
- Supportedcites [2] Lucas LN Dominant bacterial phyla from the human gut show widespread ability to transform and conjugate bile acids mSystems 2021 6 e00805 e00821 10.1128/mSystems.00805-21 PMC12338150 34463573 source
In Results and Discussion, under “Amino acid conjugation of bile acids by gut bacteria,” the paper explicitly says the enzymes responsible for amino acid conjugation are currently unknown. It notes that microbial BSH may participate in glycine conjugation, but this is presented as a possibility, not an identified mechanism. (LLM, conf=0.94)
- Could not verifycites [3] Gentry, E. C. et al. Reverse metabolomics for the discovery of chemical structures from humans. Nature10.1038/s41586-023-06906-8 (2023). PMC10849969 38052229 sourceExperimental — accuracy not yet measured
The “Microbial production of bile amides” section (page unavailable) identifies bacteria that produce amino-acid-conjugated bile acids, but does not say whether the enzymes responsible are known. Searches for “enzymes,” “unknown enzymatic mechanism,” and genes encoding conjugation enzymes found no passage addressing enzyme identity. (LLM, conf=0.72)
- Could not verifycites [4] Hoffmann MA High-confidence structural annotation of metabolites absent from spectral libraries Nat. Biotechnol. 2022 40 411 421 10.1038/s41587-021-01045-9 34650271 PMC8926923 sourceExperimental — accuracy not yet measured
The Results section, “Searching for novel bile acid conjugates” (page unavailable), describes amino acid–bile acid conjugates and suggests microbial involvement in their production. It does not address whether the enzymes responsible for the conjugation reactions are known; searches for the enzyme claim and related terms found no such statement. (LLM, conf=0.75)
- Could not verifycites [6] Aatsinki, A.-K. et al. Dynamics of gut metabolome and microbiome maturation during early life. Preprint at medRxiv10.1101/2023.05.29.23290441 (2023). sourceExperimental — accuracy not yet measured
The Discussion (page unavailable) describes bile salt hydrolase enzymes that deconjugate bile acids, not enzymes that produce amino acid bile acid amidates. Searches for the claimed unknown conjugation enzymes and for amino acid bile acid amidates found no passage in our copy addressing whether those enzymes are known. (LLM, conf=0.75)
- Could not verifycites [17] Wang M Mass spectrometry searches using MASST Nat. Biotechnol. 2020 38 23 26 10.1038/s41587-019-0375-9 31894142 PMC7236533 sourceExperimental — accuracy not yet measured
The paper’s main text describes MASST as a tool for searching mass-spectrometry data; it does not address which enzymes produce amino acid bile acid amidates. Searches for the conjugation reactions, bile acids, and their bacterial enzymes found no relevant passage in our copy. (LLM, conf=0.76)
plain- Asserted: passes — The authors put it forward as true.
- Checkable: passes — It can be checked against evidence.
- Load-bearing: passes — The paper’s conclusions depend on it.
- Based: passes — The paper gives a reason why it holds.
Probably not a substantial claim.
- Supported
The cited sources support only part of this claim — read each source’s verdict below.
In the paper
“Recent studies demonstrated that bacteria, in addition to the host, have bile acid amine N-acyltransferase activity, with dozens of bacterially conjugated amino acid amidates identified1–4,6,17.”
§ Bile salt hydrolase catalyses formation of amine-conjugated bile acids > Main
What the sources say
- Partly supportedcites [1] Quinn RA Global chemical effects of the microbiome include new bile-acid conjugations Nature 2020 579 123 129 10.1038/s41586-020-2047-9 32103176 PMC7252668 sourceExperimental — accuracy not yet measured
In “Microbes produce the novel bile acids” (page unavailable), the paper reports that C. bolteae synthesized amino-acid-conjugated bile acids, supporting bacterial conjugation activity. In “Discovery of new conjugated bile acids” (page unavailable), it identifies three such amidates—phenylalanine, tyrosine, and leucine conjugates—not dozens. The cited paper therefore supports the bacterial activity but not the stated number of identified amidates. (LLM, conf=0.88)
- Supportedcites [2] Lucas LN Dominant bacterial phyla from the human gut show widespread ability to transform and conjugate bile acids mSystems 2021 6 e00805 e00821 10.1128/mSystems.00805-21 PMC12338150 34463573 source
In Results and Discussion, under “Amino acid conjugation of bile acids by gut bacteria” (page not provided), the paper reports that bacterial isolates conjugated bile acids to amino acids and identifies 44 novel conjugates. This supports the claimed bacterial conjugation activity and the identification of dozens of amino acid–bile acid amidates; the paper notes that the responsible enzymes remain unknown. (LLM, conf=0.90)
- Partly supportedcites [3] Gentry, E. C. et al. Reverse metabolomics for the discovery of chemical structures from humans. Nature10.1038/s41586-023-06906-8 (2023). PMC10849969 38052229 sourceExperimental — accuracy not yet measured
The ‘Microbial production of bile amides’ section (page not provided) reports that bacterial cultures produced cholic- and deoxycholic-acid amidates for 15 amino acids, supporting bacterial production of dozens of amino-acid bile amidates. It does not identify or measure bacterial bile acid amine N-acyltransferase activity specifically; it establishes conjugation from the products detected in culture. (LLM, conf=0.83)
- Partly supportedcites [4] Hoffmann MA High-confidence structural annotation of metabolites absent from spectral libraries Nat. Biotechnol. 2022 40 411 421 10.1038/s41587-021-01045-9 34650271 PMC8926923 sourceExperimental — accuracy not yet measured
The Results section (‘Searching for novel bile acid conjugates’; page not provided) reports amino-acid-conjugated bile acids, including 12 leading novel annotations, and a matching spectrum in a bacterial culture. It says microbial involvement in producing the 12 is suggested, not demonstrated; it does not establish bacterial bile acid amine N-acyltransferase activity or the identification of dozens of bacterially conjugated amidates. (LLM, conf=0.86)
- Could not verifycites [6] Aatsinki, A.-K. et al. Dynamics of gut metabolome and microbiome maturation during early life. Preprint at medRxiv10.1101/2023.05.29.23290441 (2023). sourceExperimental — accuracy not yet measured
The Discussion describes bacterial bile acid metabolism, particularly bile salt hydrolase activity and deconjugation, but does not address bacterial bile acid amine N-acyltransferase activity. A search for bacterial conjugation and amino acid amidates found no passage reporting the identification of dozens of such compounds. The supplied passages have no page numbers. (LLM, conf=0.74)
- Could not verifycites [17] Wang M Mass spectrometry searches using MASST Nat. Biotechnol. 2020 38 23 26 10.1038/s41587-019-0375-9 31894142 PMC7236533 sourceExperimental — accuracy not yet measured
The main text describes MASST searches of public mass-spectrometry data, not bacterial bile-acid conjugation. Searches for bile acids, amine N-acyltransferase activity, and amino-acid amidates found no passage addressing the claimed activity or the identification of dozens of amidates. (LLM, conf=0.75)
boosteddirect- Asserted: passes — The authors put it forward as true.
- Checkable: passes — It can be checked against evidence.
- Load-bearing: passes — The paper’s conclusions depend on it.
- Based: passes — The paper gives a reason why it holds.
It may state two separate claims as one.
- Partly supported
A result the paper reports from its own data — it cites no other source for it, so there is none to check. The quote shows it is in the paper.
In the paper
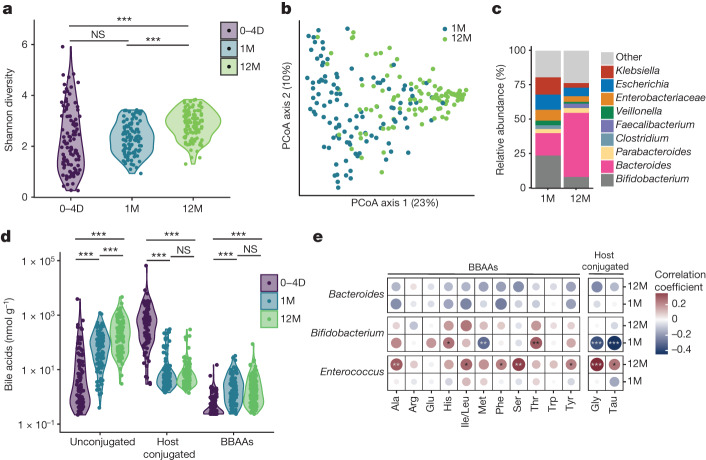
“Bifidobacterium abundance was negatively correlated with host-conjugated bile acids in one-month-old infants and positively correlated with bile acid conjugates of His and Thr (Fig. 3e).”
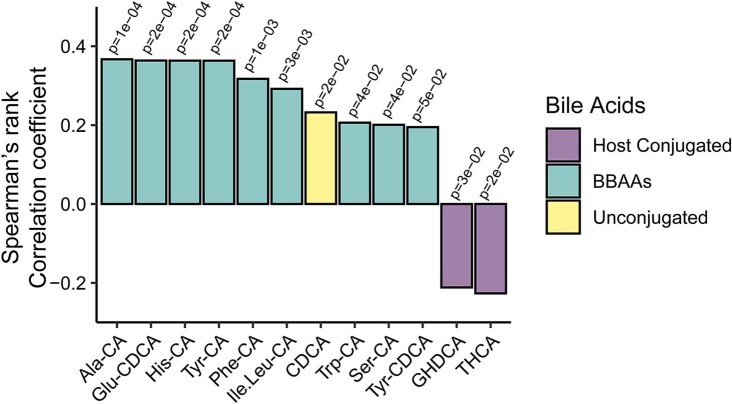
§ Bile salt hydrolase catalyses formation of amine-conjugated bile acids > BBAA levels coincide with microbiota development During the first year of life, the gut microbiota undergoes rapid expansion and maturation. To understand the biological relevance of BBAAs, we quantified bile acids including BBAAs from the stool of infants followed from birth to 12 months25. Metagenomic sequencing showed an increase in microbial diversity, measured by the Shannon Index, from birth through 12 months (Fig. 3a). Variation in sample diversity between 0 and 4 days is probably due to the rapid maturation of the gut microbiota. Principal coordinates analysis of Bray–Curtis dissimilarity supports the differences in beta-diversity between one-month- and 12-month-old infants (Fig. 3b, permutational multivariate analysis of variance (PERMANOVA) P = 0.001). The Bacteroides population expanded from one to 12 months, whereas the relative abundance of Bifidobacterium was reduced (Fig. 3c). As the microbiota evolved with age, we observed a shift from host-conjugated to unconjugated primary bile acids due to the colonization of bsh-positive bacteria (Fig. 3d). The levels of BBAAs also increased from 0–4 days to 12 months after birth (Fig. 3d). Further stratifying the samples collected at 0–4 days, the levels of several BBAAs (Ala-CA, Glu-CDCA, Tyr-CA, His-CA, Ile/leu-CA, Trp-CA, Ser-CA and Tyr-CDCA) were positively correlated with the hours elapsed after birth (Extended Data Fig. 6). We correlated the abundance of Bacteroides, Bifidobacterium and Enterococcus with levels of host-conjugated (Gly and Tau) bile acids and BBAAs. Bacteroides abundance was not correlated with BBAA production. In 12-month-old infants, Enterococcus abundance was positively correlated with host-conjugated bile acids and BBAAs including Ala, Ile/Leu, Phe, Ser and Tyr (Fig. 3e). Bifidobacterium abundance was negatively correlated with host-conjugated bile acids in one-month-old infants and positively correlated with bile acid conjugates of His and Thr (Fig. 3e). These data support our findings that BSHs from Bifidobacterium species are amine N-acyltransferases that produce BBAAs in humans. To our knowledge, this is the first demonstration connecting BBAA production with BSH-expressing bacteria during human infant development.
plaincorrelational- Asserted: passes — The authors put it forward as true.
- Checkable: passes — It can be checked against evidence.
- Load-bearing: passes — The paper’s conclusions depend on it.
- Based: passes — The paper gives a reason why it holds.
It may state two separate claims as one.
A result the paper reports from its own data — it cites no other source for it, so there is none to check. The quote shows it is in the paper.
In the paper
“Next, we purified BlBSH and assayed for BBAA production from 100 μM CA or TCA and a 250 μM equimolar mixture of amino acids. Both CA and TCA treatment yielded BBAAs, but not all amino acids were conjugated, demonstrating substrate selectivity by BSH.”
§ Bile salt hydrolase catalyses formation of amine-conjugated bile acids > BSH is a bacterial N-acyltransferase
boosteddirect- Asserted: passes — The authors put it forward as true.
- Checkable: passes — It can be checked against evidence.
- Load-bearing: passes — The paper’s conclusions depend on it.
- Based: passes — The paper gives a reason why it holds.
It may state two separate claims as one.
A result the paper reports from its own data — it cites no other source for it, so there is none to check. The quote shows it is in the paper.
In the paper
“The Bacteroides population expanded from one to 12 months, whereas the relative abundance of Bifidobacterium was reduced (Fig. 3c).”
§ Bile salt hydrolase catalyses formation of amine-conjugated bile acids > BBAA levels coincide with microbiota development During the first year of life, the gut microbiota undergoes rapid expansion and maturation. To understand the biological relevance of BBAAs, we quantified bile acids including BBAAs from the stool of infants followed from birth to 12 months25. Metagenomic sequencing showed an increase in microbial diversity, measured by the Shannon Index, from birth through 12 months (Fig. 3a). Variation in sample diversity between 0 and 4 days is probably due to the rapid maturation of the gut microbiota. Principal coordinates analysis of Bray–Curtis dissimilarity supports the differences in beta-diversity between one-month- and 12-month-old infants (Fig. 3b, permutational multivariate analysis of variance (PERMANOVA) P = 0.001). The Bacteroides population expanded from one to 12 months, whereas the relative abundance of Bifidobacterium was reduced (Fig. 3c). As the microbiota evolved with age, we observed a shift from host-conjugated to unconjugated primary bile acids due to the colonization of bsh-positive bacteria (Fig. 3d). The levels of BBAAs also increased from 0–4 days to 12 months after birth (Fig. 3d). Further stratifying the samples collected at 0–4 days, the levels of several BBAAs (Ala-CA, Glu-CDCA, Tyr-CA, His-CA, Ile/leu-CA, Trp-CA, Ser-CA and Tyr-CDCA) were positively correlated with the hours elapsed after birth (Extended Data Fig. 6). We correlated the abundance of Bacteroides, Bifidobacterium and Enterococcus with levels of host-conjugated (Gly and Tau) bile acids and BBAAs. Bacteroides abundance was not correlated with BBAA production. In 12-month-old infants, Enterococcus abundance was positively correlated with host-conjugated bile acids and BBAAs including Ala, Ile/Leu, Phe, Ser and Tyr (Fig. 3e). Bifidobacterium abundance was negatively correlated with host-conjugated bile acids in one-month-old infants and positively correlated with bile acid conjugates of His and Thr (Fig. 3e). These data support our findings that BSHs from Bifidobacterium species are amine N-acyltransferases that produce BBAAs in humans. To our knowledge, this is the first demonstration connecting BBAA production with BSH-expressing bacteria during human infant development.
plaindirect- Asserted: passes — The authors put it forward as true.
- Checkable: passes — It can be checked against evidence.
- Load-bearing: unclear — It is unclear whether the paper’s conclusions depend on it.
- Based: passes — The paper gives a reason why it holds.
It may state two separate claims as one.
A result the paper reports from its own data — it cites no other source for it, so there is none to check. The quote shows it is in the paper.
In the paper
“The bile acid pool of Δbsh-colonized mice reflected a perturbation in bile acid hydrolysis, as the release of unconjugated primary bile acids was reduced and the production of BBAAs attenuated (Fig. 2g,i).”
- Also stated in: another passage · boosted
“Importantly, we demonstrate that colonization with wild-type B. fragilis is key to the production of BBAAs, as BBAA levels are significantly depleted in Δbsh-colonized mice (Fig. 2i).”
§ Bile salt hydrolase catalyses formation of amine-conjugated bile acids > BSH is a bacterial N-acyltransferase
boosteddirect- Asserted: passes — The authors put it forward as true.
- Checkable: passes — It can be checked against evidence.
- Load-bearing: passes — The paper’s conclusions depend on it.
- Based: passes — The paper gives a reason why it holds.
It may state two separate claims as one.
- Also stated in: another passage · boosted
A result the paper reports from its own data — it cites no other source for it, so there is none to check. The quote shows it is in the paper.
In the paper
“Heterologous expression of the enzyme in E. coli, which lacks endogenous bsh, confers amine N-acyltransferase activity. Incubation of the E. coli-BlBSH with 1 mM CA or 1 mM TCA produced BBAAs, whereas the untransformed E. coli did not produce BBAAs (Fig. 2c).”
§ Bile salt hydrolase catalyses formation of amine-conjugated bile acids > BSH is a bacterial N-acyltransferase
plaindirect- Asserted: passes — The authors put it forward as true.
- Checkable: passes — It can be checked against evidence.
- Load-bearing: passes — The paper’s conclusions depend on it.
- Based: passes — The paper gives a reason why it holds.
It may state two separate claims as one.
- Rests on an assumption: E. coli lacks endogenous bsh.
A result the paper reports from its own data — it cites no other source for it, so there is none to check. The quote shows it is in the paper.
In the paper
“Deletion of bsh eliminated the production of BBAAs from both CA and TCA, whereas complementation rescued BBAA production (Fig. 2d).”
§ Bile salt hydrolase catalyses formation of amine-conjugated bile acids > BSH is a bacterial N-acyltransferase
plaindirect- Asserted: passes — The authors put it forward as true.
- Checkable: passes — It can be checked against evidence.
- Load-bearing: passes — The paper’s conclusions depend on it.
- Based: passes — The paper gives a reason why it holds.
It may state two separate claims as one.
A result the paper reports from its own data — it cites no other source for it, so there is none to check. The quote shows it is in the paper.
In the paper
“We performed site-directed mutagenesis on nine residues proximal to the active site of BlBSH to identify which are necessary for N-acyltransferase activity in BSH (Fig. 2e). The N-acyltransferase activity of BSH closely mirrored the deconjugation activity with each mutation, with C1A, R17A, N172A and R225A all being essential for its function.”
§ Bile salt hydrolase catalyses formation of amine-conjugated bile acids > BSH is a bacterial N-acyltransferase
plaindirect- Asserted: passes — The authors put it forward as true.
- Checkable: passes — It can be checked against evidence.
- Load-bearing: passes — The paper’s conclusions depend on it.
- Based: passes — The paper gives a reason why it holds.
It may state two separate claims as one.
The paper states this without a source or data behind it here, so there is nothing to check it against. The quote shows it is in the paper.
In the paper
“The new construct, pER363, contains a deletion of 765 bp DNA fragment from the bsh gene.”
§ Bile salt hydrolase catalyses formation of amine-conjugated bile acids > Methods > Construction of B. fragilis NCTC 9343 Δbsh mutant A 1,797 bp DNA fragment containing the N-terminal region of the BSH gene was PCR amplified from the B. fragilis NCTC 9343 using primers BSH-NT-FOR and BSH-NT-REV. The N-terminal fragment was cloned into the SphI/BamHI sites of the pFD516 vector. Then a 1,734 bp DNA fragment containing the C-terminal region was PCR amplified with primers BSH-CT-FOR and BSH-CT-REV2 and cloned into the SacI site of pFD516. The new construct, pER363, contains a deletion of 765 bp DNA fragment from the bsh gene. A 3,533 bp BglII/SalI DNA fragment from pER363 containing the Δbsh construct was cloned into the BamHI/SalI sites of the suicide vector for allelic replacement in Bacteroides, pLGB13 to construct pER-366. pER-366 was mobilized from E. coli S17-1 λpir into B. fragilis NCTC 9343 by biparental mating as described previously. Transconjugants were selected on brain–heart infusion supplemented (BHIS) plus 0.5% yeast extract plates containing 200 μg ml−1 gentamycin and 10 μg ml−1 erythromycin. Four transconjugant colonies were grown overnight on BHIS broth with 200 μg ml−1 gentamycin (erythromycin was omitted). Then 10 μl of an overnight culture was spread on BHIS with 0.5% yeast extract plates containing 200 μg ml−1 gentamycin and 100 ng ml−1 anhydrotetracycline. Transconjugant colonies were streaked on fresh BHIS with 0.5% yeast extract plates containing 200 μg ml−1 gentamycin and 100 ng ml−1 anhydrotetracycline. PCR amplification using BSH-mutcheck-FOR and BSH-mutcheck-REV primers was used to identify chromosomal double-crossed over genetic recombination. The B. fragilis NCTC 9343 Δbsh mutant isolates (BER-279) were also tested for loss of erythromycin resistance and respiratory test.
plain- Asserted: passes — The authors put it forward as true.
- Checkable: passes — It can be checked against evidence.
- Load-bearing: passes — The paper’s conclusions depend on it.
- Based: passes — The paper gives a reason why it holds.
Probably not a substantial claim.
A conclusion the paper draws from its own results — it cites no other source for it, so there is none to check. The quote shows it is in the paper.
In the paper
“Variation in sample diversity between 0 and 4 days is probably due to the rapid maturation of the gut microbiota.”
§ Bile salt hydrolase catalyses formation of amine-conjugated bile acids > BBAA levels coincide with microbiota development During the first year of life, the gut microbiota undergoes rapid expansion and maturation. To understand the biological relevance of BBAAs, we quantified bile acids including BBAAs from the stool of infants followed from birth to 12 months25. Metagenomic sequencing showed an increase in microbial diversity, measured by the Shannon Index, from birth through 12 months (Fig. 3a). Variation in sample diversity between 0 and 4 days is probably due to the rapid maturation of the gut microbiota. Principal coordinates analysis of Bray–Curtis dissimilarity supports the differences in beta-diversity between one-month- and 12-month-old infants (Fig. 3b, permutational multivariate analysis of variance (PERMANOVA) P = 0.001). The Bacteroides population expanded from one to 12 months, whereas the relative abundance of Bifidobacterium was reduced (Fig. 3c). As the microbiota evolved with age, we observed a shift from host-conjugated to unconjugated primary bile acids due to the colonization of bsh-positive bacteria (Fig. 3d). The levels of BBAAs also increased from 0–4 days to 12 months after birth (Fig. 3d). Further stratifying the samples collected at 0–4 days, the levels of several BBAAs (Ala-CA, Glu-CDCA, Tyr-CA, His-CA, Ile/leu-CA, Trp-CA, Ser-CA and Tyr-CDCA) were positively correlated with the hours elapsed after birth (Extended Data Fig. 6). We correlated the abundance of Bacteroides, Bifidobacterium and Enterococcus with levels of host-conjugated (Gly and Tau) bile acids and BBAAs. Bacteroides abundance was not correlated with BBAA production. In 12-month-old infants, Enterococcus abundance was positively correlated with host-conjugated bile acids and BBAAs including Ala, Ile/Leu, Phe, Ser and Tyr (Fig. 3e). Bifidobacterium abundance was negatively correlated with host-conjugated bile acids in one-month-old infants and positively correlated with bile acid conjugates of His and Thr (Fig. 3e). These data support our findings that BSHs from Bifidobacterium species are amine N-acyltransferases that produce BBAAs in humans. To our knowledge, this is the first demonstration connecting BBAA production with BSH-expressing bacteria during human infant development.
hedgedconditional- Asserted: passes — The authors put it forward as true.
- Checkable: passes — It can be checked against evidence.
- Load-bearing: fails — The paper’s conclusions may not depend on it.
- Based: passes — The paper gives a reason why it holds.
Probably not a substantial claim. The paper’s conclusions may not depend on it.
A conclusion the paper draws from its own results — it cites no other source for it, so there is none to check. The quote shows it is in the paper.
In the paper
“The large proportion of alanine and serine conjugates produced by B. fragilis (Fig. 2d), BlBSH-expressing E. coli (Fig. 2c) and purified BlBSH (Fig. 2b) indicate that the enzyme prefers amino acids with smaller side chains.”
§ Bile salt hydrolase catalyses formation of amine-conjugated bile acids > BSH is a bacterial N-acyltransferase
hedgeddirect- Asserted: passes — The authors put it forward as true.
- Checkable: passes — It can be checked against evidence.
- Load-bearing: passes — The paper’s conclusions depend on it.
- Based: passes — The paper gives a reason why it holds.
It may state two separate claims as one.
What the paper did — it cites no source for this, so there is none to check. The quote shows it is in the paper.
In the paper
“The B. fragilis NCTC 9343 Δbsh mutant isolates (BER-279) were also tested for loss of erythromycin resistance and respiratory test.”
§ Bile salt hydrolase catalyses formation of amine-conjugated bile acids > Methods > Construction of B. fragilis NCTC 9343 Δbsh mutant A 1,797 bp DNA fragment containing the N-terminal region of the BSH gene was PCR amplified from the B. fragilis NCTC 9343 using primers BSH-NT-FOR and BSH-NT-REV. The N-terminal fragment was cloned into the SphI/BamHI sites of the pFD516 vector. Then a 1,734 bp DNA fragment containing the C-terminal region was PCR amplified with primers BSH-CT-FOR and BSH-CT-REV2 and cloned into the SacI site of pFD516. The new construct, pER363, contains a deletion of 765 bp DNA fragment from the bsh gene. A 3,533 bp BglII/SalI DNA fragment from pER363 containing the Δbsh construct was cloned into the BamHI/SalI sites of the suicide vector for allelic replacement in Bacteroides, pLGB13 to construct pER-366. pER-366 was mobilized from E. coli S17-1 λpir into B. fragilis NCTC 9343 by biparental mating as described previously. Transconjugants were selected on brain–heart infusion supplemented (BHIS) plus 0.5% yeast extract plates containing 200 μg ml−1 gentamycin and 10 μg ml−1 erythromycin. Four transconjugant colonies were grown overnight on BHIS broth with 200 μg ml−1 gentamycin (erythromycin was omitted). Then 10 μl of an overnight culture was spread on BHIS with 0.5% yeast extract plates containing 200 μg ml−1 gentamycin and 100 ng ml−1 anhydrotetracycline. Transconjugant colonies were streaked on fresh BHIS with 0.5% yeast extract plates containing 200 μg ml−1 gentamycin and 100 ng ml−1 anhydrotetracycline. PCR amplification using BSH-mutcheck-FOR and BSH-mutcheck-REV primers was used to identify chromosomal double-crossed over genetic recombination. The B. fragilis NCTC 9343 Δbsh mutant isolates (BER-279) were also tested for loss of erythromycin resistance and respiratory test.
plain- Asserted: passes — The authors put it forward as true.
- Checkable: passes — It can be checked against evidence.
- Load-bearing: fails — The paper’s conclusions may not depend on it.
- Based: passes — The paper gives a reason why it holds.
Probably not a substantial claim. The paper’s conclusions may not depend on it. It may state two separate claims as one.
What the paper did — it cites no source for this, so there is none to check. The quote shows it is in the paper.
In the paper
“In each plate, two positive controls containing a mix of Vibrio campbellii and PhiX lambda phage were added.”
§ Bile salt hydrolase catalyses formation of amine-conjugated bile acids > Methods > Shotgun metagenomics of IGRAM stool samples
plainn = 2- Asserted: passes — The authors put it forward as true.
- Checkable: passes — It can be checked against evidence.
- Load-bearing: fails — The paper’s conclusions may not depend on it.
- Based: passes — The paper gives a reason why it holds.
Probably not a substantial claim. The paper’s conclusions may not depend on it.
What the paper did — it cites no source for this, so there is none to check. The quote shows it is in the paper.
In the paper
“Peak areas for each conjugated bile acid were normalized to peak areas from deuterated internal standards of GCA-d4, GUDCA-d4 or GDCA-d4, matching the bile acid.”
§ Bile salt hydrolase catalyses formation of amine-conjugated bile acids > Methods > LC–MS/MS quantification of bile acids in IGRAM stool samples
plain- Asserted: passes — The authors put it forward as true.
- Checkable: passes — It can be checked against evidence.
- Load-bearing: passes — The paper’s conclusions depend on it.
- Based: passes — The paper gives a reason why it holds.
Probably not a substantial claim.
What the paper did — it cites no source for this, so there is none to check. The quote shows it is in the paper.
In the paper
“PCR amplification using BSH-mutcheck-FOR and BSH-mutcheck-REV primers was used to identify chromosomal double-crossed over genetic recombination.”
§ Bile salt hydrolase catalyses formation of amine-conjugated bile acids > Methods > Construction of B. fragilis NCTC 9343 Δbsh mutant A 1,797 bp DNA fragment containing the N-terminal region of the BSH gene was PCR amplified from the B. fragilis NCTC 9343 using primers BSH-NT-FOR and BSH-NT-REV. The N-terminal fragment was cloned into the SphI/BamHI sites of the pFD516 vector. Then a 1,734 bp DNA fragment containing the C-terminal region was PCR amplified with primers BSH-CT-FOR and BSH-CT-REV2 and cloned into the SacI site of pFD516. The new construct, pER363, contains a deletion of 765 bp DNA fragment from the bsh gene. A 3,533 bp BglII/SalI DNA fragment from pER363 containing the Δbsh construct was cloned into the BamHI/SalI sites of the suicide vector for allelic replacement in Bacteroides, pLGB13 to construct pER-366. pER-366 was mobilized from E. coli S17-1 λpir into B. fragilis NCTC 9343 by biparental mating as described previously. Transconjugants were selected on brain–heart infusion supplemented (BHIS) plus 0.5% yeast extract plates containing 200 μg ml−1 gentamycin and 10 μg ml−1 erythromycin. Four transconjugant colonies were grown overnight on BHIS broth with 200 μg ml−1 gentamycin (erythromycin was omitted). Then 10 μl of an overnight culture was spread on BHIS with 0.5% yeast extract plates containing 200 μg ml−1 gentamycin and 100 ng ml−1 anhydrotetracycline. Transconjugant colonies were streaked on fresh BHIS with 0.5% yeast extract plates containing 200 μg ml−1 gentamycin and 100 ng ml−1 anhydrotetracycline. PCR amplification using BSH-mutcheck-FOR and BSH-mutcheck-REV primers was used to identify chromosomal double-crossed over genetic recombination. The B. fragilis NCTC 9343 Δbsh mutant isolates (BER-279) were also tested for loss of erythromycin resistance and respiratory test.
plaindirect- Asserted: passes — The authors put it forward as true.
- Checkable: passes — It can be checked against evidence.
- Load-bearing: fails — The paper’s conclusions may not depend on it.
- Based: passes — The paper gives a reason why it holds.
Probably not a substantial claim. The paper’s conclusions may not depend on it.
What the paper did — it cites no source for this, so there is none to check. The quote shows it is in the paper.
In the paper
“Quantification was performed against a standard curve of authentic standards at eight concentrations ranging from 7.81 nM to 1 µM.”
- Also stated in: another passage · plain
“Quantification was performed against a standard curve of authentic standards at eight concentrations ranging from 7.81 nM to 1 µM.”
§ Bile salt hydrolase catalyses formation of amine-conjugated bile acids > Methods > Extraction and LC–MS/MS quantification of bile acids from bacterial cultures
plain- Asserted: passes — The authors put it forward as true.
- Checkable: passes — It can be checked against evidence.
- Load-bearing: passes — The paper’s conclusions depend on it.
- Based: passes — The paper gives a reason why it holds.
Probably not a substantial claim.
- Also stated in: another passage · plain
What the paper did — it cites no source for this, so there is none to check. The quote shows it is in the paper.
In the paper
“Sterility of mice was ensured by qPCR and aerobic/anaerobic culture with rich media.”
§ Bile salt hydrolase catalyses formation of amine-conjugated bile acids > Methods > Monocolonization of GF mice
plaindirect- Asserted: passes — The authors put it forward as true.
- Checkable: passes — It can be checked against evidence.
- Load-bearing: passes — The paper’s conclusions depend on it.
- Based: passes — The paper gives a reason why it holds.
Probably not a substantial claim.
What the paper did — it cites no source for this, so there is none to check. The quote shows it is in the paper.
In the paper
“Peak areas for each conjugated bile acid were normalized to peak areas from deuterated internal standards of GCA-d4 or GDCA-d4, matching the bile acid.”
§ Bile salt hydrolase catalyses formation of amine-conjugated bile acids > Methods > Extraction and LC–MS/MS quantification of bile acids from bacterial cultures
plain- Asserted: passes — The authors put it forward as true.
- Checkable: passes — It can be checked against evidence.
- Load-bearing: passes — The paper’s conclusions depend on it.
- Based: passes — The paper gives a reason why it holds.
Probably not a substantial claim.
What the paper did — it cites no source for this, so there is none to check. The quote shows it is in the paper.
In the paper
“After automatic processing, the phase, baseline and internal standard were checked and modified manually for each spectrum for quality assurance.”
§ Bile salt hydrolase catalyses formation of amine-conjugated bile acids > Methods > Amino acid quantification of caecal content by 1H NMR
plain- Asserted: passes — The authors put it forward as true.
- Checkable: passes — It can be checked against evidence.
- Load-bearing: fails — The paper’s conclusions may not depend on it.
- Based: passes — The paper gives a reason why it holds.
Probably not a substantial claim. The paper’s conclusions may not depend on it.
What the paper did — it cites no source for this, so there is none to check. The quote shows it is in the paper.
In the paper
“Individual colonies were selected, and successful mutations were confirmed by QIAprep Spin Miniprep kit (Qiagen) preparation of plasmid DNA followed by Sanger sequencing from the T7 promoter region.”
§ Bile salt hydrolase catalyses formation of amine-conjugated bile acids > Methods > Site-directed mutagenesis of BlBSH active site amino acid residues The pET-28b(+)-BlBSH vector constructed above was mutated using the Q5 Site-Directed Mutagenesis Kit according to the manufacturer’s instructions (New England Biolabs). The NEBaseChanger tool was used to design primers (Supplementary Table 2) and calculate the appropriate annealing temperatures for PCR. Following PCR mutagenesis and treatment with kinase, ligase and DpnI, the products were transformed into NEB 5-alpha-competent E. coli by heat shock at 42 °C, and positive transformants were selected on Luria–Bertani media containing 50 µg ml−1 kanamycin. Individual colonies were selected, and successful mutations were confirmed by QIAprep Spin Miniprep kit (Qiagen) preparation of plasmid DNA followed by Sanger sequencing from the T7 promoter region. Positively identified plasmid DNA was stored at −20 °C. To express the proteins, mutant pET-28B(+)-BlBSH plasmids were transformed into E. coli BL21(DE3) cells by electroporation at 2,500 V, and positive transformants were selected on Luria–Bertani media containing 50 µg ml−1 kanamycin. To measure TCA deconjugation, transformed E. coli were cultured in M9 media supplemented with 1 mM TCA. To measure CA conjugation, transformants were cultured in Luria–Bertani media supplemented with 1 mM CA. All transformants were grown at 37 °C and 250 rpm until OD600 ≈ 0.6 was reached; then protein was induced by the addition of 0.1 M isopropyl β-d-1-thiogalactopyranoside and grown for a further 4 h. E. coli were extracted for LC–MS/MS according to the protocol below.
plain- Asserted: passes — The authors put it forward as true.
- Checkable: passes — It can be checked against evidence.
- Load-bearing: fails — The paper’s conclusions may not depend on it.
- Based: passes — The paper gives a reason why it holds.
Probably not a substantial claim. The paper’s conclusions may not depend on it.
The paper relies on this without support.
E. coli lacks endogenous bsh.
“Heterologous expression of the enzyme in E. coli, which lacks endogenous bsh, confers amine N-acyltransferase activity.”
Claims other papers make about this one
Each is checked against this paper’s own text: does it say what the citing paper says it does?
The cited source says what the claim attributes to it.
In the citing paper
“Additionally, these data suggest that BSHs are involved in MCBA production; indeed, other studies are already investigating the possibility of BSH-catalysed reconjugation46,47.”
From Bile salt hydrolases shape the bile acid landscape and restrict Clostridioides difficile growth in the murine gut (2023) · cites this paper as [46]
The cited source says what the claim attributes to it.
In the citing paper
“Furthermore, BSH activity is complicated by the emerging data indicating that these enzymes can catalyse reconjugation to generate MCBAs capable of activating host ligand-activated receptors31,33,46,47.”
From Bile salt hydrolases shape the bile acid landscape and restrict Clostridioides difficile growth in the murine gut (2023) · cites this paper as [46]
Citations
Cites
Moderated estimation of fold change and dispersion for RNA-seq data with DESeq2
Love, M. I., Huber, W., & Anders, S. (2014) · Genome Biology · doi:10.1186/s13059-014-0550-8 · Cited by 95,106
Trimmomatic: a flexible trimmer for Illumina sequence data
Bolger, A. M., Lohse, M., & Usadel, B. (2014) · Bioinformatics · doi:10.1093/bioinformatics/btu170 · Cited by 65,548
Fast gapped-read alignment with Bowtie 2
Langmead, B., & Salzberg, S. L. (2012) · Nature Methods · doi:10.1038/nmeth.1923 · Cited by 56,400
fastp: an ultra-fast all-in-one FASTQ preprocessor
Chen, S., Zhou, Y., Chen, Y., & Gu, J. (2018) · Bioinformatics · doi:10.1093/bioinformatics/bty560 · Cited by 29,721
featureCounts: an efficient general purpose program for assigning sequence reads to genomic features
Liao, Y., Smyth, G. K., & Shi, W. (2014) · Bioinformatics · doi:10.1093/bioinformatics/btt656 · Cited by 27,219
Prokka: rapid prokaryotic genome annotation
Seemann, T. (2014) · Bioinformatics · doi:10.1093/bioinformatics/btu153 · Cited by 18,937
Twelve years of SAMtools and BCFtools
Danecek, P., Bonfield, J., Liddle, J., Marshall, J., Ohan, V., Pollard, M., Whitwham, A., Keane, T., McCarthy, S., Davies, R. M., et al. (2021) · GigaScience · doi:10.1093/gigascience/giab008 · Cited by 16,298
Kraken: ultrafast metagenomic sequence classification using exact alignments
Wood, D. E., & Salzberg, S. L. (2014) · Genome Biology · doi:10.1186/gb-2014-15-3-r46 · Cited by 4,521
Qualimap 2: advanced multi-sample quality control for high-throughput sequencing data
Okonechnikov, K., Conesa, A., & García-Alcalde, F. (2016) · Bioinformatics · doi:10.1093/bioinformatics/btv566 · Cited by 2,145
Absolute metabolite concentrations and implied enzyme active site occupancy in Escherichia coli
Bennett, B. D., Kimball, E. H., Gao, M., Osterhout, R., Van Dien, S. J., & Rabinowitz, J. D. (2009) · Nature Chemical Biology · doi:10.1038/nchembio.186 · Cited by 1,830
Cited by
Sorted by citations
Items 101–200 of 245
Distinguishing diet- and microbe-derived metabolites in the human gut
Tanes, C., Hu, W., Friedman, E. S., Hecht, A. L., Daniel, S. G., Clish, C. B., Lewis, J. D., Wu, G. D., & Bittinger, K. L. (2025) · Microbiome · doi:10.1186/s40168-025-02258-9 · Cited by 11
“Furthermore, levels of tyrosocholic and leu-cocholic acid, recently discovered alternate conjugates of cholic acid [20], were identified as microbial products and their levels recovered by post + 4 (Fig.”
Self-citationEnvironmental and maternal imprints on infant gut metabolic development
Kvitne, K. E., Allaband, C., Onuora, J. C., Perry, D. S., Zuffa, S., Patel, L., Charron‐Lamoureux, V., Mohanty, I., Sejane, K., Patan, A., et al. (2025) · Cell Host & Microbe · doi:10.1016/j.chom.2025.11.002 · Cited by 7
Self-citationBifidobacterium as Keystone Species Driving Microbial Interactions in the Infant Digestive Tract
Vásquez-Dean, J., Canales, A., Orellana, C. A., & Garrido, D. (2026) · Annual Review of Food Science and Technology · doi:10.1146/annurev-food-052924-065321 · Cited by 7
Pleiotropic immunoregulation by bile acids in pathophysiology
Lin, B.-S., Yin, M., Xie, S.-A., Li, P., & Li, X. (2026) · Frontiers in Immunology · doi:10.3389/fimmu.2026.1719092 · Cited by 8
“PXR has been activated in vitro by multiple BA species, including LCA, DCA, 3-oxoLCA, GDCA, acetylated derivatives of CA and DCA, and glutamate-conjugated CA and CDCA (78 – 80).”
Microbial transformation of secondary bile acids: roles in gut ecology and autoimmune diseases
Ren, L., Li, M., Wu, L., Lin, Z. M., & Chen, A. (2026) · Frontiers in Immunology · doi:10.3389/fimmu.2026.1769792 · Cited by 7
“Recent twin studies have elucidated that bsh are instrumental in the intestinal synthesis of MCBAs via a reversible hydrolysis-coupling mechanism (83, 84).”
The microbiome regulates host metabolic health and diseases through microbial enzymes
Ding, Y., Zhang, Z., Wang, K., & Jiang, C. (2026) · Nature Reviews Gastroenterology & Hepatology · doi:10.1038/s41575-026-01195-8 · Cited by 14
“…studies have shown that microbial BSHs also mediate the formation of non-canonical conjugated bile acids (the multiple functions of the same gut microbial enzymes are further discussed in Box 2) such as tryptophan-conjugated cholic acid (TrpCA) and phenylalanine-conjugated cholic acid 37–39 .”
Park, S., Lee, Y. Q., Kim, D.-S., Sung, D. K., Kim, K. J., Lee, J., Cho, J., Lee, W., Sung, S. I., & Lee, D. (2025) · iScience · doi:10.1016/j.isci.2025.113038 · Cited by 7
Avcioglu, S. Y., & Berkel, Ç. (2025) · Apmis · doi:10.1111/apm.70066 · Cited by 6
“Most of the CA and CDCA are then conjugated with glycine or taurine in a two-step reaction catalyzed by bile acid–coenzyme A (CoA) synthetase and bile acid–CoA:amino acid N-acyltransferase [8, 9].”
Yang, Q., Liu, J., Lyu, S., Li, S., Han, Q., Ma, C., Du, Z., & Zhang, T. (2025) · Journal of Agricultural and Food Chemistry · doi:10.1021/acs.jafc.5c07236 · Cited by 9
Kvitne, K. E., Zuffa, S., Charron‐Lamoureux, V., Mohanty, I., Patan, A., Mannochio-Russo, H., Zemlin, J., Burnett, L. A., Zhang, L. S., Cecala, M., et al. (2025) · npj Biofilms and Microbiomes · doi:10.1038/s41522-025-00899-0 · Cited by 6
“Bile salt hydrolase (BSH), an enzymewidelyexpressedacrossmostbacterialphyla 50 ,playsakeyroleinthe modi fi cation of BAs, including AA conjugation of BA 51,52 .”
Self-citationPharmacology and therapeutics of bile acid synthesis and modification enzymes in metabolic diseases
Ding, L., Jin, L., & Huang, W. (2026) · Pharmacological Reviews · doi:10.1016/j.pharmr.2026.100115 · Cited by 9
Advances in research on the effects of bile acids and their receptors on intestinal function
Cheng, Y., Zhang, L., Zhang, M., & Yu, J. (2026) · Frontiers in Nutrition · doi:10.3389/fnut.2026.1821418 · Cited by 6
“Bile salt hydrolases (BSHs), classically regarded as decon-jugating enzymes, have now been shown to possess amine N-acyltransferase activity and to generate bacterial bile acid amidates (BBAAs) from host-derived bile acids (46).”
Dietary iron intake has long-term effects on the fecal metabolome and microbiome
Kostenko, A., Zuffa, S., Zhi, H., Mildau, K., Raffatellu, M., Dorrestein, P. C., & Aron, A. T. (2024) · Metallomics · doi:10.1093/mtomcs/mfae033 · Cited by 6
Self-citationMcMillan, A. S., Foley, M. H., Perkins, C. E., & Theriot, C. M. (2023) · bioRxiv (Cold Spring Harbor Laboratory) · doi:10.1101/2023.06.27.546749 · Cited by 7
Pathogenic Bacteroides fragilis strains can emerge from gut-resident commensalsPreprint
Oles, R. E., Terrazas, M. C., Loomis, L. R., Neal, M. J., Paulchakrabarti, M., Zuffa, S., Hsu, C.-Y., Ayala, A. V., Lee, M. H., Tribelhorn, C., et al. (2024) · bioRxiv (Cold Spring Harbor Laboratory) · doi:10.1101/2024.06.19.599758 · Cited by 7
“Adjacent to this PUL is a bile salt hydrolase (BF9343_1433) ( Figure 5B ), which a recent report linked bile acid metabolism to carbohydrate metabolism and PUL expression in B. thetaiotaomicron 58,59 .”
Self-citationBile resistance mechanisms in probiotics: From structural adaptation to metabolic regulation
Hu, J.-W., Guo, S.-J., Zhang, L.-W., & Guo, C.-F. (2026) · Food Bioscience · doi:10.1016/j.fbio.2026.108282 · Cited by 5
Deng, L., Zhong, G., Yang, H., & Zhang, B. (2025) · International Journal of Biological Macromolecules · doi:10.1016/j.ijbiomac.2025.140381 · Cited by 6
A Taxonomically-informed Mass Spectrometry Search Tool for Microbial Metabolomics DataPreprint
Zuffa, S., Schmid, R., Bauermeister, A., Gomes, P. W. P., Caraballo‐Rodríguez, A. M., Abiead, Y. E., Aron, A. T., Gentry, E. C., Zemlin, J., Meehan, M. J., et al. (2023) · bioRxiv (Cold Spring Harbor Laboratory) · doi:10.1101/2023.07.20.549584 · Cited by 5
Self-citationBracken, A. K., Malarney, K. P., & Chang, P. V. (2026) · Journal of the American Chemical Society · doi:10.1021/jacs.5c18912 · Cited by 5
Metatranscriptomics catches gut microbes in the act
Liu, K., & Wang, Y. (2025) · Cell Host & Microbe · doi:10.1016/j.chom.2025.06.004 · Cited by 4
Probiotic Potential of Lactic Acid Bacteria Isolated from Moroccan Traditional Food Products
Yao, A. O. P., Mounir, M., Razafindralambo, H. L., & Jacques, P. (2025) · Microorganisms · doi:10.3390/microorganisms13092201 · Cited by 5
“Strains of Enterococcus durans have also been shown to exhibit hydrolytic activity mediated by the enzyme N-acetyltransferase, which facilitates their growth in bile salt-enriched environments, a key probiotic trait associated with gastrointestinal resilience [47,48].”
Wang, J., Liu, Y., Zhu, C., Wang, Z., Wang, S., Fang, S., & Xu, F. (2025) · Food and Chemical Toxicology · doi:10.1016/j.fct.2025.115851 · Cited by 4
Regulation of sterol metabolism by gut microbiota and its relevance to disease
Huang, C., Wu, Q., Wang, J., Cai, J., Wang, Z., You, L., Zhu, Z., & Ding, Y. (2025) · Gut Microbes · doi:10.1080/19490976.2025.2589493 · Cited by 5
“66 Approximately 26.03% of colonic bacteria possess BSH activity, 67 predominantly among Gram-positive bacteria, including Bifidobacterium , Lactobacillus , Clostridium , Enterococcus , and Listeria , 68–70 although BSH is also present in some Gram-negative bacteria, such as Stenotrophomonas ,…”
InfluentialLiu, J., Elsheikha, H. M., Lei, C.-C., Qin, S., Liu, Y., Ni, H.-B., Qin, Y., Yu, H.-L., Su, J.-W., Chen, B.-N., et al. (2026) · BMC Microbiology · doi:10.1186/s12866-026-04750-0 · Cited by 5
“This unique BBAA set can activate the host’s ligand-activated receptors, potentially mediating communication between the host and the microbiota [36].”
Gut microbial bile salt hydrolase as a metabolic gatekeeper in digestive homeostasis and disease
Chu, H., Song, X., Liu, C., Ma, T., & Cui, W. (2026) · Frontiers in Immunology · doi:10.3389/fimmu.2026.1870619 · Cited by 7
“Within the microbial bile acid transformation network, BSH catalyzes the deconjugation of conjugated bile acids and is widely regarded as the gateway reaction of microbial bile acid metabolism (3, 5 – 7).”
Lin, G., Zhang, B., Qu, Z., Guo, M., Shang, K., Zhao, J., Li, H., & Wang, G. (2025) · Journal of Agricultural and Food Chemistry · doi:10.1021/acs.jafc.4c05616 · Cited by 4
Zepeda-Hernández, A., la Cruz, M. F. R.-D., Antunes‐Ricardo, M., Ortega‐Hernández, É., García-García, J. D., García-Amezquita, L. E., & García‐Cayuela, T. (2025) · International Dairy Journal · doi:10.1016/j.idairyj.2025.106276 · Cited by 4
Wang, J., Gao, J., Zhang, Q., Lu, J., Yang, Y., Cai, X., Dong, H., & Lu, L. (2025) · Journal of Gastroenterology and Hepatology · doi:10.1111/jgh.17017 · Cited by 4
Gómez, F., Pérez‐Sánchez, N., Macías‐Camero, A., Núñez, R., Contreras, N., Cañas, J. A., Jiménez-Sánchez, I. M., Diez‐Echave, P., Barbas, C., Guéant, J., et al. (2025) · Carbohydrate Polymers · doi:10.1016/j.carbpol.2025.124236 · Cited by 7
The dance of gut microbes on the keto diet
Kim, J., & Koh, A. (2024) · Nature Metabolism · doi:10.1038/s42255-024-01062-3 · Cited by 3
Wang, X., Wang, Y., & Sun, L. (2024) · Biophysics Reports · doi:10.52601/bpr.2024.240050 · Cited by 3
“MCBA generation has recently been shown by bile salt hydrolases (BSH) (Guzior et al. 2024; Quinn et al. 2020; Rimal et al. 2024).”
Meng, X., Chen, Y., Zhao, B.-X., et al. (2025) · European Journal of Pharmacology · doi:10.1016/j.ejphar.2025.177701 · Cited by 3
L-theanine alleviates reserpine-induced depression in rats via modulation of the gut-brain axis
Zhao, Y., Wang, Z., Lu, Y., Xiao, R., Zhao, T., Liu, Z., Wang, K., Huang, J., & Zhu, M. (2025) · Food Research International · doi:10.1016/j.foodres.2025.117873 · Cited by 4
Zhang, Y., Chen, Q., Ouyang, Z., Dong, H., Li, C., & Fu, X. (2025) · International Journal of Biological Macromolecules · doi:10.1016/j.ijbiomac.2025.149104 · Cited by 3
Tong, Y., Li, L., Liu, X., et al. (2026) · Journal of Agricultural and Food Chemistry · doi:10.1021/acs.jafc.5c15404 · Cited by 3
Effects of bile acids and gut microbiota interactions on neurological and psychiatric disorders
Pei, X., Wang, X., Lu, H., Wu, J., Xu, L., Chen, X., Deng, L., & Xu, H. (2026) · Genes & Diseases · doi:10.1016/j.gendis.2026.102069 · Cited by 3
Gut microbial metabolites and immune-related diseases
Guo, J., Yin, X., Wang, K., & Jiang, C. (2026) · Immunity & Inflammation · doi:10.1007/s44466-026-00031-7 · Cited by 5
From Microbial Ecology to Functional Components in Microbe–Host Interactions
Wang, T., Wang, Z., Yang, X., & Zhang, L. (2026) · Biology · doi:10.3390/biology15080635 · Cited by 3
“These metabolic products can influence host physiology through multiple mechanisms, including receptor-ligand interactions, epigenetic regulation, and metabolic reprogramming [15,64,96].”
Impact of alcohol on gut microbial metabolism and the gut-liver-brain axis
Freund, L., Leal, B. R., & Hsu, C. L. (2026) · Alcohol · doi:10.1016/j.alcohol.2026.04.009 · Cited by 3
Lv, J., Zhou, L., Dai, X., Landberg, R., Meng, H., Tian, H., Zhang, S., Liu, T., Yin, X., Zhang, J., et al. (2026) · Gut Microbes · doi:10.1080/19490976.2026.2668127 · Cited by 3
“17,18 Abundant in several prominent probiotic genera, including Lactobacillus , Bacteroides , and Bifidobacterium , BSHs thereby represent multifaceted therapeutic targets for the management of metabolic syndrome.”
Early-life colonization with Clostridioides difficile remodels the developing gut
Semon, A., Manzer, H. S., Keenan, O., Zhou, T.-Y., Tiffany, C. R., She, Q., Knight, M., Weiss, A. S., Donohoe, K., Morrow, B. T., et al. (2026) · Science · doi:10.1126/science.ady2886 · Cited by 3
Self-citationLuo, X., Wang, K., & Jiang, C. (2024) · Trends in Endocrinology and Metabolism · doi:10.1016/j.tem.2024.11.007 · Cited by 3
Cholestasis in Alcohol-Associated Liver Disease
Yan, S., & Yin, X. (2025) · American Journal Of Pathology · doi:10.1016/j.ajpath.2025.04.015 · Cited by 3
Detwiler, Z., & Chaudhari, S. N. (2025) · Immunometabolism · doi:10.1097/in9.0000000000000062 · Cited by 3
Correlation cluster analysis of slope safety monitoring data in reservoir areas
Yang, W., Li, T., Wen, B., et al. (2025) · PLoS ONE · doi:10.1371/journal.pone.0324604 · Cited by 3
“We needed to normalize the observations within each region in order to know further before the sensitivity of the observations within each region [28,29].”
InfluentialGlowacki, R. W. P., Engelhart, M. J., Till, J. M., Kadam, A., Nemet, I., Sangwan, N., & Ahern, P. P. (2025) · Microbiology Spectrum · doi:10.1128/spectrum.03419-24 · Cited by 5
McMillan, A. S., Zhang, G., Dougherty, M., et al. (2024) · bioRxiv (Cold Spring Harbor Laboratory) · doi:10.1101/2024.02.07.579219 · Cited by 3
An Atlas of Inter-Organ Metabolite Trafficking in Health and Atherogenic ConditionsPreprint
Bae, H., Jung, S., Le, J., Tamburini, I. J., Kim, J., Wang, E., Song, W.-S., Jang, K.-H., Kang, T., Lopez, M. L., et al. (2024) · SSRN Electronic Journal · doi:10.2139/ssrn.4869929 · Cited by 3
Amino acid competition shapes Acinetobacter baumannii gut carriagePreprint
Ren, X., Clark, R. M., Bansah, D. A., et al. (2024) · bioRxiv (Cold Spring Harbor Laboratory) · doi:10.1101/2024.10.19.619093 · Cited by 3
Self-citationJiménez‐Panizo, A., Johnson, T. A., Wagh, K., Alegre‐Martí, A., Montoya-Novoa, I., Lafuente, A. L., Eckhard, U., Rodríguez‐Lumbreras, L. A., Hoang, L., Stortz, M., et al. (2025) · bioRxiv (Cold Spring Harbor Laboratory) · doi:10.1101/2025.05.13.653693 · Cited by 3
Cooper, A., Powers, A., Battaile, K. P., Mohsen, A.-W. A., Johnson, D. K., Lovell, S., & Ghaloul‐Gonzalez, L. (2025) · Proteins Structure Function and Bioinformatics · doi:10.1002/prot.70023 · Cited by 2
“Finally, we considered the structural similarity to bile salt hydrolase, which similarly possesses an active site nucleophile at Cys2 [61–63] as shown in the superposition in Figure 5C,G.”
Zhang, X., Zhao, S., Cai, S., Yi, J., Wang, T., Liu, Z., & Wang, Y. (2025) · Journal of Agricultural and Food Chemistry · doi:10.1021/acs.jafc.5c03853 · Cited by 4
Primary-Secondary-Tertiary Axis of Bile Acid Metabolism in Healthy Subjects
Cheng, B., Wang, Y., Wang, Y., Yu, T., Zhang, X., Gui, L., Zeng, W., Chen, Q., Huang, L., Miao, J., et al. (2025) · Journal of Proteome Research · doi:10.1021/acs.jproteome.5c00343 · Cited by 3
Zhang, Y., Huang, M., Liu, R., et al. (2025) · Water Research · doi:10.1016/j.watres.2025.124904 · Cited by 2
Wang, P., Wang, Y., Gao, W., Wang, M., Liu, Y., Feng, L., Yin, H., Chen, M., Zhai, L., Yuan, P., et al. (2026) · Food & Function · doi:10.1039/d5fo05530j · Cited by 2
MS/MS Mass Spectrometry Filtering Tree for Bile Acid Regio- and Stereoisomer Annotation
Mohanty, I., Xing, S., Castillo, V., Agongo, J., Patan, A., Abiead, Y. E., Mannochio-Russo, H., Zuffa, S., Zemlin, J., Tronel, A., et al. (2026) · Analytical Chemistry · doi:10.1021/acs.analchem.5c05677 · Cited by 11
Self-citationGu, Y., Xu, P., Wu, Y., Tan, M., Xu, Y., Zhang, L. W., Wang, Y., & Wang, Y. (2026) · ACS Nano · doi:10.1021/acsnano.5c16193 · Cited by 3
Understanding the Role of Gut Microbial Enzyme in CMD
Zhuo, Y., Yu, L., Jiang, C., & Wang, K. (2026) · Circulation Research · doi:10.1161/circresaha.125.326979 · Cited by 3
Unraveling the mechanisms of PCOS: the interplay between gut microbiota and the immune system
Liu, J., Wang, L., Jiang, M., Yan, H., Zhang, G., Li, N., Zhao, Y., Du, X., Zeng, Q., Xiong, D., et al. (2026) · Journal of Ovarian Research · doi:10.1186/s13048-026-02047-4 · Cited by 2
“Bile acids play a crucial role in lipid metabolism, and these mechanisms are significant for alleviating the common insulin resistance and obesity in PCOS patients [95, 96].”
Systemic rhythmicity of host and bacterial bile acid amidates in the mouse
Reilly, E. R., Charron‐Lamoureux, V., Mannochio-Russo, H., Morgan, E. W., Boyle, N. R., Koo, I., Coudriet, E., Hao, F., Mohanty, I., Perdew, G. H., et al. (2026) · Cell Systems · doi:10.1016/j.cels.2026.101541 · Cited by 3
Self-citationMutanen, A., Saqib, S., de Vos, W. M., Niemi, M., Salonen, A., & Pakarinen, M. P. (2026) · Clinical Nutrition · doi:10.1016/j.clnu.2026.106660 · Cited by 2
Shen, Y., Jiang, B., Hao, Z., Zhang, C., Zhang, Z., Wu, Q., Li, L., & Jiang, P. (2024) · Food Bioscience · doi:10.1016/j.fbio.2024.104887 · Cited by 2
Advances in the recognition strategies and analytical techniques of bile acids
Hu, X., Liu, C., Zhou, J., Li, W., & Dai, Z. H. (2024) · TrAC Trends in Analytical Chemistry · doi:10.1016/j.trac.2024.117984 · Cited by 3
Li, Y., & Zhao, J. (2025) · Frontiers in Microbiology · doi:10.3389/fmicb.2025.1511885 · Cited by 2
Iqbal, H., & Rhee, D. (2024) · Vaccines · doi:10.3390/vaccines12070737 · Cited by 1
“The bile salt hydrolase ( bsh ) gene is characterized as an acyltransferase that forms bile acid amidates [53–55].”
BackgroundMicrobially-catalyzed conjugation of GABA and tyramine to bile acidsPreprint
Mullowney, M. W., Fiebig, A., Schnizlein, M. K., et al. (2023) · bioRxiv (Cold Spring Harbor Laboratory) · doi:10.1101/2023.09.25.559407 · Cited by 2
Serum metabolic signatures of cognitive resilience in a longitudinal aging cohortPreprint
Scheurink, T. A. W., Seo, J. I., David, L. C., Wang, C. X., Solis, D. D., Zemlin, J., Bergstrom, J., Dorrestein, P. C., Mohanty, I., & Molina, A. J. A. (2026) · bioRxiv (Cold Spring Harbor Laboratory) · doi:10.64898/2026.03.29.715122 · Cited by 2
“49–53 Accordingly, elevated DCA glucuronide may reflect alterations in gut microbial composition and bile acid signaling linked to cognitive function.”
Self-citationLu, W., Liu, Z., Song, Z., Wang, C., Yu, Z., Peng, S., Tian, Z., Lü, A., & Ning, Z. (2025) · Journal of Ethnopharmacology · doi:10.1016/j.jep.2025.119845 · Cited by 4
Chen, W., Niu, X., Liang, X., Zhu, G., Zhang, X., Gong, Q., Xie, C., Ge, G., Wang, P., & He, Y. (2025) · Chinese Chemical Letters · doi:10.1016/j.cclet.2025.111320 · Cited by 1
Spatial Multi-Omics Analysis of the Qianqiu Goat Gut Microbiome and Metabolome
Guo, P., Qin, W., Song, W., & Chen, H. (2025) · International Journal of Molecular Sciences · doi:10.3390/ijms262411815 · Cited by 2
Metabolic syndrome and a broken heart: trust your gut or risk your heart
Salomon, J., Karl, A., Ahmad, R., Bastola, D. K., Singh, A. B., & Mishra, P. K. (2026) · American Journal of Physiology-Heart and Circulatory Physiology · doi:10.1152/ajpheart.00482.2025 · Cited by 2
Host diets drive microbiome evolution and functional divergence
Nguyen, K. L., Xia, J. S., & Mei, W. (2026) · Genes & Diseases · doi:10.1016/j.gendis.2026.102068 · Cited by 1
Shao, J., Zhao, D., Xia, Y., Wang, G., Song, X., Yang, Y., Xiong, Z., & Ai, L. (2026) · Journal of Advanced Research · doi:10.1016/j.jare.2026.02.048 · Cited by 2
Wu, R., Wen, T., Shang, N., Xie, P., Wang, Z., Li, H., Li, S., & Zhang, D. (2026) · iMeta · doi:10.1002/imt2.70118 · Cited by 1
Two Bile Salt Hydrolase Homologues Drive Bile Resistance in Lactobacillus johnsonii ATCC 43121
Wu, H. J., Chen, Y.-J., Hu, J.-W., Guo, S.-J., Liu, B., Gao, Z., Zhai, Z.-Y., Zhang, L., & Guo, C. (2026) · Journal of Agricultural and Food Chemistry · doi:10.1021/acs.jafc.5c14654 · Cited by 1
Li, Z., Wang, S., Wang, D., Wang, Y., Mai, M., Ruan, Y., Mo, B., Li, Z., & Guo, H. (2026) · PharmaNutrition · doi:10.1016/j.phanu.2026.100504 · Cited by 2
The gut microbiota-bile acid-FXR axis in NAFLD: from progression to therapeutic applications
Zheng, W., Feng, Q., Wang, J., Li, X. X., & Yin, S. (2026) · Frontiers in Physiology · doi:10.3389/fphys.2026.1811118 · Cited by 1
The gut microbiome and mitochondrial function in metabolism, immunity, and disease
Han, E. J., Kim, D., Lee, J. H., & Chung, H. (2026) · Gut Microbes · doi:10.1080/19490976.2026.2699451 · Cited by 1
“76,78,79 76-80 Functionally, microbiota-modified bile acids should therefore be viewed as context-dependent regulators of mitochondrial recovery.”
Bile acid signaling: from dynamic pool composition to inter-organ communication
Yang, F., Wei, T., Liu, K. L., Chu, H., & Yang, L. (2026) · Frontiers in Endocrinology · doi:10.3389/fendo.2026.1890710 · Cited by 2
“…gut microbiota and its metabolic interactions with the host, a growing diversity of BA modi fi cations and their biological functions have been revealed, including acetylation (4), succinylation (5), and conjugation with alternative amino acids (6), long-chain fatty acids (7), or polyamines (8, 9).”
Zhou, Y., Li, W., Niu, X., Cao, Y. W., Wang, M., He, H., Cao, Z., Hong, Q., Tu, P., & Song, Y. (2025) · Analytica Chimica Acta · doi:10.1016/j.aca.2025.344314 · Cited by 1
Özçam, M., Lin, D. L., Gupta, C. L., Li, A., Wheatley, L. M., Baloh, C., Sanda, S., Jones, S. M., & Lynch, S. V. (2024) · medRxiv · doi:10.1101/2024.07.15.24309840 · Cited by 1
Lamichhane, S., Dickens, A. M., Buchacher, T., Lou, E. T., Charron‐Lamoureux, V., Kattelus, R., Karmacharya, P., da Silva, L. P., Kråkström, M., Rasool, O., et al. (2025) · medRxiv · doi:10.1101/2025.02.18.25322275 · Cited by 1
Self-citationPan-repository analysis reveals a drug-activating function of microbial bile acid conjugationPreprint
Charron‐Lamoureux, V., Kelly, P. E., Zuffa, S., Patan, A., Sala‐Climent, M., Walker, C., Zhao, H. N., Xing, S., Gouda, H., Agongo, J., et al. (2026) · bioRxiv (Cold Spring Harbor Laboratory) · doi:10.64898/2026.03.03.709330 · Cited by 4
Self-citationKisthardt, S. C., Thanissery, R., Pike, C. M., et al. (2023) · bioRxiv (Cold Spring Harbor Laboratory) · doi:10.1101/2023.06.06.543867
Thomas, S. P., Askarian, F., Kousha, A., Suzuki, E., Tsai, C. M., Liu, C., Nizet, V., Dorrestein, P. C., & Tsunoda, S. M. (2024) · bioRxiv (Cold Spring Harbor Laboratory) · doi:10.1101/2024.01.31.578215
Self-citationLakemeyer, M., & Seidel, J. (2024) · Nachrichten aus der Chemie · doi:10.1002/nadc.20244143493
Decoding the Promiscuous Activity of Bile Salt HydrolasePreprint
Gupta, M. N., & Uversky, V. N. (2024) · Qeios · doi:10.32388/4bkyaf
Decoding the Promiscuous Activity of Bile Salt HydrolasePreprint
Gupta, M. N., & Uversky, V. N. (2024) · Qeios · doi:10.32388/4bkyaf.2
Fecal Microbial and Metabolic Signatures in VEO-IBD: Implications for Unique PathophysiologyPreprint
Kvitne, K. E., Zuffa, S., Charron‐Lamoureux, V., Mohanty, I., Patan, A., Mannochio-Russo, H., Zemlin, J., Burnett, L. A., Zhang, L. S., Cecala, M. C., et al. (2025) · bioRxiv (Cold Spring Harbor Laboratory) · doi:10.1101/2025.04.26.650779
“Bile salt hydrolase (BSH), an enzyme widely expressed across most bacterial phyla 60 , plays a key role in the modification of BAs, including AA conjugation of BA 61,62 .”
Self-citationChaturvedi, P. K., Sakthivel, S., & Maitra, U. (2025) · Organic Letters · doi:10.1021/acs.orglett.5c01757
Exploring Microbial Utilization of Iron via Mass Spectrometry
Kostenko, A. (2025) · Digital Commons - DU (University of Denver) · doi:10.56902/etdcrp.2025.22
Chemical dissection of sterol and bile acid signaling via clickable photoaffinity probes
Xu, M., Chen, X., Ma, J., & Yang, X. (2025) · Biophysics Reports · doi:10.52601/bpr.2025.250029
Rolfe, N., Schroeter, K. L., Forrester, T. J. B., et al. (2025) · Journal of Biological Chemistry · doi:10.1016/j.jbc.2025.110439
“In the gut micro-biome, bile acid transformations generate steroid metabolites that regulate critical physiological processes that influence systemic host physiology (1).”
Environmental and Maternal Imprints on Infant Gut Metabolic ProgrammingPreprint
Kvitne, K. E., Allaband, C., Onuora, J. C., Perry, D. S., Zuffa, S., Patel, L., Charron‐Lamoureux, V., Mohanty, I., Sejane, K., Patan, A., et al. (2025) · bioRxiv (Cold Spring Harbor Laboratory) · doi:10.1101/2025.07.24.666662
“This was further supported by increased levels of the bsh genes with infant age, reflecting colonization of bsh-expressing bacteria as the infant grows 33 .”
InfluentialSelf-citationLeveraging chemical synthesis to discover metabolites from the gut microbiome
Keys, A. J., Nandwana, N. K., Alnasser, E., & Gentry, E. C. (2025) · Annals of the New York Academy of Sciences · doi:10.1111/nyas.70004
Self-citationMicrobial Adaptation and Host Signaling: Bacteroides - Bile Acid Interactions in Gut HealthPreprint
Silva, C. M. G., Ferreira, R. B. R., & Lobo, L. A. (2025) · SSRN Electronic Journal · doi:10.2139/ssrn.5549718
Impact of Bile Acid Amidation on In Silico Farnesoid X Receptor Dynamics
Sasse, R. K., Biswas, A., & Okafor, C. D. (2025) · The Journal of Physical Chemistry B · doi:10.1021/acs.jpcb.5c02361 · Cited by 1
Hasan, M. N., Wang, H., Luo, W., Du, Y., Xiong, L., Gu, L., & Li, T. (2025) · Journal of Lipid Research · doi:10.1016/j.jlr.2025.100936 · Cited by 1
Fouladi, F., Chen, Y., Bera, S., Jarmusch, A. K., Tyne, D. V., Palella, F. J., Margolick, J. B., Chew, K. W., Sun, J., Martinson, J. J., et al. (2025) · Nature Communications · doi:10.1038/s41467-025-64822-z
“Indeed, recent studies showed that these microbial bile acid amidates interact with host via nuclear receptors like the farnesoid X receptor and pregnane X receptor 26,27 , and may be implicated in in fl ammatory bowel disease 27 by mediating interferon-γ production in CD4 + T cells 27 .”
Zhou, Y., Ying, G., Shen, W., et al. (2026) · Microbiology Spectrum · doi:10.1128/spectrum.00747-25
Metadata
- Authors
- Patterson, A., Rimal, B., Collins, S., Granda, M., Koo, I., Solanka, S., Hoque, N., Gentry, E., Yan, T., Bisanz, J., Krausz, K., Desai, D., Amin, S., Rocha, E., Coleman, J., Shah, Y., Gonzalez, F., Heuvel, J. V., Dorrestein, P., & Weinert, E.
- Affiliations
- Pennsylvania State University (US)
- University of Michigan
- University of California San Diego (US)
- National Institutes of Health (US)
- East Carolina University (US)
- University of Michigan (US)
- Penn State University
- Corresponding author
- Patterson, Andrew
- ORCID
- Venue
- Nature
- Published
- 2022-10-10
- Volume
- 626
- Issue
- 8000
- Pages
- 859-863
- ISSN
- 0028-0836 (ISSN-L)
- PMC
- PMC10881385
- OpenAlex
- W4391616565
- Cited by
- 252
- References
- 49
- Citations by year
- 2026: 99 · 2025: 88 · 2024: 60 · 2023: 5
- FWCI
- 28.43
- Type
- journal article
- Language
- en
- Open access
- hybrid
- doi.org
- Locations
- Nature (publishedVersion, cc-by)
- Research Square (submittedVersion, cc-by)
- PubMed Central (publishedVersion, cc-by)
- PubMed (publishedVersion)
- RePEc: Research Papers in Economics (submittedVersion)
- Funders
- U.S. Department of Agriculture (1009993, U01DK119702)
- American Heart Association (19POST34380588)
- Pennsylvania Department of Health (UL1TR001878)
- Children's Hospital of Philadelphia (UL1TR001878)
- University of Pennsylvania (P30 DK050306)
- University of Michigan (DK034933, P30CA046592, P50CA130810)
- Pennsylvania State University
- Crohn's and Colitis Foundation (675191, 623914)
- American Beverage Foundation for a Healthy America
- National Institutes of Health (1s10od021750-01a1, 1009993, PEN047702, UL1TR001878)
- University of Michigan Comprehensive Cancer Center (P30 CA046592)
- National Cancer Institute (R01CA245546, P50CA130810, P30CA046592, R01CA148828)
- National Institute of General Medical Sciences (R01GM125842, R35GM138369, T32GM102057, R35GM151045)
- National Institute of Allergy and Infectious Diseases (R00AI147165)
- National Institute of Diabetes and Digestive and Kidney Diseases (P30DK034933, U01DK119702, T32DK120509, R01DK095201, R01DK136117, U24DK133658, P30DK050306, R01DK107565)
- National Institute of Environmental Health Sciences (R35ES035027)
- National Center for Research Resources
- National Center for Advancing Translational Sciences
- Topics
- Life Sciences › Biochemistry, Genetics and Molecular Biology › Molecular Biology › Gut microbiota and health
- Health Sciences › Medicine › Oncology › Drug Transport and Resistance Mechanisms
- Physical Sciences › Chemistry › Organic Chemistry › Steroid Chemistry and Biochemistry
- Keywords
- bile salt hydrolase, bile acid metabolism, Bacteroides fragilis, gut microbiota, infant gut colonization, pregnane X receptor, aryl hydrocarbon receptor, ligand-activated transcription factors, Escherichia coli
- MeSH terms
- Gastrointestinal Microbiome, Pregnane X Receptor, Acyltransferases, Amidohydrolases, Amines, Bacteroides fragilis, Bile Acids and Salts, Escherichia coli, Humans, Infant, Ligands, Transcription Factors, Cohort Studies, Receptors, Aryl Hydrocarbon, Cell Culture Techniques, Biocatalysis
About these checks
Registry, retraction, Cites and statistics results are computed, not judged, with one exception: a printed reference that no index lists is read once by a model before it counts as a citation error. Claims are extracted by a model and kept only when their quote appears verbatim in the text; each cited source is then checked, with a model’s help, for whether it says what the claim relies on. Those verdicts can be wrong — read the claim’s quote and the cited source before relying on one.
A language model drew the claims from the paper on 2026-10-11, under version 3 of the claim definition (model deepseek-v4.1-flash, prompt extract-v3).
A second model labelled each claim on 2026-10-11 (model jev-1.13-20260917, definition revision gold-guideline-v0.2).
Cited sources are checked with a language model’s help (gpt-6-sol).
Statistics and arithmetic are recomputed, not judged.
Confidence bands are shown only for fields calibrated on our annotated test set. None is calibrated yet, so no band is shown.
What counts as a claim ›How we measure confidence ›How we check this ›
Are you an author, or do you see a problem with this page? Request a review
