

The DOI matches its Crossref record; 7 of the 7 references it cites were found in a registry or an index.
LABKIT: Labeling and Segmentation Toolkit for Big Image Data
Published version of a preprint
Abstract
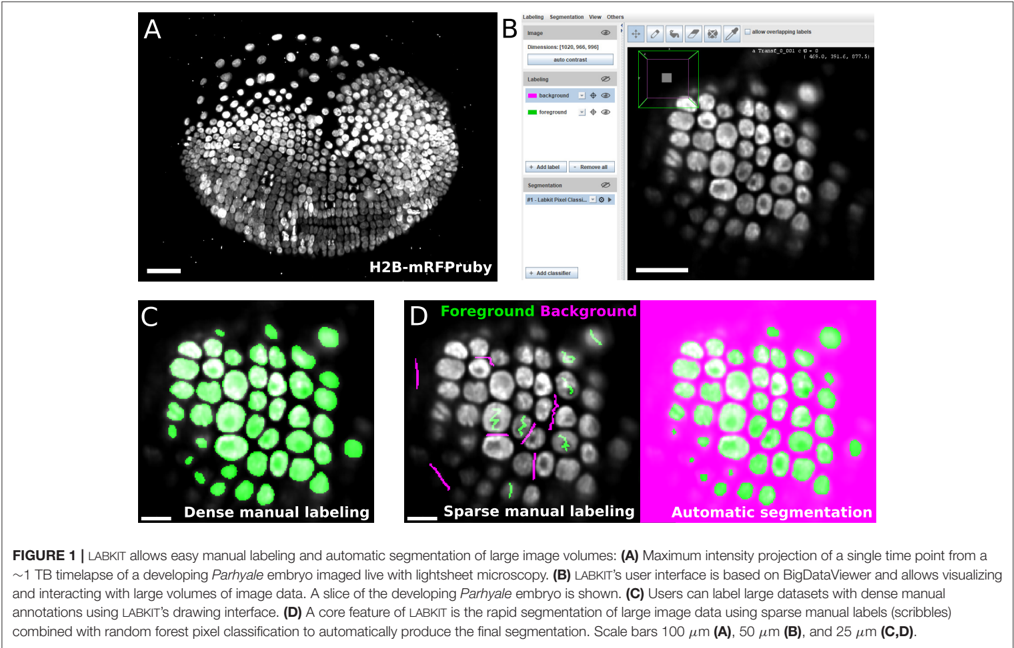
We present LABKIT, a user-friendly Fiji plugin for the segmentation of microscopy image data. It offers easy to use manual and automated image segmentation routines that can be rapidly applied to single- and multi-channel images as well as to timelapse movies in 2D or 3D. LABKIT is specifically designed to work efficiently on big image data and enables users of consumer laptops to conveniently work with multiple-terabyte images. This efficiency is achieved by using ImgLib2 and BigDataViewer as well as a memory efficient and fast implementation of the random forest based pixel classification algorithm as the foundation of our software. Optionally we harness the power of graphics processing units (GPU) to gain additional runtime performance. LABKIT is easy to install on virtually all laptops and workstations. Additionally, LABKIT is compatible with high performance computing (HPC) clusters for distributed processing of big image data. The ability to use pixel classifiers trained in LABKIT via the ImageJ macro language enables our users to integrate this functionality as a processing step in automated image processing workflows. Finally, LABKIT comes with rich online resources such as tutorials and examples that will help users to familiarize themselves with available features and how to best use LABKIT in a number of practical real-world use-cases.
Overview
The claims and statistics of this paper haven’t been checked yet.
Run the check — free, no account needed. It reads the open-access text and checks the sources it cites.
Integrity signals
Registry
Cites
Statistics
Figures
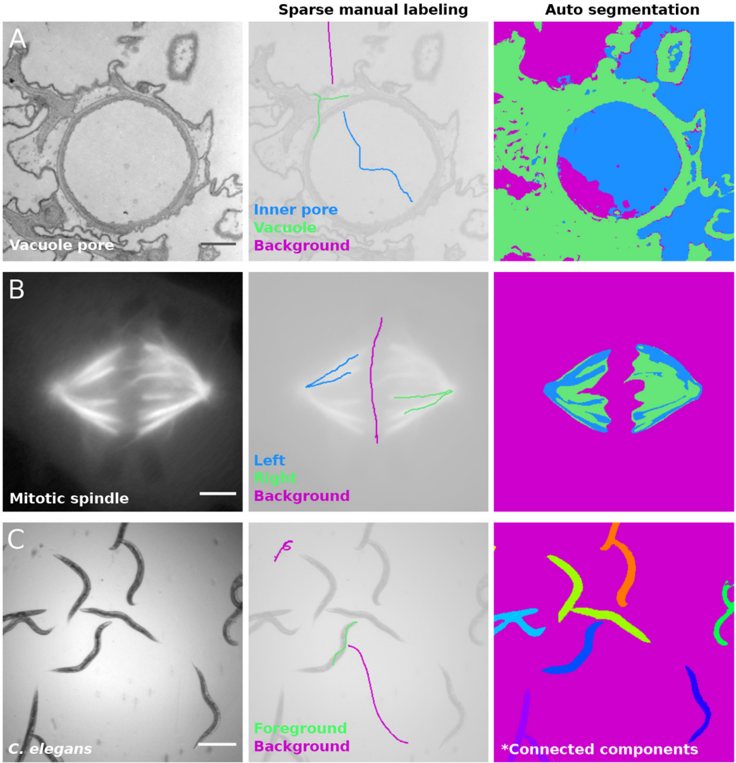
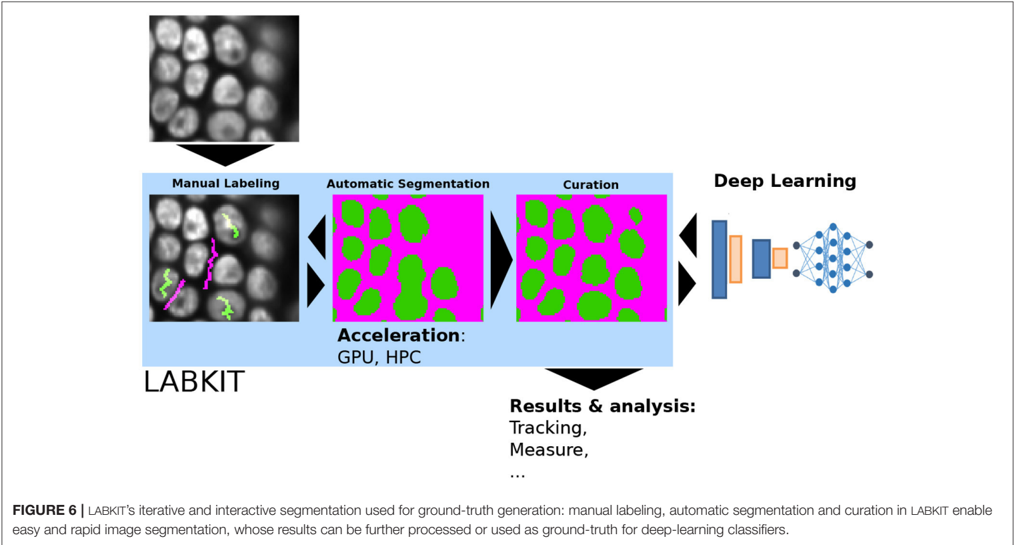
Verification
Claims the paper makes
The claims and statistics of this paper haven’t been checked yet.
Run the check — free, no account needed. It reads the open-access text and checks the sources it cites.
Claims other papers make about this one
Each is checked against this paper’s own text: does it say what the citing paper says it does?
In the citing paper
“Weka, an open-source software tool that enables users to perform ML-based image segmentation, object classification, and feature extraction with minimal programming experience,33-35 has been widely used in biological and clinical research to quantitatively analyze various types of microorganisms, cells, and tissues.36-40”
From SEMTWIST Quantification of Biofilm Infection in Human Chronic Wound Using Scanning Electron Microscopy and Machine Learning (2025) · cites this paper as [34]
Self-check
Percentages, sums and reported differences re-computed from the paper’s own numbers.
The self-check needs the paper’s full text.
Citations
Cites
Fiji: an open-source platform for biological-image analysis
Schindelin, J., Arganda-Carreras, I., Frise, E., Kaynig, V., Longair, M., Pietzsch, T., Preibisch, S., Rueden, C., Saalfeld, S., Schmid, B., et al. (2012) · Nature Methods · doi:10.1038/nmeth.2019 · Cited by 66,890
Self-citationNIH Image to ImageJ: 25 years of image analysis
Schneider, C. A., Rasband, W. S., & Eliceiri, K. W. (2012) · Nature Methods · doi:10.1038/nmeth.2089 · Cited by 64,638
Ror2 signaling regulates Golgi structure and transport through IFT20 for tumor invasiveness
Nishita, M., Park, S.-Y., Nishio, T., Kamizaki, K., Wang, Z., Tamada, K., Takumi, T., Hashimoto, R., Otani, H., Pazour, G. J., et al. (2017) · Scientific Reports · doi:10.1038/s41598-016-0028-x · Cited by 15,947
QuPath: Open source software for digital pathology image analysis
Bankhead, P., Loughrey, M. B., Fernández, J. A., Dombrowski, Y., McArt, D. G., Dunne, P. D., McQuaid, S., Gray, R. T., Murray, L. J., Coleman, H. G., et al. (2017) · Scientific Reports · doi:10.1038/s41598-017-17204-5 · Cited by 8,908
Serial Block-Face Scanning Electron Microscopy to Reconstruct Three-Dimensional Tissue Nanostructure
Denk, W., & Horstmann, H. (2004) · PLoS Biology · doi:10.1371/journal.pbio.0020329 · Cited by 1,644
Nucleus segmentation across imaging experiments: the 2018 Data Science Bowl
Caicedo, J. C., Goodman, A., Karhohs, K. W., Cimini, B. A., Ackerman, J., Haghighi, M., Heng, C., Becker, T., Doan, M., McQuin, C., et al. (2019) · Nature Methods · doi:10.1038/s41592-019-0612-7 · Cited by 809
Luo, X., Wang, G., Song, T., Zhang, J., Aertsen, M., Deprest, J., Ourselin, S., Vercauteren, T., & Zhang, S. (2021) · Medical Image Analysis · doi:10.1016/j.media.2021.102102 · Cited by 126
Research works printed but not linked: 44
- Alemi Koohbanani, 2020, Nuclick: a deep learning framework for interactive segmentation of microscopic images, Med. Image Anal, 65, 101771, 10.1016/j.media.2020.101771 · DOI · Paper page
- Arganda-Carreras, 2017, Trainable weka segmentation: a machine learning tool for microscopy pixel classification, Bioinformatics, 33, 2424, 10.1093/bioinformatics/btx180 · DOI · Paper page
- Arshadi, 2021, SNT: a unifying toolbox for quantification of neuronal anatomy, Nat. Methods, 18, 374, 10.1038/s41592-021-01105-7 · DOI
- Baltissen, 2018, Comparison of segmentation methods for tissue microscopy images of glioblastoma cells, 396, 10.1109/ISBI.2018.8363601 · DOI
- Berg, 2019, Ilastik: interactive machine learning for (bio) image analysis, Nat. Methods, 16, 1226, 10.1038/s41592-019-0582-9 · DOI
- Betzig, 2006, Imaging intracellular fluorescent proteins at nanometer resolution, Science, 313, 1642, 10.1126/science.1127344 · DOI
- Bornes, 2021, Scratch-induced partial skin wounds re-epithelialize by sheets of independently migrating keratinocytes, Life Sci. Alliance, 4, e202000765, 10.26508/lsa.202000765 · DOI
- Breiman, 2001, Random forests, Mach. Learn, 45, 5, 10.1023/A:1010933404324 · DOI · Paper page
- Buchholz, 2020, DenoiSeg: joint denoising and segmentation. arXiv:2005.02987 [cs] · arXiv
- Dodt, 2007, Ultramicroscopy: three-dimensional visualization of neuronal networks in the whole mouse brain, Nat. Methods, 4, 331, 10.1038/nmeth1036 · DOI
- Folk, 2011, An overview of the hdf5 technology suite and its applications, 36, 10.1145/1966895.1966900 · DOI
- Gustafsson, 2000, Surpassing the lateral resolution limit by a factor of two using structured illumination microscopy, J. Microsc, 198, 82, 10.1046/j.1365-2818.2000.00710.x · DOI · Paper page
- Haase, 2020, Clij: Gpu-accelerated image processing for everyone, Nat. Methods, 17, 5, 10.1038/s41592-019-0650-1 · DOI
- Hama, 2011, Scale: a chemical approach for fluorescence imaging and reconstruction of transparent mouse brain, Nat. Neurosci, 14, 1481, 10.1038/nn.2928 · DOI
- Hell, 1994, Breaking the diffraction resolution limit by stimulated emission: stimulated-emission-depletion fluorescence microscopy, Opt. Lett, 19, 780, 10.1364/OL.19.000780 · DOI
- Hess, 2006, Ultra-high resolution imaging by fluorescence photoactivation localization microscopy, Biophys. J, 91, 4258, 10.1529/biophysj.106.091116 · DOI
- Hörl, 2019, Bigstitcher: reconstructing high-resolution image datasets of cleared and expanded samples, Nat. Methods, 16, 870, 10.1038/s41592-019-0501-0 · DOI
- Horlava, 2020, A comparative study of semi- and self-supervised semantic segmentation of biomedical microscopy data. arXiv:2011.08076 [cs, stat] · arXiv
- Huisken, 2004, Optical sectioning deep inside live embryos by selective plane illumination microscopy, Science, 305, 1007, 10.1126/science.1100035 · DOI
- Icha, 2016, Using light sheet fluorescence microscopy to image zebrafish eye development, J. Vis. Exp, 110, e53966, 10.3791/53966 · DOI
- Jain, 2020, Regionalized tissue fluidization is required for epithelial gap closure during insect gastrulation, Nat. Commun, 11, 5604, 10.1038/s41467-020-19356-x · DOI
- Jordan, 2019, Chapter 9-In situ cryo-electron tomography and subtomogram averaging of intraflagellar transport trains, 179, 10.1016/bs.mcb.2019.04.005 · DOI
- Knott, 2008, Serial section scanning electron microscopy of adult brain tissue using focused ion beam milling, J. Neurosci, 28, 2959, 10.1523/JNEUROSCI.3189-07.2008 · DOI · Paper page
- Lalit, 2021, Embedding-based Instance Segmentation in Microscopy. arXiv:2101.10033 [cs, eess] · arXiv
- Leite, 2021, Paintera
- Linkert, 2010, Metadata matters: access to image data in the real world, J. Cell Biol, 189, 777, 10.1083/jcb.201004104 · DOI
- Mais, 2020, Patchperpix for instance segmentation, 288, 10.1007/978-3-030-58595-2_18 · DOI
- Maninis, 2018, Deep extreme cut: From extreme points to object segmentation, 616, 10.1109/CVPR.2018.00071 · DOI
- Maška, 2014, A benchmark for comparison of cell tracking algorithms, Bioinformatics, 30, 1609, 10.1093/bioinformatics/btu080 · DOI · Paper page
- McQuin, 2018, Cellprofiler 3.0: Next-generation image processing for biology, PLoS Biol, 16, e2005970, 10.1371/journal.pbio.2005970 · DOI
- Morone, 2020, Deep learning approach for quantification of organelles and misfolded polypeptide delivery within degradative compartments, Mol. Biol.Cell, 31, 1512, 10.1091/mbc.E20-04-0269 · DOI
- 2019, napari: A Multi-Dimensional Image Viewer For Python
- Pietzsch, 2012, Imglib2–generic image processing in java, Bioinformatics, 28, 3009, 10.1093/bioinformatics/bts543 · DOI
- Pietzsch, 2015, Bigdataviewer: visualization and processing for large image data sets, Nat. Methods, 12, 481, 10.1038/nmeth.3392 · DOI
- Preibisch, 2014, Efficient Bayesian-based multiview deconvolution, Nat. Methods, 11, 645, 10.1038/nmeth.2929 · DOI
- Rueden, 2017, Imagej2: imagej for the next generation of scientific image data, BMC Bioinformatics, 18, 529, 10.1186/s12859-017-1934-z · DOI
- Rust, 2006, Sub-diffraction-limit imaging by stochastic optical reconstruction microscopy (storm), Nat. Methods, 3, 793, 10.1038/nmeth929 · DOI
- Schmidt, 2018, Cell detection with star-convex polygons, 265
- Stringer, 2021, Cellpose: a generalist algorithm for cellular segmentation, Nat. Methods, 18, 100, 10.1038/s41592-020-01018-x · DOI · Paper page
- Tischer, 2020, Bigdataprocessor2: a free and open-source fiji plugin for inspection and processing of tb sized image data, bioRxiv, 10.1101/2020.09.23.244095 · DOI
- Ulman, 2017, An objective comparison of cell-tracking algorithms, Nat. Methods, 14, 1141, 10.1038/nmeth.4473 · DOI
- Wolff, 2018, Multi-view light-sheet imaging and tracking with the mamut software reveals the cell lineage of a direct developing arthropod limb, Elif, 7, e34410, 10.7554/eLife.34410 · DOI
- Wolny, 2020, Accurate and versatile 3d segmentation of plant tissues at cellular resolution, Elife, 9, e57613, 10.7554/eLife.57613 · DOI
- Zhang, 2020, Interactive object segmentation with inside-outside guidance, 12231, 10.1109/CVPR42600.2020.01225 · DOI · Paper page
Cited by
Sorted by citations
Preman, P., Moechars, D., Fertan, E., Wolfs, L., Serneels, L., Shah, D., Lamote, J., Poovathingal, S., Snellinx, A., Mancuso, R., et al. (2024) · EMBO Molecular Medicine · doi:10.1038/s44321-024-00162-7 · Cited by 32
Tian, Y., Johnson, G. A., Williams, R. W., & White, L. E. (2023) · Frontiers in Neuroscience · doi:10.3389/fnins.2023.1223226 · Cited by 9
Singh, S., Muniz De Oliveira, F., Wang, C., Kumar, M., Xuan, Y., DeMazumder, D., Sen, C. K., & Roy, S. (2025) · Advances in Wound Care · doi:10.1089/wound.2024.0291 · Cited by 6
Metadata
- Authors
- Arzt, M., Deschamps, J., Schmied, C., Pietzsch, T., Schmidt, D., Tomancak, P., Haase, R., & Jug, F.
- Venue
- Frontiers in Computer Science
- Publisher
- Frontiers Media SA
- Published
- 2022-02-10
- Volume
- 4
- ISSN
- 2624-9898
- Cited by
- 405
- References
- 7
- Funders
- Max-Planck-Gesellschaft (M.IF.A.MOZG8106)
- Bundesministerium für Bildung und Forschung (01IS18026C, 031L0102)
- Deutsche Forschungsgemeinschaft (EXC2068, JU3110/1-1, TO563/8-1)
- European Regional Development Fund (CZ.02.1.01/0.0/0.0/16_013/0001791)
About these checks
Registry, retraction, Cites and statistics results are computed, not judged, with one exception: a printed reference that no index lists is read once by a model before it counts as a citation error. Claims are extracted by a model and kept only when their quote appears verbatim in the text; each cited source is then checked, with a model’s help, for whether it says what the claim relies on. Those verdicts can be wrong — read the claim’s quote and the cited source before relying on one.
Statistics and arithmetic are recomputed, not judged.
Confidence bands are shown only for fields calibrated on our annotated test set. None is calibrated yet, so no band is shown.
What counts as a claim ›How we measure confidence ›How we check this ›
Are you an author, or do you see a problem with this page? Request a review
