

The DOI matches its Crossref record; 63 of the 63 references it cites were found in a registry or an index; 43 of the 65 sources its claims cite were checked for support.
Intravitreal AAV vector delivery induces integrin-dependent ocular inflammation, complement activation, and antiviral and DNA damage responses
Open accessAbstract
Background: Intravitreal delivery of adeno-associated virus (AAV) vectors offers a promising, minimally invasive strategy for retinal gene therapy, but remains limited by dose-dependent intraocular inflammation. Corticosteroid therapy, the current standard for managing gene therapy-associated uveitis (GTAU), can be ineffective or contraindicated, highlighting the need for alternative immunomodulatory approaches and deeper understanding of AAV-induced inflammation. Methods: Using porcine and mice models, we characterized immune responses triggered by AAV2.7m8 vector. Results: Consistent with previous data for this serotype, AAV-mediated transgene expression localized predominantly to retinal ganglion cells, although photoreceptor, bipolar, amacrine, horizontal, and glia cells were also transduced. Despite prophylactic methylprednisolone, AAV-treated animals developed GTAU, accompanied by increased MCP-1, IP-10, MIP-1α and IL-6 levels in ocular humors, along with microglial activation and peripheral leukocyte infiltration. Transcriptomic analysis revealed upregulation of antiviral interferon responses across all retinal cell populations, together with complement and DNA damage pathways. Accordingly, functional assays confirmed complement C3a accumulation in ocular humors and presence of γH2AX + DNA damage foci in transduced retinas. Finally, a mechanistic study of intravitreal AAV delivery in mice using integrin-blocking antibodies revealed a role for peripheral leukocytes in mediating ocular inflammation in this species. Conclusion: Our work identified new markers of ocular inflammation and potential targets to modulate GTAU.
Overview
CoChat Summary
TL;DR
Intravitreal AAV2.7m8 delivery in pigs induced gene therapy-associated uveitis despite prophylactic methylprednisolone, with complement activation, antiviral interferon and DNA damage responses, microglial activation, and peripheral leukocyte infiltration. In mice, dual integrin blockade with anti-LFA-1/VLA-4 antibodies prevented leukocyte infiltration, reduced inflammatory chemokines, and increased transgene expression.
Key findings
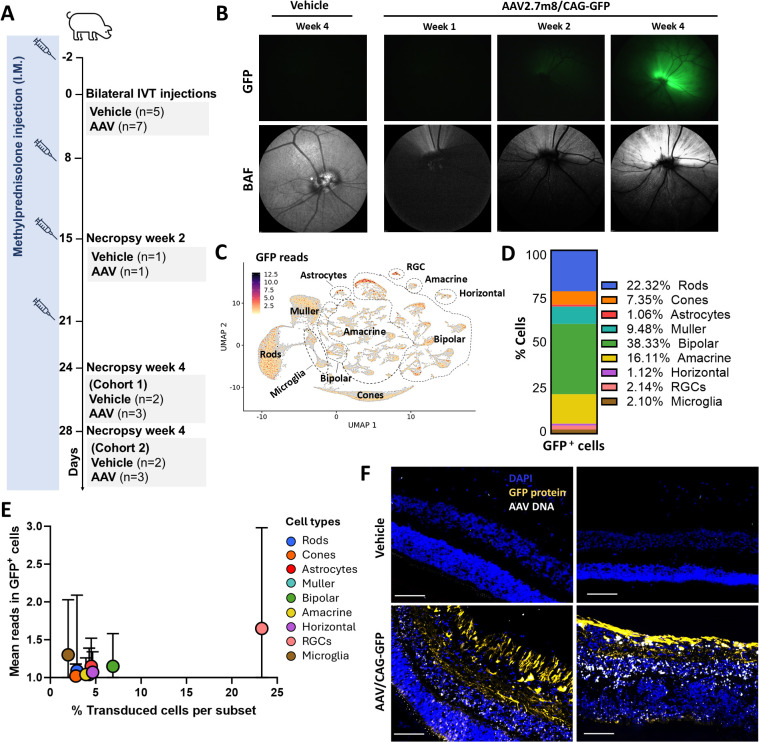
- In pigs, bilateral IVT AAV2.7m8/CAG-GFP at 5×10¹¹ vg/eye (n = 7) versus vehicle (n = 5) transduced all retinal layers, with strongest GFP signal in the GCL; 70.65% ± 7.78 of Brn3a+ RGCs were GFP+, and snRNAseq showed GFP+ nuclei most abundant among bipolar (38.3%), rod (22.3%), and amacrine cells (16.1%).
- Despite weekly systemic methylprednisolone, AAV-treated pigs developed uveitis, complement C3a elevation in aqueous humor as early as week 1 and vitreous humor at week 4, and increased MCP-1/IP-10 in AH by week 1 and VH by week 2, with later IL-6 and MIP-1α increases.
- snRNAseq showed upregulated interferon, IL-6, TNFα, apoptosis, and complement pathways across retinal populations, plus p53/DNA damage response in Müller and bipolar cells at week 2 extending to astrocytes, horizontal cells, RGCs, and microglia by week 4; γH2AX+ foci were confirmed across retinal layers by week 4.
- In mice, IVT AAV2.7m8/CAG-GFP at 1×10⁹ vg/eye caused CD45+ monocyte and dendritic cell accumulation by 2 weeks and lymphocyte infiltration by 4 weeks; anti-LFA-1/VLA-4 blockade prevented infiltration of affected immune populations, reduced vitreous IP-10 and MCP-1, and was associated with higher GFP mean fluorescence intensity.
Methods
- Pigs: female Yucatan minipigs, 3–5 months old, pre-screened for anti-AAV2.7m8 neutralizing antibodies, received bilateral IVT AAV2.7m8/CAG-GFP or AAV2.7m8/CAG-hFIX at 5×10¹¹ vg/eye or vehicle, with intramuscular methylprednisolone 5 mg/kg two days before and weekly thereafter; readouts included ocular exams, OCT/BAF, fundus imaging, AH/VH cytokine and C3a assays, anti-AAV IgG ELISA, flow cytometry, immunofluorescence, RNAscope, and snRNAseq.
- Mice: female C57BL/6J mice, 8–12 weeks old, received bilateral IVT vehicle or AAV2.7m8/CAG-GFP at 1×10⁹ vg/eye; an additional group received intraperitoneal anti-VLA-4/LFA-1 antibodies on day 0 and every 3 days until day 28; readouts included fundus imaging, flow cytometry of ocular homogenates, and vitreous cytokine analysis.
- Analysis: snRNAseq was processed with Cellranger and Seurat, integrated with SCTransform, clustered with Louvain, and analyzed by differential expression and GSEA using Hallmark gene sets; statistics used GraphPad Prism 10 with one-way ANOVA/Tukey, Mann-Whitney, or Welch’s t-test as indicated.
Limitations
- The paper states that species-specific features of the porcine immune system warrant further validation, that the positive effect of inhibiting immune cell infiltration in mice may be limited in larger species, and that no single dominant trigger of AAV immunogenicity was identified.
- The paper states that further studies are needed to confirm whether DNA damage response leads to apoptosis and cell death, and that GFP transgene expression quantification from mouse color fundus images is subject to technical limitations and multiple sources of variation.
- The paper notes that absence of significant T cell infiltration in pig retinas could be due to steroid treatment in pigs but not mice, or to interspecies differences; evident from the text, group sizes were small, some pigs were sacrificed prematurely due to inflammation, and one AAV-injected animal received topical corticosteroids.
Model-written summary. Check it against the paper before relying on it.
Integrity signals
Registry
Cites
Statistics
Figures



Verification
Claims the paper makes
21 Valid · 1 Not valid · 6 Not checked · 85 Own results and interpretations
Every source the paper cites for this claim was checked and supports it.
In the paper
“On the other hand, studies in non-human primates (NHPs) have shown that IVT AAV2 administration at the dose of 5×10¹¹ vg/eye can induce uveitis in the presence of prophylactic systemic methylprednisolone (30).”
§ Intravitreal AAV vector delivery induces integrin-dependent ocular inflammation, complement activation, and antiviral and DNA damage responses > Introduction
What the sources say
- Supportedcites [30] Chan, 2021, Engineering adeno-associated viral vectors to evade innate immune and inflammatory responses, Sci Transl Med source
The Results section on intravitreal AAV2 in non-human primates reports clinical uveitis at 5 × 10¹¹ vg and says prophylactic systemic steroids delayed, but did not reduce the incidence of, uveitis. The NHP Methods section identifies the prophylactic treatment as intramuscular methylprednisolone on Days −1 and 6 and specifies dosing per eye. (LLM, conf=0.94)
plainstates a cause- Asserted: passes — The authors put it forward as true.
- Checkable: passes — It can be checked against evidence.
- Load-bearing: passes — The paper’s conclusions depend on it.
- Based: passes — The paper gives a reason why it holds.
- Supported
The cited sources support only part of this claim — read each source’s verdict below.
In the paper
“Preclinical investigations utilizing mice have limited utility in predicting severe adverse events”
§ Intravitreal AAV vector delivery induces integrin-dependent ocular inflammation, complement activation, and antiviral and DNA damage responses > Introduction
What the sources say
- Partly supportedcites [30] Chan, 2021, Engineering adeno-associated viral vectors to evade innate immune and inflammatory responses, Sci Transl Med sourceExperimental — accuracy not yet measured
The Discussion (page unavailable) reports less benefit from the engineered vector after intravitreal delivery in nonhuman primates than in mouse models, showing a limitation in extrapolating those mouse findings. It does not assess whether mouse investigations can predict severe adverse events generally, so the claim is broader than the evidence. (LLM, conf=0.78)
- Partly supportedcites [32] Clare, 2025, Characterization of the ocular inflammatory response to AAV reveals divergence by sex and age, Mol Ther sourceExperimental — accuracy not yet measured
The Discussion (page not available) says age and sex have been largely neglected in preclinical development and calls for stratifying preclinical data to better mitigate risk. That supports a limitation of existing investigations, but the paper does not establish that mouse studies have limited ability to predict severe adverse events. (LLM, conf=0.78)
- Partly supportedcites [33] Tummala, 2021, Characterization of gene therapy associated uveitis following intravitreal adeno-associated virus injection in mice, Invest Ophthalmol Vis Sci sourceExperimental — accuracy not yet measured
The Discussion (page unavailable) acknowledges limitations of the murine model for human eye disease and calls for studies in larger animals and nonhuman primates. It does not specifically say that mouse studies have limited utility for predicting severe adverse events from intravitreal AAV; the paper instead describes the model as useful for studying AAV-associated inflammation. (LLM, conf=0.84)
- Partly supportedcites [34] Wiley, 2023, The degree of adeno-associated virus-induced retinal inflammation varies based on serotype and route of delivery: Intravitreal, subretinal, or suprachoroidal, Hum Gene Ther sourceExperimental — accuracy not yet measured
The Discussion (page unavailable) says species-specific differences make it difficult to translate animal-model findings about adverse effects to humans. It also notes that rats, rather than murine models, are the authors’ preferred model for preclinical toxicity testing. The paper does not specifically establish that mouse studies have limited utility for predicting severe adverse events from intravitreal AAV. (LLM, conf=0.84)
plain- Asserted: passes — The authors put it forward as true.
- Checkable: passes — It can be checked against evidence.
- Load-bearing: passes — The paper’s conclusions depend on it.
- Based: passes — The paper gives a reason why it holds.
- Partly supported
The cited sources support only part of this claim — read each source’s verdict below.
In the paper
“As expected from previous reports (11), most animals developed anti-AAV2.7m8 IgG antibodies, which were detectable in both VH and AH samples independent of the uveitis scores (Figure 1E).”
§ Intravitreal AAV vector delivery induces integrin-dependent ocular inflammation, complement activation, and antiviral and DNA damage responses > Results > Preliminary assessment of IVT gene transfer in pigs shows early inflammation post-AAV injection
What the sources say
- Partly supportedcites [11] Reichel, 2018, Humoral immune response after intravitreal but not after subretinal AAV8 in primates and patients, Invest Ophthalmol Vis Sci sourceExperimental — accuracy not yet measured
The Results (p. 1) report that all intravitreally injected nonhuman primates had rising anti-AAV8 antibody titers, supporting the cited expectation of an antibody response after injection. The source studied AAV8 in primates and measured plasma antibodies, not anti-AAV2.7m8 IgG in pigs or its detection in vitreous and aqueous humor. The Discussion (p. 4) notes no clinically relevant inflammation despite antibody rises, but does not assess independence from uveitis scores. (LLM, conf=0.86)
plain- Asserted: passes — The authors put it forward as true.
- Checkable: passes — It can be checked against evidence.
- Load-bearing: unclear — It is unclear whether the paper’s conclusions depend on it.
- Based: passes — The paper gives a reason why it holds.
- Partly supported
The sources with a verdict support this claim; the rest weren’t checked yet, have no full text we could read, or their verdicts aren’t rated yet.
In the paper
“Moreover, Iba1+ cells from injected animals showed upregulated Swine Leukocyte Antigen (SLA) major histocompatibility complex (MHC) class II DR molecules (SLA-DR) (Figures 5D, F, G), consistent with microglia activation and in line with previous studies of subretinal and IVT AAV delivery in animal models (13, 34).”
§ Intravitreal AAV vector delivery induces integrin-dependent ocular inflammation, complement activation, and antiviral and DNA damage responses > Results > IVT AAV administration results in pro-inflammatory microglia accumulation in pig retinas
What the sources say
- Not checked — no full text of the sourcecites [13] Reichel, 2017, AAV8 can induce innate and adaptive immune response in the primate eye, Mol Ther source
- Supportedcites [34] Wiley, 2023, The degree of adeno-associated virus-induced retinal inflammation varies based on serotype and route of delivery: Intravitreal, subretinal, or suprachoroidal, Hum Gene Ther source
In the Results section, the cited study reports Iba1-positive retinal inflammation after intravitreal and subretinal AAV delivery and describes the rounded Iba1-positive cells as indicative of activated microglia or infiltrating monocytes. The citation supports the comparison with prior animal-model findings; the pig SLA-DR result is presented as the citing authors’ own finding in Figures 5D, F, and G. (LLM, conf=0.88)
plainstates an association- Asserted: passes — The authors put it forward as true.
- Checkable: passes — It can be checked against evidence.
- Load-bearing: passes — The paper’s conclusions depend on it.
- Based: passes — The paper gives a reason why it holds.
The cited sources support only part of this claim — read each source’s verdict below.
In the paper
“Additionally, persistent inflammation has been observed in patients receiving high doses of both AAV2 or AAV2.7m8, despite steroid treatment (27, 30).”
§ Intravitreal AAV vector delivery induces integrin-dependent ocular inflammation, complement activation, and antiviral and DNA damage responses > Introduction
What the sources say
- Supportedcites [27] Khanani, 2024, Safety and efficacy of ixoberogene soroparvovec in neovascular age-related macular degeneration in the United States (OPTIC): A prospective, two-year, multicentre phase 1 study, eClinicalMedicine source
The Results (Safety outcomes and primary endpoint; page unavailable) report that inflammation in the higher-dose group fluctuated but remained present over the two-year study, and 7 of 15 participants still required topical corticosteroids at completion. The Discussion identifies ixo-vec as using an AAV2.7m8 capsid. This source supports the AAV2.7m8 part of the multi-citation sentence; it describes inflammation as responsive to corticosteroids, not resistant to them. (LLM, conf=0.88)
- Partly supportedcites [30] Chan, 2021, Engineering adeno-associated viral vectors to evade innate immune and inflammatory responses, Sci Transl Med sourceExperimental — accuracy not yet measured
The Results section (page unavailable) reports dose-dependent uveitis after high-dose AAV2 administration in macaques; prophylactic steroids delayed it but did not prevent it. This does not establish persistent inflammation in patients, and the cited study does not report an AAV2.7m8 patient group. It also says animals with uveitis received steroids until the inflammation resolved. (LLM, conf=0.86)
plainstates an association- Asserted: passes — The authors put it forward as true.
- Checkable: passes — It can be checked against evidence.
- Load-bearing: passes — The paper’s conclusions depend on it.
- Based: passes — The paper gives a reason why it holds.
- Supported
60 more claims · 3 with their cited sources checked
Create a free account to see all 113 claims and to verify the 1 reference still open.
- It may state two separate claims as one. 32
- Probably not a substantial claim. 14
- The quote only partly states this claim. 4
Self-check
Percentages, sums and reported differences re-computed from the paper’s own numbers.
Each contradiction between two passages listed here was confirmed by an independent check.
Rated major: it would touch a result — a value a result rests on, reported and recomputed p-values on opposite sides of the significance level, two passages that conflict with no sign which is right, or a cited work retracted before this paper was published.
In the paper
§ Intravitreal AAV vector delivery induces integrin-dependent ocular inflammation, complement activation, and antiviral and DNA damage responses > Materials and methods > Viral vectors
“Vector titers were 3.68×10¹² vg/mL for the AAV2.7m8/CAG-GFP vector”
§ Intravitreal AAV vector delivery induces integrin-dependent ocular inflammation, complement activation, and antiviral and DNA damage responses > Materials and methods > Intravitreal AAV injections in pigs
“On day 0, animals received 100 µL/eye bilateral IVT injection of 5x10¹¹ vg/eye AAV2.7m8/CAG-GFP (n = 7) or vehicle buffer (n = 5).”
Rated minor: it would not touch a result — a value no result rests on, a p-value that stays on the same side of the significance level, or a conflict that is clerical, resolved elsewhere in the paper, or outside its own findings.
In the paper
§ Intravitreal AAV vector delivery induces integrin-dependent ocular inflammation, complement activation, and antiviral and DNA damage responses > Materials and methods > Intravitreal AAV injections in pigs
“another cohort received bilateral IVT injections of 5x10¹¹ vg/eye of AAV2.7m8/CAG-FIX (n = 3) or vehicle (n = 1)”
§ Intravitreal AAV vector delivery induces integrin-dependent ocular inflammation, complement activation, and antiviral and DNA damage responses > Results > Preliminary assessment of IVT gene transfer in pigs shows early inflammation post-AAV injection
“Animals, pre-selected for the lack of AAV2.7m8 neutralizing antibodies, received bilateral IVT injections of AAV2.7m8 (n = 3, 5×10¹¹ vg/eye) encoding human coagulation factor IX (hFIX), used here as a model transgene, or vehicle (n = 2).”
Rated minor: it would not touch a result — a value no result rests on, a p-value that stays on the same side of the significance level, or a conflict that is clerical, resolved elsewhere in the paper, or outside its own findings.
In the paper
§ Intravitreal AAV vector delivery induces integrin-dependent ocular inflammation, complement activation, and antiviral and DNA damage responses > Materials and methods > Statistical analysis
“***p <0.001”
§ Intravitreal AAV vector delivery induces integrin-dependent ocular inflammation, complement activation, and antiviral and DNA damage responses > Materials and methods > Statistical analysis
“***p <0.0001”
Citations
Cites
ATM Activation by DNA Double-Strand Breaks Through the Mre11-Rad50-Nbs1 Complex
Lee, J.-H., & Paull, T. T. (2005) · Science · doi:10.1126/science.1108297 · Cited by 1,424
How does p53 induce apoptosis and how does this relate to p53-mediated tumour suppression
Aubrey, B. J., Kelly, G. L., Janic, A., Herold, M. J., & Strasser, A. (2018) · Cell Death & Differentiation · doi:10.1038/cdd.2017.169 · Cited by 1,395
Adeno-associated virus as a delivery vector for gene therapy of human diseases
Wang, J.-H., Gessler, D. J., Zhan, W., Gallagher, T. L., & Gao, G. (2024) · Signal Transduction and Targeted Therapy · doi:10.1038/s41392-024-01780-w · Cited by 904
Dalkara, D., Byrne, L. C., Klimczak, R. R., Visel, M., Yin, L., Merigan, W. H., Flannery, J. G., & Schaffer, D. V. (2013) · Science Translational Medicine · doi:10.1126/scitranslmed.3005708 · Cited by 734 · cited 1×
“7m8, which offers improved retinal penetration (25, 26).”
AAV Vector Immunogenicity in Humans: A Long Journey to Successful Gene Transfer
Costa Verdera, H., Kuranda, K., & Mingozzi, F. (2020) · Molecular Therapy · doi:10.1016/j.ymthe.2019.12.010 · Cited by 641
Self-citationYusuf‐Makagiansar, H., Anderson, M. E., Yakovleva, T. V., Murray, J. S., & Siahaan, T. J. (2002) · Medicinal Research Reviews · doi:10.1002/med.10001 · Cited by 408
Martin, K. R. G., Quigley, H. A., Zack, D. J., Levkovitch-Verbin, H., Kielczewski, J., Valenta, D., Baumrind, L., Pease, M. E., Klein, R. L., & Hauswirth, W. W. (2003) · Investigative Opthalmology & Visual Science · doi:10.1167/iovs.02-1332 · Cited by 362 · cited 6×
“…delivery via intravitreal (IVT) injection is a minimally invasive procedure that offers the potential for broad inner retinal transduction, providing signi fi cant transgene expression in the ganglion cell layer (GCL) (10, 14 – 17), and in particular in retinal ganglion cells (RGCs) (17 – 20).”
InfluentialGetts, D. R., Terry, R. L., Getts, M. T., Müller, M., Rana, S., Shrestha, B., Radford, J., Van Rooijen, N., Campbell, I. L., & King, N. J. C. (2008) · The Journal of Experimental Medicine · doi:10.1084/jem.20080421 · Cited by 360
Ayuso, E., Mingozzi, F., Montane, J., Leon, X., Anguela, X. M., Haurigot, V, Edmonson, S. A., Africa, L., Zhou, S., High, K. A., et al. (2010) · Gene Therapy · doi:10.1038/gt.2009.157 · Cited by 272
Self-citationEngineering adeno-associated viral vectors to evade innate immune and inflammatory responses
Chan, Y. K., Wang, S. K., Chu, C. J., Copland, D. A., Letizia, A. J., Costa Verdera, H., Chiang, J. J., Sethi, M., Wang, M. K., Neidermyer, W. J., et al. (2021) · Science Translational Medicine · doi:10.1126/scitranslmed.abd3438 · Cited by 215
Self-citation
Research works printed but not linked: 3
- Buckley, 2024, Meta-analysis of gene therapy associated uveitis (GTAU), Invest Ophthalmol Visual Sci, 65, 5312
- Chandler, 2019, Enhancement of adeno-associated virus-mediated gene therapy using hydroxychloroquine in murine and human tissues, Mol Ther Methods Clin Dev, 14, 77, 10.1016/j.omtm.2023.01.001 · DOI · Paper page
- Kropf, 2024, C3 Complement Inhibitor Limits Transaminitis and Immune Response Following Liver Targeted Adeno-Associated Virus (AAV) Gene Transfer (GT) in Non-Human Primates (NHPs), Mol Ther, 32
Cited by
Antioxidant Strategies for Inherited Retinal Degenerations in the Era of Gene Therapy
Yang, Y., Chen, Q., Zeng, J., Liang, L., Tao, Z., She, K., Ren, C., & Lu, F. (2026) · Antioxidants · doi:10.3390/antiox15101229
Metadata
- Authors
- Costa-Verdera, H., Jamwal, D., Fabyanic, E., Hippen, A., Salvatore, M., Du, A., Majowicz, A., Markusic, D., Chatterton, J. E., Haurigot, V., & Kuranda, K.
- Affiliations
- Immunology, Spark Therapeutics
- Spark Therapeutics (United States) (US)
- Corresponding author
- Chatterton, Jon E.
- Venue
- Frontiers in Immunology
- Publisher
- Frontiers Media SA
- Published
- 2026-04-22
- Volume
- 17
- Pages
- 1799327-1799327
- ISSN
- 1664-3224 (ISSN-L)
- PMC
- PMC13144134
- OpenAlex
- W7155194333
- Semantic Scholar
- 5f076e1384832dfb267a83ad596c93e21d30f143
- Cited by
- 2
- References
- 60
- Citations by year
- 2026: 2
- FWCI
- 7.85
- Type
- journal article
- Language
- en
- Open access
- gold
- doi.org
- Licence
- Locations
- Frontiers in Immunology (publishedVersion, cc-by)
- PubMed (publishedVersion)
- PubMed Central (publishedVersion, cc-by)
- DOAJ (DOAJ: Directory of Open Access Journals) (submittedVersion, cc-by-sa)
- Topics
- Life Sciences › Biochemistry, Genetics and Molecular Biology › Genetics › Virus-based gene therapy research
- Health Sciences › Medicine › Ophthalmology › Retinal Development and Disorders
- Health Sciences › Medicine › Ophthalmology › Ocular Diseases and Behçet’s Syndrome
- Keywords
- adeno-associated virus vectors, intravitreal gene delivery, ocular inflammation, integrin signaling, complement activation, C3a, DNA damage response, retinal ganglion cells, microglial activation, retinal gene therapy, immunomodulation
- MeSH terms
- Gene Therapy Agents, Dependovirus, Animals, Complement Activation, Disease Models, Animal, DNA Damage, Female, Genetic Vectors, Swine, Uveitis, Genetic Therapy, Integrins, Mice, Intravitreal Injections
About these checks
Registry, retraction, Cites and statistics results are computed, not judged, with one exception: a printed reference that no index lists is read once by a model before it counts as a citation error. Claims are extracted by a model and kept only when their quote appears verbatim in the text; each cited source is then checked, with a model’s help, for whether it says what the claim relies on. Those verdicts can be wrong — read the claim’s quote and the cited source before relying on one.
The claim verdicts this report counts are experimental: their accuracy is not yet measured.
A language model drew the claims from the paper on 2026-09-29, under version 3 of the claim definition (model deepseek-v4.1-flash, prompt extract-v3).
A second model labelled each claim on 2026-09-29 (model jev-1.13-20260917, definition revision gold-guideline-v0.2).
Cited sources are checked with a language model’s help (gpt-6-sol).
Statistics and arithmetic are recomputed, not judged.
Confidence bands are shown only for fields calibrated on our annotated test set. None is calibrated yet, so no band is shown.
What counts as a claim ›How we measure confidence ›How we check this ›
Are you an author, or do you see a problem with this page? Request a review
How to cite
Cite CoChat for the checks on this page, and the paper for its own findings.
- This page
- CoChat. (2026). Citation check: Intravitreal AAV vector delivery induces integrin-dependent ocular inflammation, complement activation, and antiviral and DNA damage responses. https://app.cochat.ai/papers/10.3389/fimmu.2026.1799327
- The paper
- Costa-Verdera, H., Jamwal, D., Fabyanic, E., Hippen, A., Salvatore, M., Du, A., Majowicz, A., Markusic, D., Chatterton, J. E., Haurigot, V., & Kuranda, K. (2026). Intravitreal AAV vector delivery induces integrin-dependent ocular inflammation, complement activation, and antiviral and DNA damage responses. Frontiers in Immunology. https://doi.org/10.3389/fimmu.2026.1799327
Data sources
Bibliographic data: Semantic Scholar, OpenAlex, Crossref.
Contains information from the Semantic Scholar Academic Graph Datasets, made available under the ODC Attribution License (ODC-BY 1.0).
Semantic Scholar’s data is described in: Kinney, R., et al. (2023). The Semantic Scholar Open Data Platform. arXiv:2301.10140.
