

The DOI matches its Crossref record; 252 of the 255 references it cites were found in a registry or an index.
Measuring Behavior in the Home Cage: Study Design, Applications, Challenges, and Perspectives
Open accessAbstract
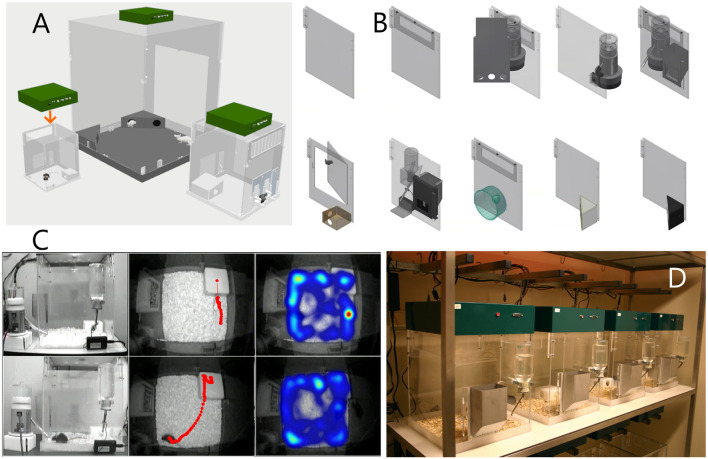
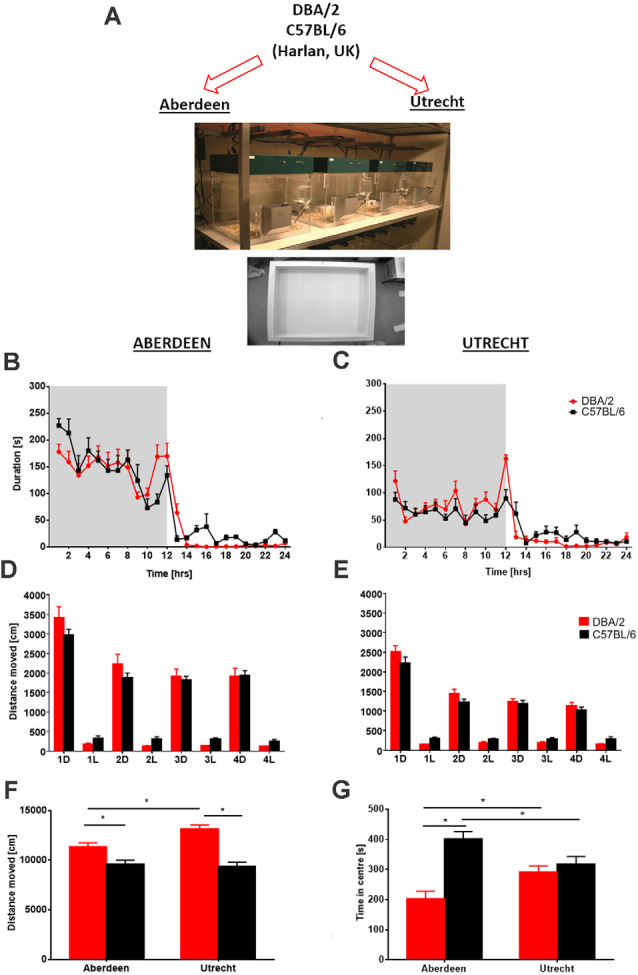
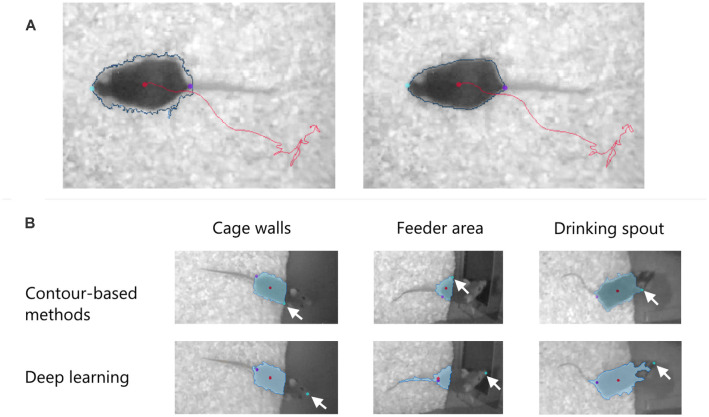
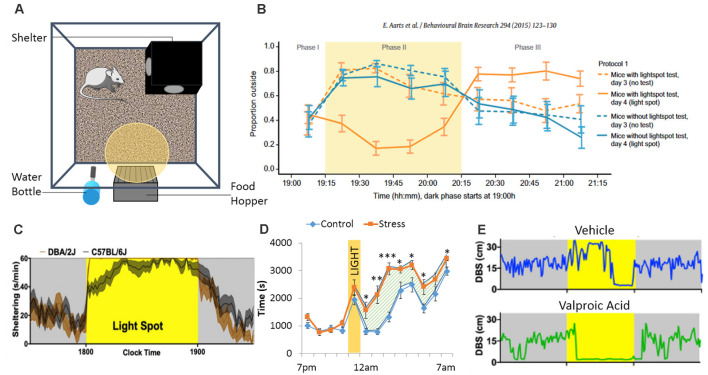
The reproducibility crisis (or replication crisis) in biomedical research is a particularly existential and under-addressed issue in the field of behavioral neuroscience, where, in spite of efforts to standardize testing and assay protocols, several known and unknown sources of confounding environmental factors add to variance. Human interference is a major contributor to variability both within and across laboratories, as well as novelty-induced anxiety. Attempts to reduce human interference and to measure more "natural" behaviors in subjects has led to the development of automated home-cage monitoring systems. These systems enable prolonged and longitudinal recordings, and provide large continuous measures of spontaneous behavior that can be analyzed across multiple time scales. In this review, a diverse team of neuroscientists and product developers share their experiences using such an automated monitoring system that combines Noldus PhenoTyper® home-cages and the video-based tracking software, EthoVision® XT, to extract digital biomarkers of motor, emotional, social and cognitive behavior. After presenting our working definition of a “home-cage”, we compare home-cage testing with more conventional out-of-cage tests (e.g., the open field) and outline the various advantages of the former, including opportunities for within-subject analyses and assessments of circadian and ultradian activity. Next, we address technical issues pertaining to the acquisition of behavioral data, such as the fine-tuning of the tracking software and the potential for integration with biotelemetry and optogenetics. Finally, we provide guidance on which behavioral measures to emphasize, how to filter, segment, and analyze behavior, and how to use analysis scripts. We summarize how the PhenoTyper has applications to study neuropharmacology as well as animal models of neurodegenerative and neuropsychiatric illness. Looking forward, we examine current challenges and the impact of new developments. Examples include the automated recognition of specific behaviors, unambiguous tracking of individuals in a social context, the development of more animal-centered measures of behavior and ways of dealing with large datasets. Together, we advocate that by embracing standardized home-cage monitoring platforms like the PhenoTyper, we are poised to directly assess issues pertaining to reproducibility, and more importantly, measure features of rodent behavior under more ethologically relevant scenarios.
Overview
The claims and statistics of this paper haven’t been checked yet.
Run the check — free, no account needed. It reads the open-access text and checks the sources it cites.
Integrity signals
Registry
Cites
Statistics
Figures
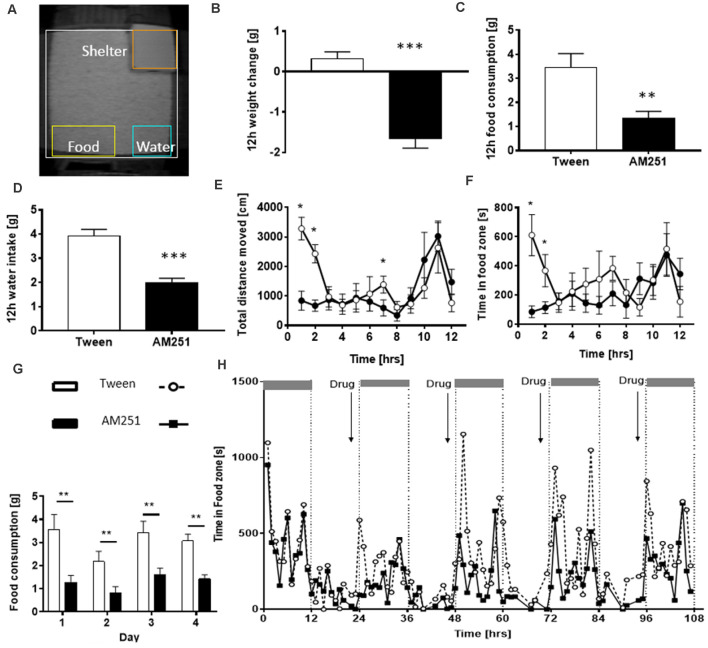
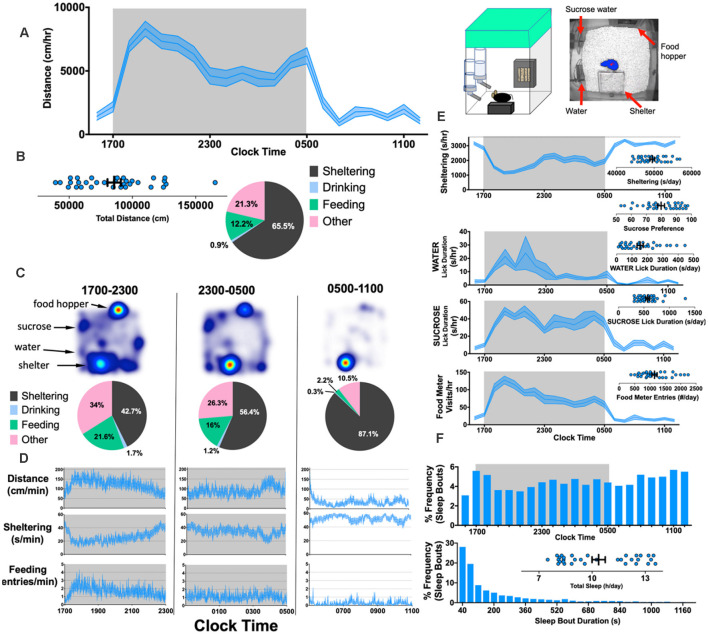
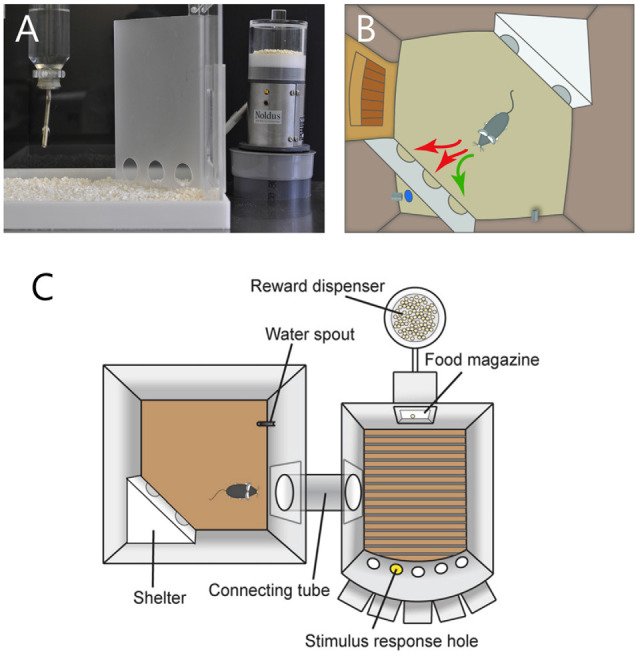
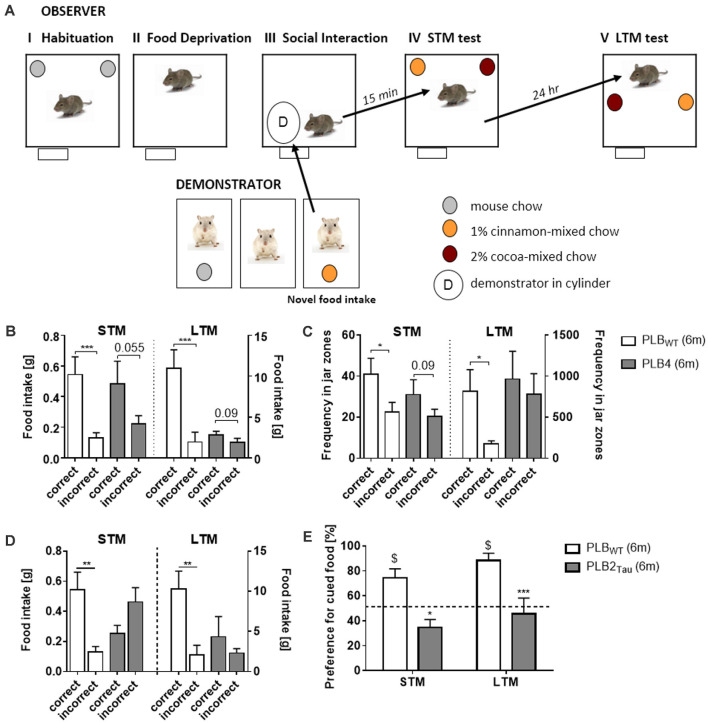
Verification
Claims the paper makes
The claims and statistics of this paper haven’t been checked yet.
Run the check — free, no account needed. It reads the open-access text and checks the sources it cites.
Claims other papers make about this one
Each is checked against this paper’s own text: does it say what the citing paper says it does?
The cited source says what the claim attributes to it.
In the citing paper
“Indeed, more sophisticated methods are becoming available for continuous recording and scoring of behavior in a home cage (Greico et al., 2021).”
From The rough-and-tumble play of rats as a natural behavior suitable for studying the social brain (2022) · cites this paper as Greico et al., 2021
Self-check
Percentages, sums and reported differences re-computed from the paper’s own numbers.
The self-check needs the paper’s full text.
Citations
Cites
Validation of open:closed arm entries in an elevated plus-maze as a measure of anxiety in the rat
Pellow, S., Chopin, P., File, S. E., & Briley, M. (1985) · Journal of Neuroscience Methods · doi:10.1016/0165-0270(85)90031-7 · Cited by 5,822
DeepLabCut: markerless pose estimation of user-defined body parts with deep learning
Mathis, A., Mamidanna, P., Cury, K. M., Abe, T., Murthy, V. N., Mathis, M. W., & Bethge, M. (2018) · Nature Neuroscience · doi:10.1038/s41593-018-0209-y · Cited by 5,187
The tail suspension test: A new method for screening antidepressants in mice
Steru, L., Chermat, R., Thierry, B., & Simon, P. (1985) · Psychopharmacology · doi:10.1007/bf00428203 · Cited by 3,534
Behavioural despair in rats: A new model sensitive to antidepressant treatments
Porsolt, R. D., Anton, G., Blavet, N., & Jalfre, M. (1978) · European Journal of Pharmacology · doi:10.1016/0014-2999(78)90118-8 · Cited by 3,138
The use of a plus-maze to measure anxiety in the mouse
Lister, R. G. (1987) · Psychopharmacology · doi:10.1007/bf00177912 · Cited by 2,617
Neuroscience of attention-deficit/hyperactivity disorder: the search for endophenotypes
Castellanos, F. X., & Tannock, R. (2002) · Nature Reviews Neuroscience · doi:10.1038/nrn896 · Cited by 1,827 · cited 1×
“Deficits in attention and impulse control are hallmarks of psychiatric disorders such as schizophrenia and attention-deficit hyperactivity disorder (ADHD; Castellanos and Tannock, 2002; Luck and Gold, 2008).”
BackgroundSex bias in neuroscience and biomedical research
Beery, A. K., & Zucker, I. (2011) · Neuroscience & Biobehavioral Reviews · doi:10.1016/j.neubiorev.2010.07.002 · Cited by 1,763
Genetics of Mouse Behavior: Interactions with Laboratory Environment
Crabbe, J. C., Wahlsten, D., & Dudek, B. C. (1999) · Science · doi:10.1126/science.284.5420.1670 · Cited by 1,666
A standardized protocol for repeated social defeat stress in mice
Golden, S. A., Covington, H. E., Berton, O., & Russo, S. J. (2011) · Nature Protocols · doi:10.1038/nprot.2011.361 · Cited by 1,581
Shank3 mutant mice display autistic-like behaviours and striatal dysfunction
Peça, J., Feliciano, C., Ting, J. T., Wang, W., Wells, M. F., Venkatraman, T. N., Lascola, C. D., Fu, Z., & Feng, G. (2011) · Nature · doi:10.1038/nature09965 · Cited by 1,570
Research works printed but not linked: 4
- Bailey, 2009, Anxiety-related behaviors in mice, 77
- de Heer, 2008, Learning (in) the PhenoTyper: an integrative approach to conducting cognitive behavioural challenges in a home cage environment
- Russell, 1959, The Principles of Humane Experimental Technique.tif.
- Salvetti, 2012, Evaluation of alterations in behaviour, cognition and neuronal excitability induced by administration of QTracker °800 quantum dots, Measuring Behav., 2012, 362
Cited by
Sorted by citations
Rodent tests of depression and anxiety: Construct validity and translational relevance
Gencturk, S., & Ünal, G. (2024) · Cognitive Affective & Behavioral Neuroscience · doi:10.3758/s13415-024-01171-2 · Cited by 160
Gyles, T. M., Nestler, E. J., & Parise, E. M. (2023) · Neuropsychopharmacology · doi:10.1038/s41386-023-01625-0 · Cited by 55
Baran, S. W., Bratcher, N. A., Dennis, J. U., Gaburro, S., Karlsson, E. M., Maguire, S. F., Makidon, P. E., Noldus, L. P. J. J., Potier, Y., Rosati, G., et al. (2022) · Frontiers in Behavioral Neuroscience · doi:10.3389/fnbeh.2021.758274 · Cited by 47
Self-citationSiedhoff, H. R., Chen, S., Song, H., Cui, J., Černak, I., Cifu, D. X., DePalma, R. G., & Gu, Z. (2022) · Frontiers in Neurology · doi:10.3389/fneur.2021.818169 · Cited by 50
3Rs Principle and Legislative Decrees to Achieve High Standard of Animal Research
Verderio, P., Lecchi, M., Ciniselli, C. M., Shishmani, B., Apolone, G., & Manenti, G. (2023) · Animals · doi:10.3390/ani13020277 · Cited by 49
Hybrid Offspring of C57BL/6J Mice Exhibit Improved Properties for Neurobehavioral Research
Sloin, H. E., Bikovski, L., Levi, A., Amber-Vitos, O., Katz, T., Spivak, L., Someck, S., Gattegno, R., Sivroni, S., Sjulson, L., et al. (2022) · eNeuro · doi:10.1523/eneuro.0221-22.2022 · Cited by 32
Self-citationThe rough-and-tumble play of rats as a natural behavior suitable for studying the social brain
Pellis, S. M., Pellis, V. C., Ham, J. R., & Achterberg, E. J. M. (2022) · Frontiers in Behavioral Neuroscience · doi:10.3389/fnbeh.2022.1033999 · Cited by 29
“Indeed, more sophisticated methods are becoming available for continuous recording and scoring of behavior in a home cage (Greico et al., 2021).”
BackgroundTowards improved screening of toxins for Parkinson’s risk
Shan, L., Heusinkveld, H. J., Paul, K. C., Hughes, S., Darweesh, S. K. L., Bloem, B. R., & Homberg, J. R. (2023) · npj Parkinson s Disease · doi:10.1038/s41531-023-00615-9 · Cited by 26
Self-citationUsing deep learning to study emotional behavior in rodent models
Kuo, J. Y., Denman, A. J., Beacher, N. J., Glanzberg, J. T., Zhang, Y., Li, Y., & Lin, D. (2022) · Frontiers in Behavioral Neuroscience · doi:10.3389/fnbeh.2022.1044492 · Cited by 28
JUN and PDGFRA as Crucial Candidate Genes for Childhood Autism Spectrum Disorder
Li, H., Wang, X., Hu, C., Li, H., Xu, Z., Lei, P., Luo, X., & Hao, Y. (2022) · Frontiers in Neuroinformatics · doi:10.3389/fninf.2022.800079 · Cited by 25
Bramati, G., Stauffer, P., Nigri, M., Wolfer, D. P., & Amrein, I. (2023) · Frontiers in Behavioral Neuroscience · doi:10.3389/fnbeh.2023.1256744 · Cited by 26
Cellular Senescence Is a Central Driver of Cognitive Disparities in Aging
Baier, M. P., Ranjit, R., Owen, D. B., Wilson, J. L., Stiles, M. A., Masingale, A. M., Thomas, Z., Bredegaard, A., Sherry, D. M., & Logan, S. (2025) · Aging Cell · doi:10.1111/acel.70041 · Cited by 25
Self-citationBaier, M. P., Nagaraja, R. Y., Yarbrough, H. P., Owen, D. B., Masingale, A. M., Ranjit, R., Stiles, M. A., Murphy, A., Agbaga, M., Ahmad, M., et al. (2022) · Journal of Neuroscience · doi:10.1523/jneurosci.2543-21.2022 · Cited by 20
Self-citationLong-term tracking of social structure in groups of rats
Nagy, M., Davidson, J. D., Vásárhelyi, G., Ábel, D., Kubinyi, E., Hady, A. E., & Vicsek, T. (2024) · Scientific Reports · doi:10.1038/s41598-024-72437-5 · Cited by 18
Salehi, M., Jurek, B., Karimi-Haghighi, S., Nezhad, N. J., Mousavi, S. M., Hooshmandi, E., Safari, A., Dianatpour, M., Haerteis, S., Miyan, J., et al. (2022) · Reviews in the Neurosciences · doi:10.1515/revneuro-2021-0163 · Cited by 15
The circuit basis for chronic pain and its comorbidities
Patel, R. (2023) · Current Opinion in Supportive and Palliative Care · doi:10.1097/spc.0000000000000650 · Cited by 16
Siedhoff, H. R., Chen, S., Balderrama, A., Sun, G. Y., Koopmans, B., DePalma, R. G., Cui, J., & Gu, Z. (2022) · Neurotrauma Reports · doi:10.1089/neur.2021.0063 · Cited by 16
Self-citationEffects of Human Observer Presence on Pain Assessment Using Facial Expressions in Rabbits
Pinho, R. H., Justo, A. A., Cima, D. S., Fonseca, M. W., Minto, B. W., Rocha, F. D. L., Leach, M. C., & Luna, S. P. L. (2022) · Journal of the American Association for Laboratory Animal Science · doi:10.30802/aalas-jaalas-22-000056 · Cited by 15
Cognitive heterogeneity reveals molecular signatures of age-related impairment
Logan, S., Baier, M. P., Owen, D. B., Peasari, J. R., Jones, K. L., Ranjit, R., Yarbrough, H. P., Masingale, A. M., Bhandari, S., Rice, H. C., et al. (2023) · PNAS Nexus · doi:10.1093/pnasnexus/pgad101 · Cited by 19
Self-citationAI-powered home cage system for real-time tracking and analysis of rodent behavior
Hsieh, C.-M., Hsu, C., Chen, J.-K., & Liao, L. (2024) · iScience · doi:10.1016/j.isci.2024.111223 · Cited by 12
Martos, D., Lőrinczi, B., Szatmári, I., Vécsei, L., & Tanaka, M. (2025) · Cells · doi:10.3390/cells14130973 · Cited by 9
Editorial: Animal-friendly methods for rodent behavioral testing in neuroscience research
d’Isa, R., Fasano, S., & Brambilla, R. (2024) · Frontiers in Behavioral Neuroscience · doi:10.3389/fnbeh.2024.1431310 · Cited by 13
Parsons, M. H., Stryjek, R., Fendt, M., Kiyokawa, Y., Bębas, P., & Blumstein, D. T. (2023) · Frontiers in Behavioral Neuroscience · doi:10.3389/fnbeh.2023.1228478 · Cited by 12
Tseitlin, L., Richmond-Hacham, B., Vita, A., Schreiber, S., Pick, C. G., & Bikovski, L. (2023) · Frontiers in Behavioral Neuroscience · doi:10.3389/fnbeh.2023.1140724 · Cited by 12
Self-citationBouts of rest and physical activity in C57BL/6J mice
Pernold, K., Rullman, E., & Ulfhake, B. (2023) · PLoS ONE · doi:10.1371/journal.pone.0280416 · Cited by 12
Rose, H., Ferrán, B., Ranjit, R., Masingale, A. M., Owen, D. B., Hussong, S. A., Kinter, M. T., Galván, V., Logan, S., & Díaz‐García, C. M. (2023) · Journal of Neurochemistry · doi:10.1111/jnc.15901 · Cited by 10
Self-citationMösch, L., Kunczik, J., Breuer, L., Merhof, D., Gass, P., Potschka, H., Zechner, D., Vollmar, B., Tolba, R. H., Häger, C., et al. (2023) · PLoS ONE · doi:10.1371/journal.pone.0286230 · Cited by 9
Actigraphic correlates of neuropsychiatric symptoms in adults with focal epilepsy
Abboud, M. A., Kamen, J. L., Bass, J. S., Lin, L., Gavvala, J. R., Rao, S., Smagula, S. F., & Krishnan, V. (2023) · Epilepsia · doi:10.1111/epi.17611 · Cited by 10
Self-citationHome-cage behavior in the Stargazer mutant mouse
Schirmer, C., Abboud, M. A., Lee, S., Bass, J. S., Mazumder, A. G., Kamen, J. L., & Krishnan, V. (2022) · Scientific Reports · doi:10.1038/s41598-022-17015-3 · Cited by 10
Self-citationDisentangling rodent behaviors to improve automated behavior recognition
van Dam, E. A., Noldus, L. P. J. J., & van Gerven, M. A. J. (2023) · Frontiers in Neuroscience · doi:10.3389/fnins.2023.1198209 · Cited by 8
Self-citationHighly accurate and precise determination of mouse mass using computer vision
Guzman, M., Geuther, B. Q., Sabnis, G. S., & Kumar, V. (2024) · Patterns · doi:10.1016/j.patter.2024.101039 · Cited by 8
Perry, L., Ratcliff, G. E., Mayo, A., Perez, B., Wahba, L. R., Nikhil, K. L., Lenzen, W. C., Li, Y., Mar, J. S., Farhy-Tselnicker, I., et al. (2025) · Cell Reports Methods · doi:10.1016/j.crmeth.2025.101050 · Cited by 7
PiE: an open-source pipeline for home cage behavioral analysis
Benedict, J., & Cudmore, R. H. (2023) · Frontiers in Neuroscience · doi:10.3389/fnins.2023.1222644 · Cited by 7
d’Isa, R. (2025) · Frontiers in Psychology · doi:10.3389/fpsyg.2024.1532975 · Cited by 6
3D mouse pose from single-view video and a new dataset
Hu, B., Seybold, B., Yang, S., Sud, A., Liu, Y., Barron, K., Cha, P., Cosino, M., Karlsson, E., Kite, J., et al. (2023) · Scientific Reports · doi:10.1038/s41598-023-40738-w · Cited by 6
Cassidy, B. R., Logan, S., Farley, J. A., Owen, D. B., Sonntag, W. E., & Drevets, D. A. (2023) · Frontiers in Immunology · doi:10.3389/fimmu.2023.1146690 · Cited by 7
Self-citationAn 8-cage imaging system for automated analyses of mouse behavior
Hernández, T. D. R., Joshi, N. R., Gore, S. V., Kreiling, J. A., & Créton, R. (2023) · Scientific Reports · doi:10.1038/s41598-023-35322-1 · Cited by 6
The 3Rs in Experimental Liver Disease
Martínez‐López, S., Ángel‐Gomis, E., Sánchez, E., Pastor-Campos, A., Picó, J., & Gómez‐Hurtado, I. (2023) · Animals · doi:10.3390/ani13142357 · Cited by 9
Sharafeddin, F., Sierra, J., Ghaly, M. H., Simon, T. B., Ontiveros‐Ángel, P., Edelbach, B. M., Febo, M., Labus, J. S., & Figueroa, J. D. (2024) · Brain and Behavior · doi:10.1002/brb3.3482 · Cited by 6
Puls, F., Kosin, L., Garbisch, F., Touma, C., Thöne‐Reineke, C., & Gygax, L. (2024) · Ethology · doi:10.1111/eth.13468 · Cited by 6
For neuroscience, social history matters
George, A., Padilla-Coreano, N., & Opendak, M. M. (2023) · Neuropsychopharmacology · doi:10.1038/s41386-023-01566-8 · Cited by 5
Yu, B., Li, P., Xu, H., Wang, Y., Xu, K., & Hao, Y. (2025) · eLife · doi:10.7554/elife.104833 · Cited by 6
de Jesus, L. C., & Rodrigues, A. L. S. (2025) · Physiology & Behavior · doi:10.1016/j.physbeh.2025.114883 · Cited by 5
Sadighi, M., Mai, L., Xu, Y., Boillot, M., Targa, G., Mottarlini, F., Brambilla, P., Gass, P., Caffino, L., Fumagalli, F., et al. (2024) · Journal of Affective Disorders · doi:10.1016/j.jad.2024.01.186 · Cited by 5
Self-citationDjabirska, I., Delaval, L., Tromme, A., Blomet, J., Desmecht, D. J.-M., & Laere, A.-S. V. (2024) · Experimental Neurology · doi:10.1016/j.expneurol.2024.114851 · Cited by 5
Robertson, T. L., Ellis, M., Bratcher-Petersen, N., Ruidíaz, M. E., Harada, K., Toburen, D., Oberhauser, J. P., Grzenda, D., Peltier, N. E., Raza, M., et al. (2024) · bioRxiv (Cold Spring Harbor Laboratory) · doi:10.1101/2024.12.18.629281 · Cited by 8
Farokhmoradi, H., & Salari-Kakhk, F. (2025) · Journal of Lab Animal Research · doi:10.58803/jlar.v4i3.78 · Cited by 4
Refinement of the motorised laminectomy-assisted rat spinal cord injury model by analgesic treatment
Sreelatha, H. V., Palekkodan, H., Fasaludeen, A., Krishnan, L. K., & Abelson, K. (2024) · PLoS ONE · doi:10.1371/journal.pone.0294720 · Cited by 4
Farès, R., & Champéroux, P. (2023) · Journal of Pharmacological and Toxicological Methods · doi:10.1016/j.vascn.2023.107268 · Cited by 4
Викторовна, К. А., Lang, B., Jaap, A., Thöne‐Reineke, C., Lewejohann, L., & Mieske, P. (2025) · Behavioural Brain Research · doi:10.1016/j.bbr.2025.115904 · Cited by 6
Krishnan, V., Wu, J., Mazumder, A. G., Kamen, J. L., Schirmer, C., Adhyapak, N., Bass, J. S., Lee, S., Maheshwari, A., Molinaro, G., et al. (2024) · The Journal of Comparative Neurology · doi:10.1002/cne.25660 · Cited by 3
Self-citationLiptáková, A., Castelhano-Carlos, M. J., Fiúza-Fernandes, J., Sousa, N., Roche, M., Finn, D. P., & Leite‐Almeida, H. (2025) · Frontiers in Behavioral Neuroscience · doi:10.3389/fnbeh.2025.1550476 · Cited by 3
Cyber Operations Gyms to Train Autonomous Cyber Defense Agents for NATO
Velazquez, A., Loevenich, J. F., Hürten, T., Wrona, K., Rettore, P. H. L., Boshnakov, V., Nelson, F. F., Braun, T., & Lopes, R. R. F. (2025) · International Conference on Military Communications and Information Systems (ICMCIS) · doi:10.1109/icmcis64378.2025.11047884 · Cited by 3
Assessment of impulsivity using an automated, self-adjusting delay discounting procedure
Carr, M. R., van Mourik, Y., Gómez-Sotres, P., Solinas, M., Vries, T. J. D., & Pattij, T. (2024) · Behavioural Brain Research · doi:10.1016/j.bbr.2024.115405 · Cited by 3
Mösch, L., Kunczik, J., Breuer, L., Merhof, D., Gass, P., Potschka, H., Zechner, D., Vollmar, B., Tolba, R. H., Häager, C., et al. (2023) · bioRxiv (Cold Spring Harbor Laboratory) · doi:10.1101/2023.05.12.540546 · Cited by 3
Sadighi, M., Foka, K., Mottarlini, F., van den Burg, E. H., Taddini, S., Leo, D., Sanna, F., Caffino, L., Fumagalli, F., & Homberg, J. R. (2025) · Neuropharmacology · doi:10.1016/j.neuropharm.2025.110597 · Cited by 3
Self-citationState Estimation of an Agent with Stochastic Dynamics Using Recurrent Filters
Krasnov, D. I., Volynsky, M. A., & Gusev, A. (2025) · Informatics and Automation · doi:10.15622/ia.24.5.4 · Cited by 2
Innovating pain research: bridging gaps and shaping the future
Rodríguez-Palma, E. J., Allen, H. N., Nelson, T. S., & Khanna, R. (2025) · Pain · doi:10.1097/j.pain.0000000000003661 · Cited by 2
Brachs, S., Dall, M., Zimbalski, L.-K., Santin, Y., Oeing, C. U., Mai, K., Parini, A., Gaburro, S., & Nielsen, T. S. (2025) · Lab Animal · doi:10.1038/s41684-025-01648-8 · Cited by 2
SqueakPose Studio, an end-to-end platform for pose estimation and real-time edge-AI deployment
Haggerty, D. L., Darden, C. B., & Dm, L. (2026) · eLife · doi:10.7554/elife.111308.2 · Cited by 2
Investigation of Mild Traumatic Brain Injury Home Cage Behavior: The Home Cage Assay Advantages
Richmond-Hacham, B., Tseitlin, L., Bikovski, L., & Pick, C. G. (2024) · Journal of Neurotrauma · doi:10.1089/neu.2023.0459 · Cited by 2
Self-citationMueller, M., Tir, S., Pothecary, C. A., Meijer, E. J., Brown, L. A., Foster, K., Vyazovskiy, V. V., Peirson, S. N., & Molnár, Z. (2025) · Wellcome Open Research · doi:10.12688/wellcomeopenres.23850.1 · Cited by 3
Brachs, S., Dall, M., Zimbalski, L.-K., Santin, Y., Oeing, C. U., Mai, K., Parini, A., Gaburro, S., & Nielsen, T. S. (2025) · bioRxiv (Cold Spring Harbor Laboratory) · doi:10.1101/2025.04.02.646666 · Cited by 2
Behavioral comorbidities of early-life seizures: Insights from developmental studies in rats
Grígelová, A., Mikulecká, A., & Kubová, H. (2025) · Epilepsy & Behavior · doi:10.1016/j.yebeh.2025.110307 · Cited by 1
Minakawa, E. N., Owari, K., Nogami, N., Nakatani, T., Koizumi, M., Kawanobe, A., Saga, Y., Kudo, M., Noguchi, S., Hanakawa, T., et al. (2025) · Disease Models & Mechanisms · doi:10.1242/dmm.052470 · Cited by 4
Using Artificial Intelligence Systems in Modern Neurobehavioral Research
Apukhtin, K. V., Zolotova, A. E., Leunenko, A. O., Perfilova, V. N., & Kalueff, A. V. (2025) · Journal of Evolutionary Biochemistry and Physiology · doi:10.1134/s0022093025060080 · Cited by 1
Effect of the Icelandic Mutation APPA673T in the Murine APP Gene on Phenotype of Line 66 Tau Mice
Anschuetz, A., Robinson, L., Mondésir, M., Melis, V., Platt, B., Harrington, C. R., Riedel, G., & Schwab, K. (2025) · Biomolecules · doi:10.3390/biom16010028 · Cited by 2
Self-citationTsoy, M. O., Merkulova, K. O., Evsukova, A., & Zlatogorskaya, D. (2026) · The European Physical Journal Special Topics · doi:10.1140/epjs/s11734-026-02210-4 · Cited by 1
Tremoleda, J. L., Brønstad, A., Potschka, H., Seebeck, P., Stiedl, O., Võikar, V., Wells, S. E., & Subgroup, T. A. W. (2026) · Laboratory Animals · doi:10.1177/00236772251396319 · Cited by 1
Kim, S., CAO, K., Dougherty, P. M., McDonough, K., & Javed, S. (2026) · Journal of Pain Research · doi:10.2147/jpr.s565512 · Cited by 1
Helbling, J. E., Spittler, A. P., Sadar, M. J., & Santangelo, K. S. (2023) · Laboratory Animals · doi:10.1177/00236772231165810 · Cited by 1
Hernadi, Z., Körmöczi, L., Adlan, L. G., Kékesi, G., Büki, A., Liszli, P., Nyúl, L. G., Braunitzer, G., & Horváth, G. (2025) · PLoS ONE · doi:10.1371/journal.pone.0328460 · Cited by 1
A modular gate system for autonomous control of rodent behaviorPreprint
Lester, A. W., Kaur, G., Djafri, N., & Madhav, M. S. (2024) · bioRxiv (Cold Spring Harbor Laboratory) · doi:10.1101/2024.11.22.624912 · Cited by 1
Minakawa, E. N., Owari, K., Nogami, N., Nakatani, T., Koizumi, M., Kawanobe, A., Saga, Y., Kudo, M., Noguchi, S., Hanakawa, T., et al. (2025) · bioRxiv (Cold Spring Harbor Laboratory) · doi:10.1101/2025.03.12.642922 · Cited by 1
Moëne, O. L., Larsson, M., & Jackson, W. S. (2025) · bioRxiv (Cold Spring Harbor Laboratory) · doi:10.1101/2025.03.17.643700 · Cited by 1
The effect of the Icelandic mutation APP A673T in the line 66 model of tauopathyPreprint
Anschuetz, A., Robinson, L., Mondésir, M., Melis, V., Platt, B., Harrington, C. R., Riedel, G., & Schwab, K. (2025) · bioRxiv (Cold Spring Harbor Laboratory) · doi:10.1101/2025.10.09.681356 · Cited by 1
Self-citationPeretz‐Rivlin, N., Marsh‐Yvgi, I., Fatal, Y., Levin, S., Atlan, G., & Citri, A. (2026) · bioRxiv (Cold Spring Harbor Laboratory) · doi:10.64898/2026.01.05.697827 · Cited by 1
Pain assessment in laboratory species
Whittaker, A. L., & Brown, C. (2023) · Elsevier eBooks · doi:10.1016/b978-0-12-822215-7.00019-6
Laz, M.-A. D., Lampe, M., Connor, I., Shestachuk, D., Ludwig, M., Müller, U., Strauch, O. F., Suendermann, N., Lüth, S., & Kah, J. (2023) · bioRxiv (Cold Spring Harbor Laboratory) · doi:10.1101/2023.08.06.552188
Xu, J. X., Coker, A., Dulaney, Z., Furbish, A. B., Xu, F. Z., Helke, K. L., Woster, P. M., Nietert, P. J., & Braxton, A. M. (2024) · Journal of the American Association for Laboratory Animal Science · doi:10.30802/aalas-jaalas-23-000086
Yu, B., Li, P., Xu, H., Wang, Y., Xu, K., & Hao, Y. (2025) · eLife · doi:10.7554/elife.104833.3
Sysoeva, O., Akhmirov, R., Zaichenko, M. I., Lazarenko, I., Rebik, A., Broshevitskaya, N. D., Midzyanovskaya, I. S., & Smirnov, K. (2025) · Diagnostics · doi:10.3390/diagnostics15020151
Yu, B., Li, P., Xu, H., Wang, Y., Xu, K., & Hao, Y. (2025) · eLife · doi:10.7554/elife.104833.1
EGR3 Deletion Rescues Developmental and Epileptic Encephalopathy in Kcna1 -null MicePreprint
Mazumder, A. G., Karedia, S., Adhyapak, N., Schimer, C., Bass, J. S., Kamen, J. L., Jankovic, M. J., Miao, Q., Gallitano, A. L., Saltzman, A. B., et al. (2025) · bioRxiv (Cold Spring Harbor Laboratory) · doi:10.1101/2025.06.07.658422
Self-citationVocalisations as a potential indicator of parturition in C57BL/6J mice
Capas-Peneda, S., Ferreira, A. I., Gilbert, C. L., Prins, J., Vanderplank, A., Rosati, G., Garzola, M., Olsson, I. A. S., & Morello, G. M. (2025) · Animal Welfare · doi:10.1017/awf.2025.10022
Викторовна, К. А., Lang, B., Jaap, A., Thöne‐Reineke, C., Lewejohann, L., & Mieske, P. (2025) · SSRN Electronic Journal · doi:10.2139/ssrn.5346780
Kendricks, D. R., Sleiman, S. J., Fry, S. A., Stallone, J., Bernstein, B. J., Stevanovic, K. D., Wilson, L. R., Alexander, G. M., McCann, K. E., Dudek, S. M., et al. (2025) · Hormones and Behavior · doi:10.1016/j.yhbeh.2025.105794
Self-citationYu, B., Li, P., Xu, H., Wang, Y., Xu, K., & Hao, Y. (2025) · eLife · doi:10.7554/elife.104833.2
Automated home-cage-like monitoring for assessing innate behaviors in a murine hangover model
Hasriadi, H., Wasana, P. W. D., Nwe, S. Y., Sukrong, S., & Towiwat, P. (2025) · Scientific Reports · doi:10.1038/s41598-025-13334-3
Zoldi, A., Körmöczi, L., Plesz, S. B., Adlan, L. G., Kékesi, G., Liszli, P., Nyúl, L. G., Braunitzer, G., & Horváth, G. (2025) · Frontiers in Psychiatry · doi:10.3389/fpsyt.2025.1601714
Kaura, R. L., Hrnčić, D., Dervišević, A., Borbélyová, V., Cevik, Ö. S., Heffer, M., & Čater, M. (2025) · Slovenian Veterinary Research · doi:10.26873/svr-2247-2025
Jura, B., Lenarczyk, M., Harda, Z., Szumiec, Ł., Ziemiańska, M., Kłosowicz, R., Parkitna, J. M. R., & Wojcik, D. K. (2025) · bioRxiv (Cold Spring Harbor Laboratory) · doi:10.1101/2025.11.12.687796
Virag, D., Virag, A.-M., Homolak, J., Kahnau, P., Perhoč, A. B., Krsnik, A., Mihalic, L., Knezović, A., Barilar, J. O., Cifrek, M., et al. (2026) · bioRxiv (Cold Spring Harbor Laboratory) · doi:10.64898/2026.01.20.700603
Faisal, M., Radyushkin, K., & Baumgart, J. (2026) · Journal of Neuroscience Methods · doi:10.1016/j.jneumeth.2026.110773
Technologies for Home Cage Monitoring in Preclinical Research
Huzard, D., Adams, C. K., Álvarez, J., Florea, M., Gaburro, S., Lorimer, T., Mieske, P., Ruiter, M., Sturman, O., Weber, N., et al. (2026) · Springer eBooks · doi:10.1007/978-3-032-19781-8_7
Study Design and Data Analysis in Home Cage Monitoring Experiments
Landes, R. D., Rigamonti, M., & Talbot, S. R. (2026) · Springer eBooks · doi:10.1007/978-3-032-19781-8_8
Home Cage Monitoring in Pharmaceutical Industries and Contract Research Organizations
Céline, G., van Gaalen, M. M., & Scorrano, F. (2026) · Springer eBooks · doi:10.1007/978-3-032-19781-8_5
Home Cage Monitoring in Practice in Core Labs: Training, Infrastructure, and Research Workflow
Villiger, P., Tsoory, M., Mandillo, S., & Gaburro, S. (2026) · Springer eBooks · doi:10.1007/978-3-032-19781-8_4
Tracking Spatial and Activity Patterns in Captive Reptiles Using Deep Learning
Ferrero, V., Friard, O., & Gamba, M. (2026) · Conservation · doi:10.3390/conservation6020061
Metadata
- Authors
- Grieco, F., Bernstein, B. J., Biemans, B., Bikovski, L., Burnett, C. J., Cushman, J. D., van Dam, E. A., Fry, S. A., Richmond-Hacham, B., Homberg, J. R., Kas, M. J. H., Kessels, H. W., Koopmans, B., Krashes, M. J., Krishnan, V., Logan, S., Loos, M., McCann, K. E., Parduzi, Q., Pick, C. G., Prevot, T. D., Riedel, G., Robinson, L., Sadighi, M., Smit, A. B., Sonntag, W., Roelofs, R. F., Tegelenbosch, R. A. J., & Noldus, L. P. J. J.
- Affiliations
- Noldus Information Technology (NL)
- National Institutes of Health (US)
- F. Hoffmann-La Roche AG (CH)
- Tel Aviv University (IL)
- Icahn School of Medicine at Mount Sinai (US)
- Radboud University Medical Center (NL)
- University of Groningen (NL)
- University of Amsterdam (NL)
- Sylics (Netherlands) (NL)
- Baylor College of Medicine (US)
- University of Oklahoma Health Sciences Center (US)
- University of Aberdeen (GB)
- Vrije Universiteit Amsterdam (NL)
- Radboud University Nijmegen (NL)
- Corresponding author
- Noldus, Lucas P.J.J.
- ORCID
- Grieco, Fabrizio
- Bernstein, Briana J.
- Biemans, Barbara
- Bikovski, Lior
- Burnett, C. Joseph
- Cushman, Jesse D.
- van Dam, Elsbeth A.
- Fry, Sydney A.
- Richmond-Hacham, Bar
- Homberg, Judith R.
- Kas, Martien J. H.
- Kessels, Helmut W.
- Koopmans, Bastijn
- Krashes, Michael J.
- Krishnan, Vaishnav
- Logan, Sreemathi
- Loos, Maarten
- McCann, Katharine E.
- Parduzi, Qendresa
- Pick, Chaim G.
- Riedel, Gernot
- Robinson, Lianne
- Smit, August B.
- Sonntag, William
- Noldus, Lucas P.J.J.
- Venue
- Frontiers in Behavioral Neuroscience
- Publisher
- Frontiers Media SA
- Published
- 2021-09-24
- Volume
- 15
- Pages
- 735387-735387
- ISSN
- 1662-5153 (ISSN-L)
- PMC
- PMC8498589
- OpenAlex
- W3200442339
- Cited by
- 109
- References
- 255
- Citations by year
- 2026: 21 · 2025: 36 · 2024: 16 · 2023: 25 · 2022: 11
- FWCI
- 14.84
- Type
- journal article
- Language
- en
- Open access
- gold
- doi.org
- Licence
- Locations
- Frontiers in Behavioral Neuroscience (publishedVersion, cc-by)
- Europe PMC (PubMed Central) (publishedVersion, other-oa)
- PubMed Central (publishedVersion, cc-by)
- PubMed (publishedVersion)
- VU Research Portal (publishedVersion, other-oa)
- UvA-DARE (University of Amsterdam) (submittedVersion, other-oa)
- Radboud Repository (Radboud University) (submittedVersion, other-oa)
- Aberdeen University Research Archive (Aberdeen University) (submittedVersion)
- DOAJ (DOAJ: Directory of Open Access Journals) (submittedVersion, cc-by-sa)
- University of Groningen research database (University of Groningen / Centre for Information Technology) (submittedVersion, cc-by)
- Data Archiving and Networked Services (DANS) (submittedVersion, other-oa)
- Funders
- National Institutes of Health
- National Institute on Aging (R00AG056662)
- National Institute of General Medical Sciences (P20GM125528)
- Topics
- Life Sciences › Agricultural and Biological Sciences › Animal Science and Zoology › Animal Behavior and Welfare Studies
- Life Sciences › Neuroscience › Cellular and Molecular Neuroscience › Neuroscience and Neuropharmacology Research
- Life Sciences › Neuroscience › Cognitive Neuroscience › Memory and Neural Mechanisms
- Keywords
- home cage monitoring, automated video tracking, digital biomarkers, rodent behavior, replication crisis, human disturbance, biotelemetry, optogenetics, behavioral segmentation, neuropharmacology, animal models of neurodegeneration, within-subject analysis
About these checks
Registry, retraction, Cites and statistics results are computed, not judged, with one exception: a printed reference that no index lists is read once by a model before it counts as a citation error. Claims are extracted by a model and kept only when their quote appears verbatim in the text; each cited source is then checked, with a model’s help, for whether it says what the claim relies on. Those verdicts can be wrong — read the claim’s quote and the cited source before relying on one.
Statistics and arithmetic are recomputed, not judged.
Confidence bands are shown only for fields calibrated on our annotated test set. None is calibrated yet, so no band is shown.
What counts as a claim ›How we measure confidence ›How we check this ›
Are you an author, or do you see a problem with this page? Request a review
